Introduction
Availability of intraday data allows
re-search in the field of market microstructure emerged rapidly. Intraday data allows re
-search in trade base or order base more comprehensive. Measurements with intraday data are used to describe the characteristics or performance of a capital market, such as measures of liquidity. One purpose of the capital market establishment is to cre
-ate a liquid market. However, the notion of liquidity itself is still in debate among the experts. One of the generally accepted definitions of liquidity is as an ability to con
-vert shares into cash at low transaction costs. Understanding of the change in liquidity is also important from public and firms’ policy point of view. Amihud and Mendelson (1988) argue that
firms had incentives for the liquidity increase of the financial claims they issued since this might increase their values. Therefore, the decreasing liquidity in emerging markets may also induce corporations to cross list their stocks in more liquid and developed markets, and thereby hin
-dering domestic market development (Tandeli
-lin, 2002).
Researchers in the field of capital market liquidity use different measure
-ments. Usually the measurement of liquid
-ity can be divided into two categories, namely trade based and order based. Selec
-tion of measuring devices becomes very important considering the conclusions of the research could affect the liquidity of the market structure changes. In concept, liquid
-ity expresses how fast a stock is executed on the market. With speed concept, then the ele
-(Case of Pre Opening Session on IDX)
Luluk Kholisoh*
STIE Nusa Megarkencana, Yogyakarta, Indonesia
The aim of this study is to develop a new liquidity measurement. The mechanical approach is used to measure the liquidity. This study uses trade order base that is more pronounced than conventional
ones. To confirm the result of this study, we use pre opening session in the term of event as Kholisoh and Hermawati (2010) and Kholisoh (2011). This study collects trade base and order base intraday data one month period before and after pre opening session was implemented with the 25 most active stocks in LQ45. This study examines the velocity (how fast the order is executed) as new liquidity measurement. The result of this study confirms Kholisoh (2011), but contradicts to Kholisoh and Her -mawati (2010) in the same event. The use of “velocity” as a metric of liquidity measurement is better
in understanding the theoretical wisdom. This new liquidity measurement can cover the speed of the order to be executed in all capital market.
Keywords: Market microstructure, opening call, liquidity measurement, velocity
ment of time is one component that should be included in formulating liquidity. Given the importance of measuring instruments that better reflect the performance of capital market, forming trade and order data for measuring liquidity is the subject of this study. This study is interesting because in Indonesia there is still a few who do research in the field of market microstructure, particularly to make a new formula as a measurement of performance of a capital market. The new measurement in this study is expected to contribute the develop
-ment of methodologies in the field of market microstructure, especially in capital markets. In addition, intraday data allows this study to ex
-plore more widely against the new findings as a contribution to the market information.
This study uses pre opening session imple
-mentation as the event to apply the new liquid
-ity measurement. The objective of this study is to see the impact of pre opening session on market liquidity, especially in comparing dif
-ferent measurements. Kholisoh and Hermawati (2010), using trade and order base, find evi
-dence that pre opening session does not impact market volatility and market liquidity.
The results of the analysis provide in
-sights of the factors in which the observed differences in the periods of before and af
-ter pre opening session is implemented. It has important implications for investors seek
-ing liquid assets in their portfolios. This study makes a first pass attempt to provide an anal
-ysis of the impact of pre opening session on liquidity, especially on the level of firms’ stock by using new liquidity measurement. The objective of this study is to highlight the use of new liquidity measurement for appropriate measurement to cover the speed of information flow in capital market.
Using the same sample size, this study impacts market liquidity, indicating less time consumed for such an order become executed. Although there is no increasing trade volume
and value after pre opening session, there is an increasing ability to execute the order.
The following sections provide a body of pa
-per including review of related studies, research method, and result discussion. Conclusion of the paper can be found in the last section.
Literature Review
Liquidity refers to how quick and how cheap
investors can trade an asset when they want
to. Harris (1990) notes that a perfectly liquid market is the one where any amount of a given security can be instantaneously converted into cash and back to securities at no cost. In a less than perfect world, a liquid market is one where
the transaction costs associated with this
con-version are minimized.
Although liquidity seems easy to measure, in fact, some experts find difficulty. In the lit
-erature, there are liquidity measurements used. Aitken and Winn (1997) in Aitken and Comer
-ton-Forde (2003) find approximately 68 meas
-urements of liquidity and have not reached an agreement. In theory, the measurement of liquidity can be divided into two categories, based on trade and based on order.
Trade based measures
Trade based measures are common
-ly used by researchers. Trading value, trading volume, the number of trades (frequen
-cy), and the turnover are widely used in meas
-uring liquidity. These measures are very sim
-ple and easy to be used, but still problematic when measuring what happen in the future. The problems arise when using ex post measure are when all information are released and transac
-tions are traded. These measures fail to indicate the ability of investors to transact immediately and the cost associated with this, which is the essence of liquidity (Aitken and Comerton-Forde, 2003).
Thus, there will be inconsistencies in the measurement results of transaction based li
-quidity. Researchers will have difficulties in making conclusions about the measurement re
Order based measures
Order based measures are also commonly used in many researches, including spread, rel
-ative spread, depth, and rel-ative depth. These measures are more complex and so many data must be used. Using order based measures is appropriate to indicate the motive of investors.
Measurement based orders better reflect the expectations of investors rather than transaction based measurement. Still, there is no time vari
-able in liquidity measurement.
Research Method
This study uses the same method as Kholisoh and Hermawati (2010) and Kholisoh (2011). This study uses one month period before and after pre opening session was implemented with the 25 most active stocks in LQ45. The implementation of this new trading rule is di
-vided into five time periods. Four stocks are im
-plemented on 5th February 2004; six stocks on 8th March 2004; five stocks on 23rd March 2004; five stocks on 6thApril 2004; and five stocks on 19th April 2004.
The data used in this study is taken from the JATS database maintained by the
Database of Pasar Modal Universitas Gadjah Mada (DPMUGM). The JATS database pro
-vides details of all transactions and order books data. The transactions and order contain all in
-formation from date transaction and order and the identity of investors. This study focuses on transaction and order in the regular market.
Liquidity is measured by “velocity” as how fast the order can be executed in capital market. So, this study mixes trade base and order base intraday data. Finding the speed of the order executed is done by matching the order num
-ber of these two based measurements. As the initial step, we find “time” as the difference be
-tween trading time and order time. Time factor becomes the decisive factor in measuring one of the speed of an executed stock that has never been included in the formulation of liquidity in previous studies, including Aitken and Com
-merton-Forde (2003). The difference between order and execution time can be traced from the
order number on the transaction data and order data. Order number is the keyword to measure the time difference in the two data. SAS is used to manage two different data.
Blending the two disciplines will result in a formulation that is quite creative. Mechanics (in physics) is a discipline that serves as the ap
-proach in this research in formulating the meas
-urement of liquidity. If liquidity is the concept defined as "how fast" associated with "velocity" (v) and "time" execution associated with "time"
(t), then the "distance" (s) can be adjusted with
what is more variable affecting whether or not a long time transaction in execution. The results of some previous studies find evidence that the magnitude of the order price is more influenced executed or not an order (other than volume or
-ders). Thus, the order price as a variable meas
-uring "distance" (s) are quite acceptable.
So, the formulation of new liquidity meas
-urement proposed in this study is:
Velocity (v) =
Average Order Price
Average time 1)
The significant difference between velocity before and after pre opening session is performed using t-test. This is usu
-ally used in many researches to compare two a) transaction before pre-opening ses
-sion, and b) transaction after pre-opening session.
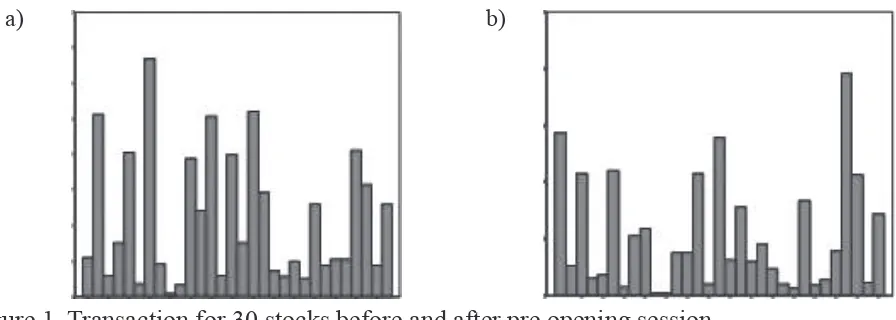
The sample of 30 stocks represents approxi
-mately 80% of the volume traded on the IDX. Table 1 provides descriptive statistics about the average, volume, value, and time for one month period of the whole sample stocks for pre and post opening call.
in 13 minutes and 31.45 seconds at before pre opening session. An order can be executed in 11 minutes and 35.77 seconds at after pre open
-ing session period. The same pattern also pre
-sents in average volume and average value. The average volume and average value at after pre opening session period is higher than before pre opening session period.
Table 2 shows that after pre opening session, the market is more liquid than before pre open
-ing session. V1 is defined as velocity of average
price divided by average time, and V2 is defined
as velocity of average volume divided by aver
-age time.
To show the effectiveness of new liquid
-ity measurement, this study compares it to the other measurements. Table 3 presents a com
-parison of the liquidity measurements based on trade, order, and trade order of the whole sample stocks. The table also reports the t-statistic for
different trading rules in each liquidity meas
-urement. Based on the trade, only one of four metrics (value) is significant at 10% level. For order base, two of four metrics are significant at 1% level. Finally, for trade order base, time is significant at 1% level. It seems there is some kind of hierarchical measurement. These results demonstrate that there is a significant effect on liquidity by new measurement. At the level of 1%, the opening call improves market liquidity.
The analysis shows that there is a sig
-nificant difference in average time between
before and after pre opening session. The av
-erage time required in execution period before pre opening session is 13 minutes 31.45 sec
-onds, while the average time required in ex
-ecution period after pre opening session is 11 minutes 35.77 seconds. The time difference be
-tween the two test periods with t-test is signifi
-cant at 1% level. It means that the time required to execute on a stock after pre opening session is shorter than before pre opening session. This shows that changes of trading mechanism im
-pact on orders are executed faster. One yard
-stick to measure whether or not liquid capital markets can be seen from how fast a stock ex
-ecuted. The result of this study has shown that the change in market mechanism influences market liquidity. Thus, these results support the findings by Commerton-Forde (1999), which states that the system call at the opening will create a liquid and efficient market.
The result shows significant difference on average time an order is executed. Using time metric is useful to measure how fast an order of stocks can be executed. Research in illiquid
-ity area should be considered on time variable when using liquidity measurement. However, this study is not perfect. Time variable is enough to serve as a measure of liquidity, but will be more complete if the next studies also measure the speed. In the velocity measurements, it will be seen in detail for each price category.
Table 1. Descriptive statistics of the average volume, value, and time of sample stocks, pre and post opening call
Period Average time Average volume Average value (Rp.)
Pre-Opening 00:13:31.45 48,614.66 7.5x10+7
Post-Opening 00:11:35.77 57,116.78 1.0x10+8
a) b)
Conclusion
By using event study method on intraday data, this study indicates that the average time period after pre opening session on the Indone
-sia stock is shorter than the average time period before pre opening session. The difference is significant at 1% level. Liquidity measurement by looking at the differences in average time on event study is still relevant to the purposes and objectives of this research.
This research still has several limitations. It is still possible to improve the model by collab
-orating with several teams of experts from both academic and practitioner side that controls the activity of trading in the Indonesian capital mar
-ket. In addition, the SAS program is necessary to improve the way trials and control systems and procedures for standard orders. However, the preparation of the program is still experi
-encing technical obstacles so that the formula
-tion of the measurement of liquidity can only be seen from the side of the time, that is, the aver
-age time required for a stock to be executed. Future research should consider the speed of an order executed beside time variable.
Table 3. Comparison of the liquidity measurements by trade base, order base, and trade order base
Before After Change t-statistic
Trade base
Volume 48,614.66 57,116.78 8,502.12 0.73
Relative volume 0.0006 0.0007 0.0001 1.24
Frequency 38.8254 40.1036 1.2782 0.56
Value 7.5x10+7 1.0x10+8 2.7x10+7 1.65*
Order base
Spreads -11.1533 -10.1020 1.0513 0.351
Relative spreads 0.0027 0.0011 -0.0016 -1.21
Depth 62,712.34 213,522 150,809.6 3.63***
Relative depth 0.00003 0.00005 0.00002 2.67***
Trade order base
Time 00:13:31.45 00:11:35.77 -1:55.68 -5.6590***
Velocity (by price) 370.37 421.46
Velocity (by volume) 3915.97 5497.76
Data is taken from Kholisoh (2011) *Significant at the 10% level. ***Significant at the 1% level.
Table 2. Average liquidity
Period V1 V2
Before After
370.37
421.46 3915.975497.76
References
Aitken, M. and Comerton-Forde, C. (2003), How Should Liquidity Be Measured?,
Pa-cific-Basin Finance Journal, 11:45-59. Amihud, Y. and Mendelson, H. (1987), Trading
Mechanism and Stock Returns: An Empiri
-cal Investigation, Journal of Finance, 42: 533-553.
Amihud, Y. and Mendelson, H.(1991), Volatil
-ity, Efficiency, and Trading: Evidence from
the Japanese Stock Market, Journal of Fi -nance, 46: 1765-1789.
Amihud, Y., Mendelson, H., and Lauterbach, B. (1997), Market Microstructure and Se
-curities Values: Evidence from the Tel Aviv Stock Exchange, Journal of Financial Eco -nomics, 45: 365-390.
-ing Bombay Stock Exchange Data, Journal of Finance Economics, 47: 339-355.
Chang, R.P., Rhee, S.G., and Soedigno, S. (1995), Price Volatility of Indonesian Stocks, Pacific Basin Finance Journal, 3: 337-355. Chang, R.P., Hsu, S.T., Huang, N.K., and Rhee,
S.G. (1999), The Effects of Trading Meth
-ods on Volatility and Liquidity: Evidence from the Taiwan Stock Exchange, Journal of Business Finance and Accounting, 26: 137-170.
Comerton-Forde, C. (1999), Do Trading Rules Impact on Market Efficiency? A Compari
-son of Opening Procedures on the Australian and Jakarta Stock Exchange, Pacific Basin Finance Journal, 7: 495-521.
Harris, L.E. (1990), Liquidity, Trading Rules and Electronic Trading Systems, New York University Salomon Center.
Hasbrouck, J. (1991), Security Markets, Infor
-mation, and Liquidity, Financial Practice and Education, Fall/Winter: 7-16.
Kholisoh, L. (2011), What’s Going on with Li
-quidity Measurement? Case of Pre-opening Session on IDX, Working Paper.
Kholisoh, L. and Hermawati, S. (2010), Does Pre-opening Session Impact Market Volatility and Liquidity? An Empiri
-cal Evidences from the Indonesian Stock Exchange, Indonesia: Proceeding of 7th UBAYA Annual International Symposium, Surabaya.
Roll, H.R.(1992), Principles of Trading Mar
-ket Structure, Journal of Financial Services Research.
Tandelilin, E. (2002), The Impact of Asian Financial Crisis on Stocks’ Behavior: Evi
-dence from Jakarta Stock Exchange,