PATH ANALYSIS COMMUNICATION MODEL OF
COOPERATION ORGANIZATION IN THE DEVELOPMENT
AGRICULTURAL MECHANIZATION
(VILLAGE UNIT COOPERATIVE/VUC RICE MILLING
UTILIZATION CASE IN
KARAWANG AND CIANJUR DISTRICT
WEST JAVA PROVINCE)
Parlaungan Adil Rangkuti
Lecturer of Agricultural Technology Faculty, Bogor Agricultural University
Amiruddin Saleh
Lecturer of Human Ecology Faculty, Bogor Agricultural University Jl. Dermaga, Bogor, Indonesia
email: [email protected], Mobile: 085880535240
ABSTRACT
The objectives of this research were (1) to explain VUC organization communication factors which are the key in improving the VUC performance, (2) to explain VUC organization communication
factors that become the key in developing the VUC capacity, and (3) to formulate defined strategy
in improving the VUC quality service as the agricultural economic organization for agricultural mechanization development. Active category of VUC sample as analysis unit was determined
by each of five VUC samples at Karawang and Cianjur District. From each VUC sample, thirty
respondents that use rice milling of VUC, were taken. This research was designed using survey method with multi analysis approaches, they were: descriptive analysis and path analysis using SEM (Structural Equation Model) analysis with LISREL analysis support. The primer and
secondary data were collected from December 2009 to March 2010. The result of this research showed that (1) according to the similarity test model referring to the goodness of fit criteria
from SEM analysis showed that VUC organization communication model is good, (2) level of
performance, capacity, and quality of VUC service at Karawang and Cianjur District classified as low,(3) determinant factors which have real influence on the low performance and capacity
of VUC are low quality of information, inconvenient organization communication environment, and low intensity of public organization communication, (4) determinant factors which have real
influence on the low quality of VUC service are low quality of VUC personnel characteristic
and weak VUC organization communication process, and (5) improvement strategy of VUC quality service should be done by developing VUC organization communication model through agricultural information system development in the centers of agriculture production in each rural area towards modern agriculture.
INTRODUCTION
One of barriers to national development is low participation of farmer as a result hasn’t been
effective communication between farm’s actors with information resources, either to government or
other information resources. Towards optimizing the utilization of natural resources and potential
empowerment of human resource in the agricultural development necessary new paradigm of
agricultural development communication for increasing the efficiency and affectivity of communication
along with agricultural science and technology progress also technology of communication and
global trade competition.
Mosher (1970) formularizes the modern agriculture development paradigm that refers to rational
attitude, market orientation, impersonal institutional net, future orientation and application of science
and technology to do activities of an increasingly modern farming. For developing modern agriculture
need pay attention to environments sustainable by applying sustainable development with adjust
an appropriate technology including applying an appliance technology and agriculture machine
(alsintan) for agricultural mechanization development (agricultural mechanization). Agricultural
mechanization development already need for farmers to increase their quality and quantity of
production from pre harvest to post harvest activities.
Selective application of alsintan has had a role in improving efficiency and quality of production
with appropriate technology and more cost competitive. Adoption of technological innovations for
the development of agricultural mechanization had evolved as a process of transformation of science
and technology through agricultural extension programs conducted by the government (Handaka,
1996). Application of alsintan by farmers was developing as adoption of technology innovation
through process of communication with extension system and using Cooperation organization
(VUC) as the container development toward a modern farming. Nevertheless in the Globalization
era, adoption process of agriculture technology innovation has decreased as result of information
systems that were not able to follow the speed of changes that occur in the progress of communication
technology and agricultural technology associated with management of agriculture resources and
global environment.
Given the principles of cooperation associated with Act. 25 year 1992 concerning Cooperation
showed that the success of a cooperation was largely determined by the performance, capacity and
service quality of farm cooperation to meet the interests of members. With the growing development
of communication technology and agriculture technology, transformation and adoption of information
technology innovation were key to improving performance, capacity and service quality of VUC.
Along with the development of communication sciences development, the role of organizational
communication of VUC increasingly important in building a more modern farming. Organizational
communication of VUC regarding the structure of human relationships and the various elements of
VUC organization where all the elements contained therein were interrelated such as: the quality of
information, communication climate of VUC organization, the intensity of public communication
of VUC organization, personnel characteristics of VUC and communication processes of VUC
Generally, the purpose of this study is to analyze the relationship between variables or path
communication model cooperation organizations to improve performance, capacity and service quality
in the utilization of rice milling cooperation to members within the framework of the development
of farmer cooperation and agricultural mechanization. On the basis of the thinking that has broken
down and the problem as already stated above, this research specifically aims to: (1) Explaining
organizational communication factors of VUC which are become decisive in VUC performance
improvement, (2) Describe the communication organization factors of VUC which became decisive
in increasing the capacity of VUC and (3) To formulate appropriate strategies to improve the quality
of service cooperation as an economic organization of farmers in the development of agricultural
mechanization.
THEORETICAL FRAMEWORK AND HYPOTHESIS DEVELOPMENT
SEM Application Procedure
According to Kusnendi (2008), model was the construction of theoretical framework or research
that was formulated in the form of diagrams and / or certain mathematical equations, and essentially
states the research hypotheses. To check compatibility or suitability of organizational communication
models that had been designed to test compatibility with path analysis model diagram or path analysis.
VUC organizational communication model in Karawang and Cianjur Districts in this study were
analyzed using structural equation models or SEM. In the analysis of SEM measurement models
and structural models were integrated to form a basic model or a hybrid model that uses indicator
covariance matrix between variables.
SEM procedure generally contain several phases of activities namely: (1) Model specification, (2) Identification, (3) Estimates, (4) Test the model fit and (5) Respectification. Model specification
was done by specifying the model of research that was rooted in the theory and results relevant to
research formulated a framework of thought and then submitted the structural model that can be
identified variables and indicators for each variable. The next step is to translate the model into the
path diagram and convert into the measurement equation and structural variables. In LISREL format,
which analyzed the data input was intended to obtain statistical data in the form of covariance matrix
or correlation matrix that was used to analyze the pattern of causal relationships between variable.
The device provides a program LISREL SIMPLIS (Simple LISREL) to analyze each stage of SEM
procedures (Kusnendi, 2008).
Path analysis conducted to determine the direct and indirect influence of a number of variables
bound to free variables that had been directly observed each of the indicators that had been formulated
in a model of organizational communication of VUC in the Karawang District and Cianjur District. Data
analysis performed with SIMPLIS application (Simple-lisrel) to make meaning of SEM path diagram
with the help of the program LISREL 8.30. Results of analysis with SIMPLIS application displays a
simple diagram with the parameter estimation data from organizational communication model of VUC
Based on the research problem formulation, research objectives, literature review and framework
of thought, where the main hypothetical or hypothesis tested in this research were as follows:
1. VUC performance improvement was influenced significantly by the organization's information
of VUC, organizational climate and intensity of public communication of VUC?
2. VUC capacity development in improving the utilization services of VUC rice mill significantly influenced by the VUC performance, VUC personnel characteristics and organizational
communication processes of VUC?
METHODS
This study design was a combination of explanatory research with descriptive research and
testing of hypotheses, thus this research method using survey methods with multi-analysis approach
include: descriptive analysis, correlation and path analysis (path analysis). In this research analysis
of structural equation model used to explain the factors that allegedly relate to the performance of
cooperation, capacity and service quality of VUC organizations in utilization of rice mills. Thus, this
study design was descriptive correlation survey with multi-analysis approach using the SEM with
help of statistical program LISREL (Linear Structural Relationships) version 8.30.
Location selection research was done on purpose (purposive), that research conducted in Province
of West Java with a shot in the northern coastal area (lowlands), namely the Karawang District, and
in the south (mountains), ie, Cianjur District. Research was done in two phases namely: (1) Test the
validity and reliability of the instrument by testing the questionnaire and (2) Collecting of secondary
data and primary data. Pilot questionnaire conducted in VUC Marga Mukti, Cianjur District through
direct interviews with 30 respondents on December 5th to 16th 2009. Collecting secondary and
primary data conducted at the study site Karawang and Cianjur District on December 20th, 2009
through the end of March 2010.
The population in this study is VUC’s personnel who are registered as members of VUC. From
VUC with moderately active category are determined respectively as five VUC samples of research
in Karawang and Cianjur District. Taking the models of VUC carried to the VUC quite active
categories were randomly stratified or stratified random sample. The observation of the condition
of 42 cooperation in the Karawang District showed that based on the three groupings of VUC quite
active there are nine VUC (21.4 percent), 18 VUC still active (42.9 percent) and 15 VUC inactive
(35.7 percent). Condition 36 VUC in Cianjur District indicate that there are eight VUC quite active
(22.2 percent), 16 VUC still active (44.5 percent) and 12 VUC inactive (33.3 percent). List of names
in the Karawang District VUC samples are : (1) Sri Mulya, (2) Sumber Padi, (3) Warga Bakti, (4)
Warga Tani, (5) Mitra Tani and in Cianjur District VUC samples are (1) Pelita Jaya (2) Betah, (3)
Karya Simpati, (4) Sari Mekar, (5) Karya Mekar.
Remember the number of members of cooperatives that were too large, the respondents
determined nonproporsional. On the basis of these considerations the respondents in this study were
rice mills, which were grouped into two groups namely: active and inactive groups. Of the 100 names
of users of these rice mills VUC 30 respondents drew randomly each VUC sample at each study site.
In the writing test was limited to a match with the SEM results of communications model cooperative
organizations in the development of agricultural mechanization in Karawang and Cianjur District.
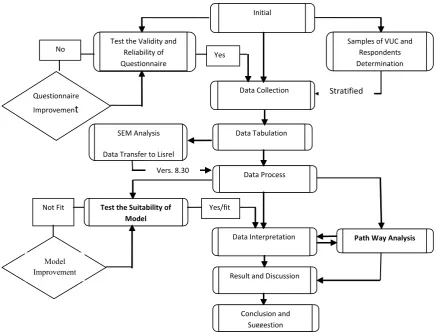
Flow chart of research activities can be seen in Figure 1.
Figure 1: Flow Chart of Research Activity
Questionnaire
Improvement
Initial
Survey
Samples of VUC and Respondents Determination
Data Collection Test the Validity and
Reliability of Questionnaire
SEM Analysis
Data Transfer to Lisrel
Data Process
Test the Suitability of Model
Data Tabulation
Result and Discussion
Data Interpretation Path Way Analysis
Yes/fit Vers. 8.30
Stratified
random
No
Conclusion and Suggestion Yes
Not Fit
Model Improvement
RESULT AND DISCUSSION
Test of Communication Model Suitability of VUC Organization
SEM analysis is basically test a structural model that can be used to predict a model and to
determine the level of influence between free variables and bound variables. Path analysis with
SEM to test the causal relationship between variables. Causal relationship between variables was
visualized in the form of diagrams and to determine the suitability of the model could be done
through the compatibility test measurement model. By using SIMPLIS 8:30 to produce a model path
diagram based on the criteria of goodness of fit (GOF).
According to Kusnendi (2008) and Sugiyono (2010) compatibility test between theoretical models
diagram that was the value of: Chi-square, Goodness-of-Fit Index (GFI), Root Mean Square Error of
Approximation (RMSEA), Adjusted Goodness of Fit Index (AGFI) and the Comparative Fit Index
(CFI). As a reference of the structural model of the relationship compatibility test factors that affect
each variable used several criteria namely: Chi-square value that the smaller was better, RSMEA
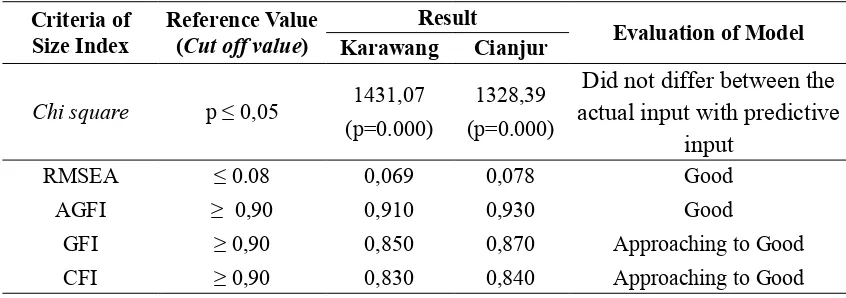
value ≤ 0.08; value of GFI ≥ 0.90; value of AGFI ≥ 0, 90; CFI values ≥ 0.90. According Kusnandi (2008) measure of absolute fit most major versions of LISREL analysis is the value of chi-square
and RMSEA that could be known from the output path diagram view LISREL analysis. Furthermore
Wijanto (2008) asserted that the chi-square used to test how close a match between the sample
covariance matrix with covariance matrix model was chi-square distribution indicated by the value
of p ≥ 0.05. To complement the results of chi-square used RMSEA value that was indicated by value ≤ 0.08.
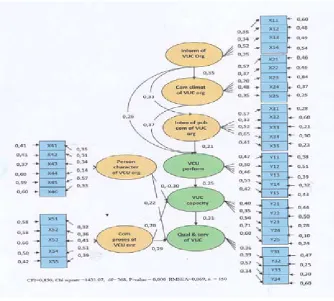
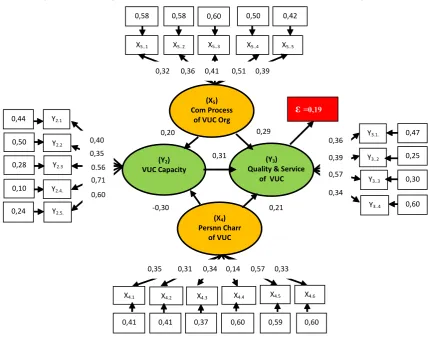
Figure 2: Path Diagram of Organizational Communication Model of VUC in Karawang District
From the path diagram of organizational communication model of VUC in the Karawang District,
as shown in Figure 2 shows that in the Karawang District calculate p-value = 0.000 <0.05, chi-square
value of 1431.07, RMSEA = 0.069 value <than 0.08; value AGFI = 0.910> 0.90, GFI = 0.850 value
close to 0.90, CFI = 0.830 value close to 0.90. From the SEM image path diagram could be know the
path coefficient between variables, measurement error value (error), confirmatory factor coefficients
and measurement error for each indicator variable and the results of analysis of the relationship
between variables.
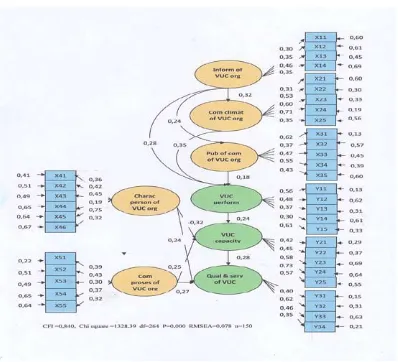
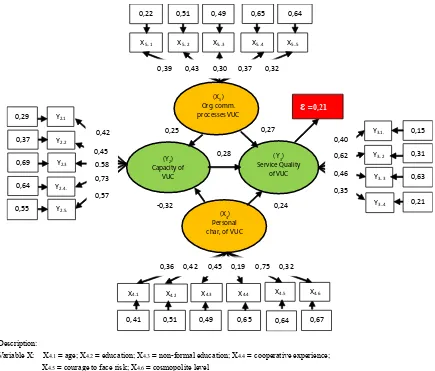
shown in Figure 3 shows that the calculated p value = 0.000 <0.05, chi-square value of 1328.39,
RMSEA = 0.078 value <than 0.08, the AGFI = 0.930 > 0.90, GFI = 0.870 value close to 0.90, CFI
= 0.840 value close to 0.90. The result of path diagram for each model parameter estimation VUC
organizational communication in Karawang and Cianjur District seen that the values associated with
test criteria based on the model fit GOF test showed that overall quite fit (good) and closed to good (marginal fit).
Figure 3: Path Diagram Organizational Communication of VUC in Cianjur District
The measure index value of goodness of fit in Cianjur District looked a little higher or means
better than in the Karawang District. According to Kusnandi (2008) and Wijanto (2008) if the test
result matches the communication model met the criteria of the index size was feasible model was
developed. With more detailed attention to the path coefficient value of variables, the coefficient
of each indicator and the error in the model path diagram VUC organizational communication at
each study site there were some similarities and some differences, indicating that characteristics also
determine the location of the building VUC professional and modern farming. In detail the results of
goodness of fit refers to the criteria of the index size chart analysis and SEM in the Karawang District
Table 1: Result of Goodness of Fit Model of Organizational Communication Organization of VUC Sample in Karawang District and Cianjur District
Criteria of
Chi square p ≤ 0,05 1431,07
(p=0.000)
1328,39
(p=0.000)
Did not differ between the
actual input with predictive
Performance Improvement of VUC
From the path diagram of structural model of VUC’s performance in the Karawang District in
Figure 4 showed that generally, VUC’s performance condition was relative weak as result from poor
quality of VUC organization information, VUC organizational climate was not conducive and the
weak intensity of public communication of VUC organization. The low communication climate of
VUC organizations supported by the versatile role of weak indicators such as low levels of relevance,
accuracy, completeness and timeliness of any information received by VUC personnel. Similarly,
the role of organizational climate of VUC had not been able to create conducive conditions such as
increased support from its members, building openness, develop togetherness, create trust and foster
a sense of justice of VUC.
The intensity condition of public communication of VUC organizations were also classified as
still weak mainly due to private parties who had not shown a meaningful role. The role of community
leaders and customer communications of VUC was a very dominant factor in the intensity of public
communication to give an effect to the performance of cooperation. The role of government in public
communications organization looked even decline was replaced by the role of community leaders and
intensity of public communication of VUC customer. The role of government in the intensity of public
communication related to VUC organizational communication associated with the development of
cooperatives decreased along with government policies that revoke some coaching facilities to VUC.
In addition, decreasing the intensity of public communication VUC organization also occur due to
local government policies that made several mutations employees within the agency associated with
the cooperative.
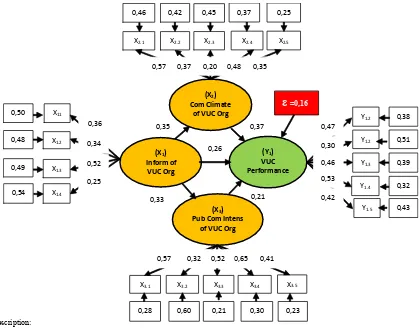
More details of Figure 4 showed that the dominant factor which directly affects the VUC
performance in a row was a variable of the VUC organizational climate, quality and intensity of VUC
organization information of public communication with the path coefficient (r) respectively were
0.37, 0.26 and 0.21. There was measurement error value (error) at the level of VUC performance of
0.16 means that there were 16 percent of other factors that give effect to increase the performance of
cooperation in the Karawang District. Climatic factors directly affect most of the VUC performance
coefficient of each factor of 0.57 and 0.48. In accordance with the principles of cooperation in which
the common good is the main characteristic of the formation of cooperation, the factor of support
and trust the members to the VUC is an important determinant of the success of a cooperation. So to
create a conducive organizational climate of VUC in improving performance needs to be seriously
further improving the support and trust the members to the cooperation can be created.
Figure 4: Path Diagram of Performance Structural Model of VUC in Karawang District
Description:
Variable X : X1.1 = relevance; X1.2 = accurate; X1.3 = completeness; X1.4 = timeliness
X2.1 = support member; X2.2 = openness; X2.3 = togetherness; X2.4= trust; X2.5 = justice X3.1 = government; X3.2= private; X3.3= customer; X3.4= comm leader; X3.5= internal VUC
Variable Y : Y1.1 = leadership; Y1.2= supervisory role; Y1.3= program implementer; Y1.4= tech application; Y1.5= RAT implementer
Dominant direct effect of quality factor of VUC organizational information toward VUC
performance (r = 0.26) with the dominant influence was the aspect of completeness of the information with the value of the coefficient of 0.52 factor. Dominant direct influence from intensity
factors of public communication of VUC organization is an aspect of community leaders with a
coefficient factor of 0.65 and it’s followed by customer indicator and internal of VUC with each factor coefficient 0.52 and 0.4. It is revealed that the completeness of the information and public figures were very dominant role played directly on improving the performance of VUC. Can be
understood that with incomplete information and even less the role of community leaders in VUC
organizational communication increasingly difficult for VUC to develop as a more advanced farming cooperation. Indirectly influenced by the performance of the VUC organization’s information through
VUC organizational climate and public communication intensity of VUC organization with path
coefficient (r) respectively 0.35 and 0.33. Indicators factor of private occupy the intensity level of
public communication of VUC organization lowest in the Karawang District.
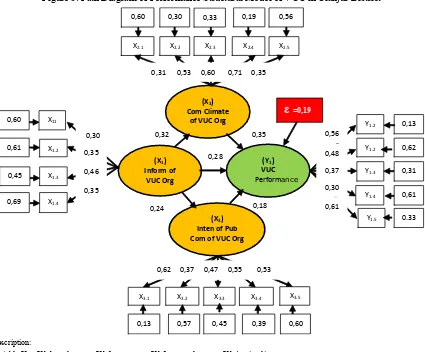
As shown in Figure 5, shows that the performance of cooperation in Cianjur District has a
relatively same condition that was relatively weak compared with the VUC performance categories
in the Karawang District. In more detail showed that the climatic conditions of organizational
communication in Cianjur District was dominated by the influence factor of trust and support of
members to the creation of the conduciveness of VUC organizational communication climate. The
level of performance was dominated by the role of the implementation of RAT were considered by the
members of cooperation as a democratic medium that determine the success of farmers’ cooperation
as an economic organization
Figure 5: Path Diagram of Performance Structural Model of VUC in Cianjur District
.
Description:
Variable X : X1.1 = relevance; X1.2 = accurate; X1.3 = completeness; X1.4 = timeliness
X2.1 = member support; X2.2 = openness; X2.3 = togetherness; X2.4= trust; X2.5 = justice X3.1 = government; X3.2= private; X3.3= customer; X3.4= comm. leader; X3.5= internal VUC
Variable Y : Y1.1 = leadership; Y1.2= supervisor role; Y1.3= progm. Implementer; Y1.4= tech application; Y1.5= RAT implementer
The overall rate of VUC performance in Cianjur District directly influenced by VUC organization’s
information factors, VUC organizational climate and intensity of public communication of VUC
organization with path coefficient (r) with each value was 0.28, 0.35 and 0.18 . Indirectly influenced
by the VUC organizational information performance through the intensity of organizational climate
and public communication of VUC organization with path coefficient (r) respectively 0.24 and
0.32. Error value Measurement (error) on the VUC performance level of 0.19. In fact, often found
VUC personnel to obtain and apply information that was incomplete, giving rise to losses in the
development of cooperatives, therefore, in creating quality information to consider completeness of
the information in accordance with the needs of VUC personnel.
The interesting one in Figure 5 is that VUC personnel in Cianjur District very understanding
about the importance of the implementation of the RAT as the highest forum in the cooperatives
as indicated by the value of the coefficient factors from VUC performance indicators variable of 0.61 and application of rice farming technology classified lowest coefficient factor of 0.30. When
observed in depth shows that the organizational information factors of VUC, VUC organizational
climate and intensity of public communication of VUC organizations, both in the Karawang District
and in the Cianjur District was the principal elements that contribute to improving the performance
of VUC.
Capacity Improvement Model of VUC
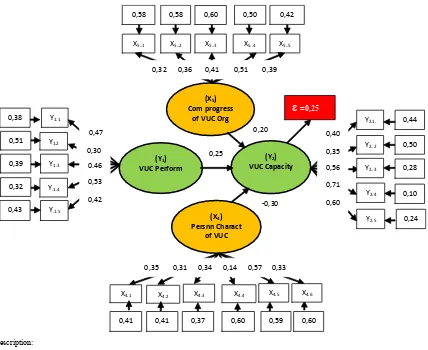
From the diagram path of capacity structural model of VUC in the Karawang District in Figure
6 showed that in general, VUC capacity relatively in weak condition as result of poor performance
of VUC, lacked of VUC personnel characteristics and VUC organizational communication process
had not been optimal. The low performance of VUC as was previously described make an immediate
impact to the low capacity of VUC with the understanding that the higher the performance of VUC
will give an effect to the level of capacity of VUC. Characteristic condition of VUC personnel was a
significant impact on the capacity of VUC by increasing understanding of the characteristics of VUC
personnel can have an impact on decreasing the level of VUC capacity.
The reduced level of VUC capacity could occur due to aspects of education, experience of
cooperation, the courage to face risks and cosmopolite. The increased role of the indicators of the
characteristics of VUC personnel raises the further VUC personnel from cooperation therefore,
efforts to build the characteristics of VUC personnel must consider the principles seriously and
principles of cooperatives were characterized by togetherness and kinship. Conditions at the site
showed that farmers had high courage in facing the risk of using the technology. The dominance of
the influence of high courage in the face of risk can affect the low VUC personnel responsibilities and
negatively impact VUC capacity in achieving program goals or objectives of VUC. In the process
of organizational communication of VUC showed that indicators of communication effectiveness
and quality of communication channels gave an effect to dominate the role of VUC communication
process in the Karawang District, so it can be said that VUC service quality was strongly influenced by
Figure 6: Path Diagram of Structural Model of VUC Capacity in Karawang District
Description:
Variable X: X4.1 = age; X4.2 = education; X4.3 = non-formal education; X4.4 = cooperative experience;
X4.5 = courage to face risk; X4.6 = cosmopolite level
X5.1 = communication flowed; X5.2 = feed back; X5.3 = communication channel; X5.4= communication effectiveness;
X5.5 = communication utilization.
Variable Y: Y1.1 = leadership; Y1.2= supervisory role; Y1.3= program implementer; Y1.4= tech application; Y1.5= RAT application Y2.1 = capital; Y2.2= marketing; Y2.3= input saprotan; Y2.4= human resouces; Y2.5= SHU
More detailed Figure 6 showed that the VUC capacity in the Karawang District was directly
affected by the VUC performance, personnel characteristics and organizational communication
processes of VUC with path coefficient (r) of each is 0.25, and 0.20 -0.30 error value of 0.25. There was a negative value of the coefficient of the characteristics of traffic on the capacity of VUC personnel
and found the courage to face the risk factor was the most dominant factor affecting the level of VUC
capacity as the dominant first order and followed by cooperation experience factors as the dominant
second order. This can be interpreted that high courage in the face of risk can negatively impact the
VUC capacity, in which VUC personnel often do not consider the risk of failure or loss in VUC
capacity, so that many VUC programs do not work well. Likewise, the experience of cooperatives
show that increasing experience does not guarantee VUC that being concerned will be more active
to increase the capacity of VUC.
From field observation showed that the VUC capacity as farmers' economic organization which
was based on togetherness and kinship had not been consistent and consistently refer to a common
interest in building a more advanced farming. Understanding the principles of cooperation has not
been interpreted correctly by VUC personnel so that the participation of members did not grow
optimally. VUC program planning had not been implemented in a democratic, much influenced by
various interests to take advantage of VUC. VUC performance was not always in line with the
VUC capacity in which the role of the VUC personnel characteristics and VUC organizational
communication processes very influential. To increase participation of VUC personnel in VUC
capacity improvement required pattern of non-formal education to raise awareness of cooperation
and the acceleration of adoption of agricultural technology innovation with the support of dynamic process
of effective communication and efficient organization. Non-formal education programs and extension
activities to enhance the capacity of cooperation in the Karawang District hasn’t gotten the target.
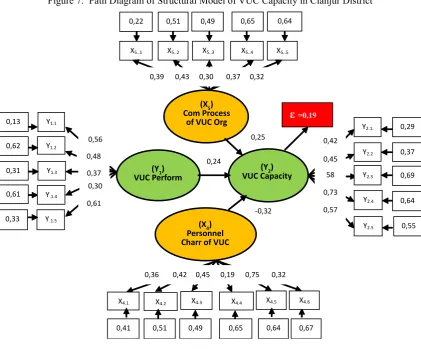
Figure 7: Path Diagram of Structural Model of VUC Capacity in Cianjur District
Description:
Variable X: X4.1 = age; X4.2 = education; X4.3 = non-formal education; X4.4 = cooperative experience;
X4.5 = courage to face risk; X4.6 = cosmopolite level
X5.1 = communication flowed; X5.2 = feed back; X5.3 = communication channel; X5.4= communication effectiveness;
X5.5 = communication utilization.
Variable Y: Y1.1 = leadership; Y1.2= supervisory role; Y1.3= program implementer; Y1.4= tech application; Y1.5= RAT application Y2.1 = capital; Y2.2= marketing; Y2.3= input saprotan; Y2.4= human resouces; Y2.5= SHU
As shown in Figure 7 the VUC capacity of in Cianjur District was not much different from the
situation of VUC capacity in the Karawang District where the VUC capacity was directly affected
by VUC performance, VUC personnel characteristics and VUC organizational communication
processes with path coefficient (r) of their respective variables were 0.24, -0.32 and 0.25 with a
value of measurement error (error) of 0.19. Differences of VUC capacity conditions in the Karawang
District with the VUC capacity in Cianjur District, was located on the dominant characteristic
indicators of VUC personnel gave an effect to the level of capacity VUC, non-formal education with
factor coefficients value of 0.45 and the lowest contribution was the experience of cooperatives with a coefficient factor 0.19.
Feedback Indicators factors were the factors that dominate the influence of VUC organizational
communication processes. If these factors were associated with the level of VUC capacity gave a
negative impact on quality of VUC service in the sense of courage to take risks in the environment
may cause the failure of members to the VUC activities. This happens because every program with
help from various sources often mean that the risk of failure will not get the sanction from VUC
or other parties who provide facilities that require responsibility. This condition was getting worse
because of poor communication and lacked of effectiveness of feedback in VUC organizational
communication processes in Cianjur District.
Quality Improvement Model of VUC
From path diagram of services quality structural model of VUC in Karawang District at figure
8 showed that generally VUC’s services quality condition were still weak in Karawang District as
result of lower VUC’s performances and capacity in the utilization ofrice mills. Services quality of
VUC toward members in the utilization of rice mills in Kabupaten District is dominated by social
indicator influent, while other indicators evenly that are technical, economical, and time. Low of
communication process quality of VUC organization caused by indicator role such as low dynamics
of communication flow, lacked of feedback of information occurred between the sender and receiver,
the low quality of communication media, uneffective process of communication and VUC’s
organizational communication utilization by VUC personnel has not been optimal.
From field observation showed that VUC personnel as users of rice mills, there were several
factors to be considered when selecting VUC’s rice mills as there was a sense of belonging VUC,
a sense of confidence about the safety of storage of grain and rice in VUC’s storage and utilization
product of rice milling process such as husk and bran can be used freely by VUC manager. With
the understanding that the necessary attention from various parties in communication with VUC
personnel to consider seriously the factors associated with the principle of cooperation in developing
VUC.
Detail of Figure 8 showed that the level of service quality of VUC in the Karawang District
directly influenced by the capacity of VUC, VUC personnel characteristics and VUC organizational communication processes with path coefficient (r) of each was 0.31, 0.21 and 0 , 29 with the value
of measurement error (error) on VUC service quality level of 0.19. The level of VUC’s service
quality in the VUC development in the Karawang District was low and if linked to organizational
communication model shows that the economic factor with a coefficient factor of 0.59 was the
Figure 8: Path Diagram of Service Quality Structural Model of VUC in Karawang District
.
Description:
Variable X: X4.1 = age; X4.2 = education; X4.3 = non-formal education; X4.4 = cooperative experience;
X4.5 = courage to face risk; X4.6 = cosmopolite level
X5.1 = communication flow; X5.2 = feedback; X5.3 = communication channels; X5.4= communication effectiveness;
X5.5 = communication utilization.
Variable Y: Y2.1 = capital; Y2.2= marketing; Y2.3= input saprotan; Y2.4= human source quality; Y2.5= SHU
Y3.1 = technique aspect; Y3.2= economic aspect; Y3.3= social aspect; Y3.4= time aspect
Just as in the Karawang District had seen also in Cianjur District, as showed in Figure 9 that the
level of VUC service quality is directly affected by VUC capacity, VUC personnel characteristics
and VUC organizational communication processes with path coefficient (r) of each was 0.28 , 0.27
and 0.24. This condition means that the factor of VUC organizational communication processes
dominating influence on the level of VUC service quality. This was different from the VUC personnel characteristic influence on the VUC capacity where a negative effect on the capacity of the VUC. If
the note contained the value of measurement error (error) at the level of VUC service quality of 0.21
which means that there was other indicators that were not measurable affect the level of VUC service
quality VUC.
In more detail visible in Figure 9 that from the aspect of the dominant characteristics of VUC
personnel affect the quality of VUC service was the courage to face the risk factor with a coefficient of 0.75 and the lowest factor of influence was the experience of cooperatives with a coefficient factor
of 0.19. While the factor of VUC organizational communication processes dominant aspect affecting
the quality of VUC services was the feedback factor with a coefficient of 0.43 in terms of smoothness
of the communication process that occurs in the internal VUC largely determined by the feedback
between the sender and the recipient information.
Figure 9: Path Diagram of Quality Services Structural Model of VUC in Cianjur District
Description:
Variable X: X4.1 = age; X4.2 = education; X4.3 = non-formal education; X4.4 = cooperative experience;
X4.5 = courage to face risk; X4.6 = cosmopolite level
X5.1 = communication flow; X5.2 = feedback; X5.3 = communication channels; X5.4= communication effectiveness;
X5.5 = communication utilization.
Variable Y: Y2.1 = capital; Y2.2= marketing; Y2.3= input saprotan; Y2.4= human source quality; Y2.5= SHU
Y3.1 = technique aspect; Y3.2= economic aspect; Y3.3= social aspect; Y3.4= time aspect
If compared to VUC service quality indicators in Cianjur District to Karawang District had seen
that there were different dominant factors that influenced the social aspects with a coefficient factor of 0.57 in the Karawang District and economic aspects with a coefficient factor of 0.62 in Cianjur District. Aspects of time occupy the lowest effect with a coefficient of each factor in the Karawang District and Cianjur District of 0.34 and 0.35. From the results of path coefficient analysis in both
the diagram and in the Karawang District of Cianjur District indicate that there was a similarity of
descriptive analysis carried out previously.
When investigated more in depth shown that the level of VUC service quality in the Karawang
District and Cianjur District was the dominant factor influencing the difference in the Karawang
District influence the social aspect was more dominant, while in Cianjur District dominant influence
over the economic aspects. This condition occurs due to environmental factors where the factor of
unity in the Karawang District higher due to the centralized settlement patterns in rural areas which
provide opportunities to communicate between the members of VUC personnel more intensive and
open. Meanwhile, in Cianjur District seen that the pattern of rural settlement was dispersed so that
the relatively more limited opportunities to communicate. From the observations made in Karawang
and Cianjur District increasingly believed that consideration of the potentials and local characteristics
was crucial in building a cooperative of farmers and farm more modern.
Services Quality Improvement Strategy of VUC
To get a strategy in improving the quality of VUC services as one of the major role of VUC
in accordance with the framework of thought in this study conducted an analysis of various
relevant variables in it namely: VUC organizational service quality, VUC capacity, VUC personnel
characteristics, and the communication process of VUC organization.
VUC Capacity
Some aspects of the VUC capacity who had influence in the quality of VUC services in the
Karawang District were (1) Aspects of the quality of human resources and (2) Aspects of the SHU,
while in Cianjur District were (1) Aspect of capital and (2) Saprotan input aspect. How big was
the correlation between aspects of VUC capacity and VUC services delivery could be seen in the
correlation matrix of VUC capacity with VUC organizations quality services in Karawang and
Cianjur District in Table 2.
Conditions in the Karawang District showed by value correlation matrix of VUC capacity with
VUC quality services in which the relationship between capital with technical aspects of service
utilization of rice mills had a real positive relationship (p <0.05). Similarly, the relationship between
the marketing of products had a positive association significantly (p <0.05) with the technical
aspects. Meanwhile, the analysis results of research conducted in Cianjur District showed that the
quality of human resources gives a real positive relationship (p <0.05) on the technical aspects of the
utilization of rice milling services for members of VUC. With increased capital, product marketing,
input of saprotan, quality human resources and SHU acquisition of VUC in the Karawang District
Table 2: Correlation Matrix of Organization Capacity to Services Quality of VUC Sample in Karawang and Cianjur District
Capacity Aspects of VUC.
Services Quality Aspects of VUC (rs)
Y 3.1 Y 3.2 Y 3.3 Y 3.4
Karawang District
Y 2.1 0,195* 0,067 0,155 0,071
Y 2.2 0,204* 0,062 0,158 0,237**
Y 2.3 0,274** 0,154 0,182* 0,082
Y 2.4 0,256** 0,229 0,369 0,346*
Y 2.5 0,472* 0,377 0,459 0,305*
Cianjur District
Y 2.1 -0,060 0,013 0,097 0,345
Y 2.2 0,107 0,118 0,030 0,105
Y 2.3 0,080 0,136 0,115 0,295**
Y 2.4 0,175* 0,342** 0,103 0,212*
Y 2.5 0,153 -0,059 0,037 0,097
Description :
1) rs = rank Spearman correlation: *) significant at α0,05, **) very significant at α0,01
2) VUC service quality : Y3.1 (technical aspect), Y3.2 (economical aspect),
Y3.3 (social aspect), Y3.4 (time aspect)
3) VUC capacity: Y2.1 (capital), Y2.2 (marketing), Y 2.3 (input saprotan), Y2.4 (human resource quality) and
Y2.5 (SHU)
In accordance with one of the major role of VUC was to provide service to members and the
main activity in VUC example was the utilization of rice milling, hence increasing role of VUC
as an economic organization of farmers in the countryside was largely determined by the level of
service provided to members of VUC. Based on the activities conducted at locations rice mill which
was a central meeting between the production, post harvest, processing and marketing of paddy/rice
that were important in the supply chain of rice and rice in the provision of national contributions to
support national food security.
In line with the opinions of Sinaga et al. (2008) that the role of Small and Medium Enterprises
and Cooperation in improving people’s economy in the real sector was a reality in national economic
activity were very important and strategic, to enhance the role and function of VUC need to consider
the suitability of the potential of natural resources, human resources potential, market opportunities,
sufficient capital support, utilization of information technology resources and support coordination
among government institutions. In relation to VUC service quality improvement in the Karawang
District and Cianjur District then to push forward the role of VUC should seriously consider the
technical aspects, economic, social and time in optimizing the potential of existing resources in the
area. Problems of production lost in rice processing on postharvest activity was still high and the
added value obtained by the farmers was still low competitive yet fair to develop into the rice mill or
global free trade.
Personnel Characteristic of VUC
Some aspects of the characteristics of VUC personnel who had influence on the quality of VUC
services in the Karawang District were (1) Aspects of courage to face risk and (2) Aspects of the
(2) Aspects of non-formal education. How big was the correlation between aspects of VUC personnel
characteristics with VUC service quality characteristics could be seen in the correlation matrix of
VUC personnel with VUC quality services Karawang and Cianjur District in Table 3.
Based on the interpretation of Spearman rank analysis showed that there was a relationship
between VUC personnel characteristic with quality of VUC services, which showed that conditions
in the Karawang District there was a real positive relationship (p <0.05) between aspects of the
formal education of VUC personnel characteristics toward capital aspect. Similarly, the relationship
between the courage to face risks with capital have a positive relationship significantly (p <0.05).
Meanwhile, the analysis results of research conducted in Cianjur District showed that the courage to
face a real risk of having a positive relationship (p <0.05) with saprotan input in the development of
rice farming members of VUC.
Table 3 : Correlation matrix of VUC Sample Personnel to Services Quality of VUC in Karawang and Cianjur District
Indicator of Variables X4.
Indicator of Variables Y3 (rs)
Y 3.1 Y 3.2 Y 3.3 Y 3.4
Karawang District
X 4.1 0,443 0,257* 0,305 0,299
X 4.2 0,237* -0,048 0,144 0,228
X 4.3 0,111 -0,023 0,110 0,112
X 4.4 0,443 0,257 0,305 0,299
X 4.5 0,237** -0,048 0,144 0,228
X 4.6 0,111 -0,023 0,110 0,112
Cianjur District
X 4.1 0,029 0,179 -0,083 0,062
X 4.2 -0,113 -0,062 0,205* 0,097
X 4.3 -0,038 0,129 0,061 0,075
X 4.4 0,039 0,184 -0,083 0,062
X 4.5 -0,103 -0,062 0,207* 0,097
X 4.6 -0,038 0,129 0,061 0,075
Description :
1) rs = rank Spearman correlation: *) significant at α0,05, **) very significant at α0,01
2) VUC quality service: Y3.1 (capital), Y3.2 (marketing),Y3.3 (input saprotan), Y3.4 (human resource quality)
3) VUC personnel characteristic: X 4.1 (age), X 4.2 (education), X4.3 (non-formal education), X4.4 (cooperative experience), X4.5 (courage to face risk) and X4.6 (cosmopolite level)
Communication Process of VUC Organization
Some aspects of VUC organizational communication highly correlated with quality of VUC
service in the Karawang District were (1) Aspects of communication effectiveness and (2) Aspects
of communication channels, while in Cianjur District were (1) Aspects of feedback and (2) Aspects
of communication flows. How big is the correlation between aspects of VUC performance with VUC
capacity could be seen in the correlation matrix of VUC personnel characteristics with VUC capacity
in Karawang and Cianjur District in Table 4.
From the results of Spearman rank analysis of meaning showed that there was a relationship of
organization communication process with VUC services quality which was determined by several
effectiveness and utilization of information communication. This condition was shown the correlation
process of VUC organizational communication with VUC quality services, in which the relationship
between feedback with aspects of tennis had a real positive relationship (p <0.05) in the Karawang
District. Similarly, the relationship between VUC organizational communication effectiveness had
very significantly positive relationship (p <0.01) with the technical aspects. By increasing the flow of
communication, feedback, communication channels, communication effectiveness and utilization of
information communication would improve the quality of VUC service in the Karawang District.
Table 4 : Correlation Matrix of VUC Organization Communication Process to VUC’s Services Quality in Karawang and Cianjur District
Indicator of Variables X5.
Indicator of Variables Y3 (rs)
Y 3.1 Y 3.2 Y 3.3 Y 3.4
Karawang District
X 5.1 0,089 0,111 0,094 0,155
X 5.2 0,069 0,069 -0,010 0,254**
X 5.3 0,228** 0,221** 0,284 0,119
X 5.4 0,170* 0,148* 0,214** 0,050
X 5.5 0,151 0,225** 0,103 0,127
Cianjur District
X 5.1 0,082 0,247** 0,118 0,158
X 5.2 -0,123 0,230** 0,024 0,054
X 5.3 -0,145 -0,062 0,082 0,119
X 5.4 0,104 0,172* 0,133 0,185*
X 5.5 0,127 0,223** 0,102 0,122
Description :
1) rs = rank Spearman Correlation: *) significant at α0,05, **) very significant at α0,01
2) VUC service quality: Y3.1 (technical aspect), Y3.2 (economical aspect), Y3.3 (social aspect), Y3.4 (time aspect)
3) Organizational communication process of VUC: X5.1 (communication flow), X5.2 (feedback), X5.3 (communication channel), X5.4 (communication effectiveness) and X5.5 (information communication)
Results of analysis of research conducted in Cianjur District showed that levels of communication
channels showed highly significant positive relationship (p <0.01) with the technical aspects. Similarly, also links the use of information had a positive influence significantly (p<0.01) with economic
aspects in an effort to improve the quality of service cooperatives. To increase services to members
of cooperatives in relation to the role of agricultural mechanization, particularly in the use of very
large machinery selectively increased the efficiency and effectiveness in production, in both the pre
and post harvest activitied regarding aspel in technical, economic and social. VUC organization’s
communication role in developing services to members of the VUC organization’s communication
process to increase the feedback and communication effectiveness was very important. Professional
agricultural cooperation development paradigm with the level of the communication process with
the dynamic organization of agribusiness and agricultural mechanization approach by utilizing
agricultural information through a model of effective organizational communication of VUC became
Based on the analysis of Spearman rank correlation coefficient between performance to VUC
capacity sample in Karawang and Cianjur District, as showed in Table 5 that there was a positive
relationship and statistically significant with each value t = 2.61 and t = 2.21 or more greater than the value ttable (1.96) (α = 0.05). Similarly, between the VUC capacity and VUC organization services
quality sample in Karawang and Cianjur Districts showd that there was a positive relationship and
statistically significant with each value t = 2.31 and t = 2.10 or greater than the value table (1,96) (α = 0.05). From the results of hypothesis testing meaningful hypotheses first and second hypothesis was
accepted.
Table 5: Correlation Work Coefficients to VUC Capacity and Services Quality of VUC Samples
in Karawang and Cianjur District
Variables t-value (α=0,05)t-table Conclusions
Karawang District
VUC performance(Y1) with VUC capacity (Y2 ) 2,61 1,96 Significant /
positive influent
VUC capacity (Y2) with services quality of VUC (Y3) 2,31 1,96 Significant /
positive influent
Cianjur District
VUC performance(Y1) with VUC capacity (Y2 ) 2,21 1,96 Significant /
positive influent
VUC capacity (Y2) with services quality of VUC (Y3) 2,10 1,96 Significant /
positive influent
CONCLUSIONS
1. The main factors which obviously affects the performance of VUC were (a) Information quality
factors, especially aspects of the relevance of information that often did not match the needs
of VUC personnel and aspects of timeliness of the information was very low and not available
when required by VUC personnel, (b) Organizational communication climate factor that was not
conducive particularly weak aspect of trust and lack of members support to VUC and (c) Factor
intensity level of public communication VUC organization that was still low, especially the role
of the private sector is still very weak relating to the VUC work program.
2. The main factors which influence the level of VUC capacity VUC were (a) Low of VUC
performance factors, especially aspects of the application of agricultural technology in increasing
the efficiency and effectiveness of rice farming and the implementation of the RAT as a
communication forum members in making decisions based on the farming interests of members,
(b) Factors characteristic of a weak VUC personnel, especially non-formal education aspect in
applying the principles of cooperatives as well as analysis of risks and responsibilities in the
development of rice farming modernity VUC members and (c) Had not been effective factor
VUC organizational communication processes, especially aspects of feedback information from
3. By considering the level of performance and capacity of VUC in the Karawang District and
Cianjur Districts as a whole was in a weak condition, this had resulted in low of VUC quality
services in the utilization of VUC rice milling. Utilization of VUC rice mill in the Karawang
District strongly influenced by social aspects, especially about the benefits of comfort and security while in Cianjur District was strongly influenced by economic aspects, especially concerning the benefits of the added value obtained by members of VUC. Social aspects in the Karawang
District and economical aspects in Cianjur District could become a strategic consideration in the
development of the utilization of rice mills as VUC business unit in order to develop agricultural
mechanization in this region.
Recommendations
1. To enhance the role and functions of agricultural cooperation with the performance, capacity and
VUC service quality required an increasingly professional training and development concept VUC
by applying two-way communication and convergent with the support of the development model
of cooperative organizational communication. In the development of cooperation organizational
communication model for considering the factors that affected it dominant namely (a) The
completeness of the information relevant to the needs of farmers in building a more modern
farming work, (b) Supporting and confidence of the VUC, (c) The characteristics of members
who increasingly understand cooperative principles and organizational communication process
more interactive and convergent in the efforts to accelerate adoption of appropriate agricultural
technology innovation through cooperatives in the countryside.
2. To build a professional cooperative of farmers and more modern farming needed support and
commitment from governments, employers and farmers as a dynamic movement in anticipation
of free trade which weakens the position of cooperatives and farmers. The eight factors or
elements which consist of: VUC performance, VUC capacity, quality of cooperation services, the
organization’s information quality of VUC organizational communication climate, the intensity of
public communication of VUC organization, personnel characteristics of VUC organization and
communication processes were aspects that play an important role as a viable model developed
in the Districts of Karawang and Cianjur.
3. The difference of the influence of the indicators contained in each element in organizational
communication model VUC between Karawang and Cianjur District, to development more
broadly to other areas couldnot be uniformity. Needed to first be tested in several areas of
agribusiness development similar commodities by taking into account local characteristics for
the results of this study could be optimally efficient for farmers in various production centers
REFERENCES
Adjid DA. 2001. Building a Modern Agriculture. Ray Farmer Development. Jakarta.
Handaka. 1996. Development of Agricultural Tools and Machines in Indonesia. Proceedings of the
National Seminar on Agricultural Techniques for Stimulating Contribution to Industrial
Development in an Era of Globalization. Jakarta.
Kusnendi. 2008. Structural Equation Models; One and Multigroup Samples with LISREL. Alfabeta.
Bandung.
AT Mosher. 1970. Getting Agriculture Moving. Frederick A. Praeger, Inc.. Publisher. New York.
Sinaga P. Aedah S, Subiyantoko A., 2008. Cooperative Research in the Spotlight. Rajagrafindo
Persada. Jakarta.
Sugiyono 2010. Statistics for Research. Alfabeta. Bandung
Sumardjo. 1999. Transformation of Agricultural Extension Model Development Towards Independence Farmers [dissertation]. Graduate School, Bogor Agricultural University. Bogor.
Tamba M. 2007. Information Needs of Agriculture and Accessible For Vegetable Farmers: Agricultural Information Provision Model Development in Farmer Empowerment, The Case of West Java province [dissertation]. Graduate School, Bogor Agricultural University. Bogor.
T. Tambunan 2006. Review Role of Cooperation in Support of Food Security. Infokop No. 28 of
XXII, 2006. Jakarta.
Wijanto SH. 2008. Structural Equation Modeling with LISREL 8.8. Concepts and Tutorials. Graha