299
MARKET STRUCTURE, CONDUCT AND PERFORMANCE:
EVIDENCE FROM INDONESIA BANKING INDUSTRY
Rizky Yudaruddin [email protected]
Fakultas Ekonomi Universitas Mulawarman
ABSTRAK
Kebijakan Arsitektur Perbankan Indonesia (API) sejak tahun 2004 telah berdampak pada meningkatnya konsentrasi bank. Peningkatan konsentrasi bank menimbulkan dua hipotesis yang berlawanan yaitu structure-conduct-performance (SCP) hypothesis dan efficiency hypothesis. Structure Performance Hypothesis di dasarkan pada pendekatan struktural. Pendekatan ini menilai bahwa tingkat profit yang diperoleh bank dipengaruhi oleh struktur pasar dan tingkat kompetisinya. Penurunan tingkat kompetisi dan peningkatan konsenterasi dalam suatu industri akan menyebabkan meningkatnya keuntungan yang diperoleh industri tersebut. Hal ini karena struktur pasar yang terkonsenterasi cenderung menimbulkan perilaku kolusif untuk tujuan memaksimumkan profit. Penelitian ini bertujuan untuk membuktikan, apakah perbankan di Indonesia tahun 2009-2013 mendukung structure-conduct-performance hypothesis atau efficiency hypothesis? Metode pengambilan sampel yang digunakan adalah purposive sampling. Menggunakan data laporan keuangan bank yang bersumber dari Bank Indonesia yang dianalisis dengan regresi data panel dengan bantuan program e-views 8 menemukan bahwa perbankan di Indonesia mendukung efficiency hypothesis. Namun efisiensi bank belum mampu mendorong tercipta praktek bunga rendah sehingga dapat menurunkan daya saing perekonomian Indonesia dalam menghadapi Masyarakat Ekonomi ASEAN (MEA) Tahun 2015.
Kata kunci: arsitektur perbankan Indonesia, hipotesis struktur-perilaku-kinerja, hipotesis efisiensi
ABSTRACT
Indonesian Banking Architecture Policies (API) since 2004 has resulted in the rising of banks concentration. This increase of banks concentration raises two opposing hypotheses, structure-conduct-performance (SCP) and efficient-structure-conduct-performance hypothesis. SCP approach is a structural approach. This approach considers that the level of profits which the bank acquired is affected by the market structure and the degree of competition. The decreasing level of competition and the increasing in concentration in an industry will lead to increased profits for these industries. This study aims to prove, whether banks in Indonesia in 2009-2013 support structure-conduct-performance or efficient-performance hypotheses. The sampling method used was purposive sampling. Using banks’ financial statement data sourced from Bank Indonesia, which then analyzed with panel data regression in e-views 8 program. It’s found that banks in Indonesia support the efficient hypothesis. However, the banks efficiency has yet encourage low interest practice and thus reducing the competitiveness of the Indonesian economy in the face of ASEAN Community 2015.
Key words: Indonesian banking architecture, structure-conduct-performance hypothesis, and efficiency hypothesis
INTRODUCTION
Since 1997 monetary crisis, Indonesia has revamped itself including its banking indus-try. This is because the banking industry is one of the parts affected by the crisis marked by numerous banks collapsed. This
basic framework for the Indonesian banking system, outlining the direction, outline, and structure of the banking industry for the next five to ten years. Therefore, the whole policy held by banks in Indonesia must comply with the policy direction API. Base on API, banking Police must be conected with the vision of building a sound, strong, and efficient banking industry in order to create financial system stability for promotion of national economic growth.
The Indonesian Banking Architecture is the basic policy framework of the Indonesian banking policy formulation in accordance with Presidential Instruction Number 5 Year 2003. Mulyaningsih and Daly (2011) revea-led that API has affected the structure and level of banking competition in Indonesia directly through two Bank Indonesia’s policies, the minimum amount of capital and the single ownership policy. This policy led to the increased of bank economics scale and that major banks have monopolists market power and the market become less compe-titive. This means that API policies has impact on increased of bank concentration level and decreasing bank competition level according to Structure, Conduct, and Per-formance (SCP) approach. But Hall and Simper (2013) find that the Korean banking perfect competition. These conditions favor banks merger to improve the efficiency of banking, although the policy of mergers create instability in the banking industry.
The concentration ratio of Indonesian banking market structure tends to form oligopoly and even though there’s a relative-ly large number of a bank, about 50 percent market share held only by four banks. These four banks which have dominant position, potentially cooperate to determine the price that tends to harm consumers, such as the establishment of a very wide spread interest. The high concentration of the banking mar-ket will distort credit marmar-kets, causing credit allocation to be inefficient and potentially creating unstable financial sector (Sanuri, 2011; Chortareas, 2010). SCP approach is a structural approach. This approach
consi-ders that the level of profits which the bank acquired is affected by the market structure and the degree of competition. The decrea-sing level of competition and the increadecrea-sing in concentration in an industry will lead to increased profits for these industries. This is because the structure of the market which gives rise to collusive behavior tends to be concentrated in order to maximize the profit goal.
Naylah (2010) found that the decreasing level of banking competition in Indonesia has resulted in bank activities become more freely in a collusive action, which increase profitability. The alleged collusive oligopoly in the banking industry in Indonesia is noticeable from the difficult lending rates and the market share held by a few large banks. In fact, this practice is considered commonplace. Chen and Liao (2011) found that foreign banks were more profitable than domestic banks when they operate in a host country whose banking sector is less compe-titive and when the parent bank in the home country is highly profitable.
On the other hand, the existence of collusive behavior by the banks does not only in Indonesia but also in China. Masood and Sergi (2011) show that using the Panzer-Rosse test, banking sector in China for 2004– 2007 was monopolistically competitive. They found reject the state of conjectural variation short-run oligopoly or natural monopoly in the Chinese banks for the specified time periode. The Chinese banks were not able to achieve high records of profitability in monopolistically competitive market. Al-thougth, they found a negative effect and insignificant relationship between concen-tration and competition.
The high Indonesian banks are considered as a strategy to multiply capital to compete. However, this method can also weaken the Indonesian banking competition due to interest held high.
However research by Sanuri (2011) shows different result, the rising market concentration increases unhealthy practices in gaining profit is not proven. The increased of banks profitability actually influenced from the increased efficiency that is done by the banking industry in Indonesia. Accord-ing to Bank Indonesia, the current interest rate is in accordance with the conditions of each bank and market conditions. The current interest rate has decreased although not significantly. Data from Bank Indonesia shows that banks average lending rates only fell by 3.33 percent in recent years. Average lending rates of the banking industry were 15.39 percent at the end of December 2008, fell to 13.24 percent in December 2010, and again fell to 12.06 percent at the end of 2012. So there is no cartel in the banking industry in Indonesia. The increase in bank profita-bility is due to the efficiency of the bank, not because of the collusive action through high interest rate loan.
In relation to efficiency, Günalp and Çelik (2006) found that there has been a decrease in the concentration ratio of the Turkish banking. This condition causes an increase in profits, but this does not indicate that the Turkish banking sector have high profitability but does not seem to be an indication of an increase in monopoly power. Hauner and Peiris (2008) found that increased competition will improve the efficiency of banks in Uganda. Moreover, on average, larger banks and foreign-owned banks are more efficient than others while smaller banks decreased efficiency due to competition between banks. The same thing also expressed by Al-Obaidan (2008) that the degree of concentration is not considered as anti-competitive actions, but should be considered as a consequence of the efficiency of the bank. However, the levels of efficiency of the banking industry in Indonesia are
among the lowest. One indicator of efficien-cy is the operating expenses per operating income ratio (OEOI). Although it showed a declining trend, but it’s still too high bet-ween 70-80 percent. As comparison with the banking industry in other ASEAN countries, their OEOI ratio was already in the range of 20-30%. That is, banks in Indonesia are still not efficient, which ultimately always contri-butes to the high interest rate.
Based on the current banking situation, this study aims to empirically demonstrate, whether the increase in concentration will increase collusive behavior which in turn increases the profitability of the bank, or on the contrary, the increasing of banks profita-bility is due to efficiencies made by the bank? So this research will try to proof two hypo-thesis that whether the banking industries in Indonesia support structure-performance hypothesis or efficient hypothesis?
This study gives two contributions: first, concentrationl levels and market share is not assessed partially based on only the third party funds (Samad: 2008; Naylah: 2010; Bhatti and Hussain: 2010; and Amalisa and Nasution: 2007) but also total assets to gain impact overall. Secondly, it involves variable efficiency (Abbasogluet al.,: 2007; Mensi and Zouari: 2010; Rettab,et al,.2010; and Sanuri: 2011), which not only do not just use the OEOI (ratio that measures the bank efficien-cy of operating expenses to revenue opera-tions) but also processed by the DEA method (Data Envelopment Analysis). Third, the authors also do simulation separately for verification Structure and Efficiency Per-formance Hypothesis hypothesis and simu-lation models combined.
THEORETICAL REVIEWS Structure Performance Hypothesis
will lead to increased profits of that industry. This is because the concentrated market structure tends to lead to collusive behavior for the purpose of maximizing profits.
Samad (2008) explain that collusive behavior increases as market share is concentrated in the hands of a few firms. The higher the concentration ratio in a market, the higher the profitability performance of the firms. Thus, according to the SCP hypothesis, there is a positive correlation between the degree of market share concen-tration and the firm’s performance. Due to collusive or monopolistic reasons, ‘‘firms in a concentrated market will earn higher profits than firms operating in a less concentrated one, irrespective of efficiency’’. This hypothesis could be supported if the impact of market concentration was found to be significantly positive, irrespective of the efficiency of the firm.
Amalisa and Nasution (2007) reveal three related ideas related with level of concentration and market share, first is calledTraditional Hypothesis. This idea consi-ders levels of concentration as proxy of Market share. The increasing Market concen-tration causes cheaper collusion cost so companies get supernormal profit. In short, increasing Market concentration will increa-se profit. Second isDifferentiation Hypothesis. This idea assumes Market share as proxy resulting from product differentiation. By doing products differentiation will lead to the increase of market share and in turn will be followed by doing another product differentiation and so on, until companies can set a higher price. High profit is possible not only because of low cost but also because of high price and increased market share will also increase profitability.
Third isEfficient Structure. This thinking assumes the level of concentration and market share not as a proxy for bigger market power but the efficiency of the company. Efficient firms will gain greater market share and market structure will be concentrated (not synonymous with collusi-on) so as to increase profits. So the increase
in profit is due to the efficiency of the company.
Rinkevičiūtė and Martinkutė-kaulien (2014) found that concentration does not have a significant impact on profitability has been reached considering the fact that fluctuations in concentration were quite different from those of profitability in 2007– 201. Profitability and concentration, howe-ver, are linked by more significant relation comparing with profitability influenced by other changes in industry and therefore fluctuating more dramatically in Lithuanian banking sector.
Ajide and Ajileye (2015) show that the research results rejected the market power hypothesis (collusion hypothesis) which states that as market concentration increases bank profitability would as well increase. This results contradict our expectations of increased market power that could have possibly come from the banks’ collusion and a corresponding increase in the level of concentration which could, in turn; increase bank profitability.
Ye, et al. (2012) found that neither the structure-conduct-performance (SCP) nor the efficient structure (ES) hypotheses hold in China, and this accords with the results of previous studies of the banking sectors in developing and transition economies. There is some support for the ‘quiet life’ hypothesis that suggests a lack of a relationship between Market structure and bank performance. But the strongest support is for the relative Market power (RMP) hypothesis that sug-gests that firms with differentiated services and products are those with higher market share, and that they are able exercise their. Meanwhile, Hoxha (2013) documented that supports the view that market power is good for the access to financing and that banking competition is harmful to the output of the Industries dependent on external financing.
indicated by the extra-ordinary high degree of concentration.
Some research shows an increased level of concentration can decrease competition and increase profitability. Sathye (2005) found that merger policies of four major banks in Australia led to a decrease in competition of Australian banking system, and that caused banks unable to be efficient. Naylah (2010), and Hussain Bhatti (2010), and Gajurel and Pradhan (2011) found that an increase market concentration decreased competition and increase profits. But Majid and Sufian (2006) find that changes in the structure of the banking market in malaysia does not result in increased competition that required further consolidation to increase competition between banks.
Efficiency Hypothesis
Banking efficiency has an important role for the banking industry. For that there are some things that must be considered related to bank efficiency, especially for transition countries. First, the bank's management must consider the cost of efficiency with more focus on the organization and structure of the banking services provided. Second, banks should be cautious in adopting a strategy when there is economic growth with no menampkan procyslical behavior. Third, commercial banks should focus on bank intermediation function. Fourth, policy makers should increase regional cooperation to reduce the impact of the financial crisis and prepare measures counter-cyclical (Spulbăra and Niţoia: 2014).
Efficiency is defined as the ratio between output to the input, or the amount generated from the input used. Conceptually, there are two general methodologies to measure frontier efficiency; the parametric approach using econometric techniques, and the non-parametric approach utilising the linear programming method. To measure efficien-cy, the DEA (Data Envelopment Analysis) will be this study choice because it does not require us to specify the functional form or distributional forms for errors. In essence, it
is more flexible than the parametric approach. DEA was designed to measure the relative efficiency where market prices are not available (Zhu, 2014).
Technical efficiency is described as the company's ability to produce output with a number available output. While allocative efficiency is the ability of the company to optimizing inputs with the pricing structure and production technology. If the two are combined, the efficiency will be economic efficiency.
Zhu (2014) expalins that the next step is to estimate the empirical (piecewise linear) efficient frontier characterized by DEA. DEA uses mathematical programming to implicit-ly estimate the tradeoffs inherent in the empirical efficient Frontier The DEA has been widely used to estimate efficiency in banking. The DEA frontier is formed by “bestpractice observations” yielding a convex production possibility set. The most commonly used DEA approach for measur-ing technical efficiency in bankmeasur-ing is the input-oriented Variable Returns to Scale (VRS) model.
Two alternative approaches are availa-ble in DEA to determine the efficient frontier characterized by DEA. One is input-orient-ed, and the other output-oriented. In order to make a detailed analysis of inefficient units and take corrective actions to improve their performance, this paper considers both the CRS assumption and the VRS assumption in estimating the efficiency indices as discussed below.
Min 0
input andrthoutput, respectively for DMU f . N is the number of DMUs. ε is a very small positive number (non-Archimedean) used as a lower bound to inputs and outputs. λf
denotes the contribution of DMU f in deriving the efficiency of the rated DMU
f
o(a point at the envelopment surface). Si and
r
S
are slack variables proxying extra savings in inputiand extra gains in outputr.lois the radial efficiency factor that shows the possible reduction of inputs for DMU
f
o. If* o
l (optimal solution) is equal to one and the slack values are both equal to zero, then DMU
f
o is said to be efficient. When
improve further once input levels have been contracted to the proportion *
o
l .
If a convexity constraint is incorporated in model (1), the following VRS version of the DEA model can be written as follows:
Min that it includes the so-called convexity
constraint,
interpolation point constructed from the observed DMUs from being scaled up or down to form a referent point which is not permissible under the VRS. In this model, the set of
λ
values minimisel
o to* o
l and identify a point within the VRS model whose input levels reflect the lowest proportion of
* o
l . At * o
l , the input levels of DMU
f
o can beuniformly contracted without detriment to its output levels. Therefore, DMU
f
o hasefficiency equal to * o
l . The solution to model (2) is summarized in the following fashion: DMU
f
o is pareto-efficient ifLoukoianova (2008) found that Japanese bank profitability is low compared to that in other advanced countries, there is conside-rable potential for efficiency gains, parti-cularly through increased cost sharing arrangements among regional banks, consolidation of regional banks with major or other regional banks, and the creation of bank consortia to pool resources for asset and risk management.
A few studies had been conducted to investigate the impact of bank competition, efficiency and performance. The issues addressed were centred on whether deregu-lation had increased competition, improved efficiency and performance. Improved efficiency will improve the performance of the company. Mokhtar, et al. (2008) documented that the efficiency level of Islamic banking was still less efficient than the conventional banks. Islamic banks in Malaysia are now facing ever-increasing competition, particulary with the issuance of three new licenses to three foreign full-fledged Islamic banks.
On the other hand, Masood and Sergi (2011) Chinese banks more competitive markets are also more efficient and increa-sing the concentration ratio actually reduce competition. The same is also disclosed by Al-Obaidan (2008) that the concentration level was not assessed as anti-competition action, but should be considered as a consequence of the efficiency of the bank. Other research by Fatheldin (2005), Abbasogluet al. (2007), Samad (2008), Mensi and Zouari (2010), Rettab, et al. (2010), and Sanuri (2011) found that the increase of profit occurs because of the bank efficiency.
Tajgardoon et al. (2012) found that countries in our sample show that technical and scale efficiency have the positive and significant effect on profitability but, concen-tration variable decreases profitability. This result is the same as for separated regression on countries, except for Saudi Arabia that technical efficiency is negative and for Qatar and UAE that market power is dominant.
Control Variabels
There are several control variables that affect the profitability such as the ratio of loans to total deposits, Total Asset, Deposit Growth, Credit Risk, Operating Cost and Inflation.
Samad (2008) found the signs for the coefficient of loans to deposit ratio and assets are consistent with the expectation of model and are statistically significant. This suggests that bank performances are significantly dependent upon loans to deposit ratio and asset.
Tajgardoon et al. (2012) have show the result that liquidity risk that has a negative effect on profitability. As far as the other microeconomics' control variables is concer-ned, the ratio of loans to total assets always has the expected positive effect on profita-bility, and is the most important bank-specific factor. On the other hand, inflation have the negative and significant effect on profitability.
Naylah (2010) found Deposits, Total Asset, Deposit Growth variabels have the positive and insignificant effect on profita-bility. This is explain that Deposits, Total Asset, Deposit Growth variabels are not determinan variabel profitability.
Rettab et al.(2010), looking at the UAE effect, market structure, asset quality, and profitability were again found to be signifi-cant differentiating characteristics between UAE and non-UAE-GCC banks. When look-ing at the interaction effect, we find that only three ratios are significant: cost, profitability and liquidity.
Loans to total deposits exhibits negatif and significant effect when positive effects were expected. The high bad debts experience of the early 1990s, increased competition and squeezing of margin seem to be the reasons for such result. On the other hand, the variabel log asset is positive and statically significant. This indicating that size induced differnce between banks may lead to higher profit (Sathye: 2005).
and statistically significant except for the case of pooled OLS model in profitability equation, which suggests that size-induced differences between banks may lead to lower total revenue per unit of assets and that larger banks seem to be less efficient compa-red to smaller banks. This also suggests that as a whole the Islamic banking market in Malaysia faces diseconomies of scale.
Accroding to Amalisa and Nasution (2007), asset has a negative and significant impact on Islamic banks than conventional banks. For total operating expenses have been found results and significant negative impact on the conventional banks. Conventi-onal bank deposit growth impact on increas-ing profit..
Sanuri (2011) found that positive coeffi-cient on the variable inflation indicates that during this time Management banks have been able to anticipate their expectations of inflation in accordance with allocating resources or assets owned by the right and the determination of interest rates to increase profits
Chen and Liao (2011) found that liqui-dity ratios correlate significantly and positively with profitability, which indicates that an increase in bank liquidity ratio tends to enhance a bank’s profitability. Further-more, banks with better profitability are positively and significantly correlated to their opportunity cost. Fo inflation variabel have positif and significat impact on profita-biity bank. Another finding in this study is that operation income from non-interest operating will decrease income, and other operation activities will decrease, too.
Chortareas (2010) show that larger banks are more likely to operate at the most efficient scale. On the other hand, larger banks can typically pursue riskier invest-ments which yield higher returns. Finally the evidence for liquidity is weak and cannot be generalised for the Latin American countries under study. In particular the coefficient is found negative and significant only for Paraguay, remaining insignificant to the rest of the countries under study.
RESEARCH METHOD
The model in this study is adapted to the research by Samad (2008), Naylah (2010), Sanuri (2012), Bhatti and Hussain (2010), and Amalisa and Nasution (2007), Tajgardoonet al., (2012) in which Table 1 shows infor mation about detailed operational variables related to definition and proxies used in those variables so that a model can be arranged as follows:
πit= β1+ β2Cit+ β3MSit+ β3∑Zit
To determine whether the banking industry in Indonesia supports structure-performance hypothesis or efficiency hypo-thesis, can be determined as follows: Banks supports structure-performance hypothesis if the coefficient of the level of concentration and the coefficient of market share is, β2> 0; β3= 0. Banks supports efficiency hypothesis if the coefficient of the level of concentration and the coefficient of market share is, β2 = 0; β3 > 0 or β2 = 0; β3 = 0.
The control variables in this study use internal variables (from Banks) and external variables (inflation) with the model as follows:
Zit =β3EFit+ β4LDRit+ β5SIZEit+ β6GTPFit+ β7NPLit+ β8OCit+ β9INFit
Efficiency variable (EF) is used to provide confirmation as to whether the banking industry in Indonesia supports structure-performance hypothesis or effici-ency hypotheses. This is because the concentration variable (C) and market share (MS) are SCP variables, so that the main control variable is the efficiency variable.
There are two variables that serve as proxy to bank efficiency, they are bank's OEOI and Technical Efficiency using a non-parametric approach or DEA (Data Envelopment Analysis) (Cooperet al., 2006). So a research model can be arranged involving SCP variables and efficiency varia-bles either partially or combined. The goal is to determine the effect consistency of each independent variable.
Table 1
Operational Definition of Research Variables
Dependent Variable Description
Performance/ Profit (π)
ROAit The ratio of profit before tax to total assets of i bank in t month
Independent Variable Concentration
Levels (C)
CR5TPFit; CR5ASSETit
The concentration level of 5 major banks (Bank Mandiri, BCA, BRI, BNI and Danamon) i bank in t
month is calculated by the formula:
CRTPF= 100%
CRASSET= 100%
HHITPFit; HHIASSETit
Hirschman-Herfindahl Index (HHI) of i bank on t month is calculated by the formula:
HHI =∑ MSi where MS =Market Share Market Share
(MS)
MSTPFit; MSASSETit
Market Shareof i bank in t month is calculated by the formula:
MSTPF= x 100%;
MSASSET= x 100%
Deposit = Third Party Funds (TPF) Level of
Efficiency
EFOEOIit ; EFDEAit
The level of efficiency (1) EFOEOIis measured from the OEOI that is the ratio of operating expenses to operating income of i bank in t month t (2) EFDEAitis measured from the input and output processed by the DEA method (Data Envelopment Analysis) with the help of the program Banxia Frontier Analysis Software. Input consists of TPF, total assets and operating costs, while the output
consists of Credit, Operating Income of i bank i in t month.
Control Variable (Z) Level of
Liquidity
LDRit The ratio of loans to total Deposits of i bank in t month
Total Asset SIZEit Log Natura Total Asset of i bank i in t month Deposit Growth GTPFit Deposits of i bank in t month minus i bank deposits
in t montht-1) divided by i bank deposits in t month -1
Credit Risk NPLit Credit Risk divided by the total credit / financing of i bank in t month
Operating Cost OCit The operational costs of i banks in t month Inflation INFt The inflation rate in t month
β2- β9 Regression coefficient εit Residual Value (error)
Source: Adapted from Samad (2008), Naylah (2010), Sanuri (2012), Bhatti and Hussain (2010), Tajgardoonet al.,
The criteria used are bank with largest total assets and market share, and in total has more than 75 percent of total value, they are, PT Bank Mandiri Tbk., PT Bank Rakyat Indonesia Tbk., PT Bank Central Asia Tbk., PT Bank Negara Indonesia Tbk., PT Bank CIMB Niaga Tbk., PT Bank Danamon Indo-nesia Tbk., PT Bank Pan IndoIndo-nesia Tbk., PT Bank Permata Tbk., PT Bank Internasional Indonesia Tbk., State Savings Bank Tbk., PT Bank Arta Graha Internasional Tbk., Citibank NA, PT Bank Mega Tbk., The Hongkong and Shanghai Banking Corp., and PT Bank UOB Indonesia. This is because the collusion behavior is generally done by large corporation (Amalisa and Nasution, 2007). Moreover, Mlambo and Ncube (2014) found that the large banks in South Africa tend to avoid outright competition against each other because South African banking indus-try was characterized by monopolistic competetion.
The data used are secondary data in the form of banks financial statements ranging from January 2009 to December 2013, publi-shed on the website of Bank Indonesia (www.bi.go.id). While the macro-economic data used in this study is the monthly infla-tion data released by Indonesia’s Central Statistics Agency (BPS).
The analytical tool used in this study is panel data regression. Damodar and Dawn (2010) explains the data processing panel has there are 3 (three) approach, which can be used to estimate the panel data regression model, namely the Common Effect, Fixed Effect and Random Effect. To have all three models and best approach to be used, they can be tested. Three tests that are often used to determine the appropriate modeling approach are FTest (Significance test of the fixed effect), LM-Test (test of random effect significance) and Hausman test significance test of fixed or random effect).
RESULT AND DISCUSSION
In the middle of the slow global econo-mic recovery, banks are still able to run the intermediary function quite well, despite the
credit growth has slowed in the second half of 2012. The strategies of credit expansion oriented sectors of the Products, are accom-panied by an increase in efficiency and had a positive impact on the performance of banking profitability.
In terms of capital, banks are able to maintain capital levels well above the prescribed minimum capital with a stronger capital structure. Meanwhile, in terms of risk management, banks profitability had impro-ved, supported by improving credit risk management in the middle of the dynamics of the business environment and the macro economy as affected by the global economic crisis.
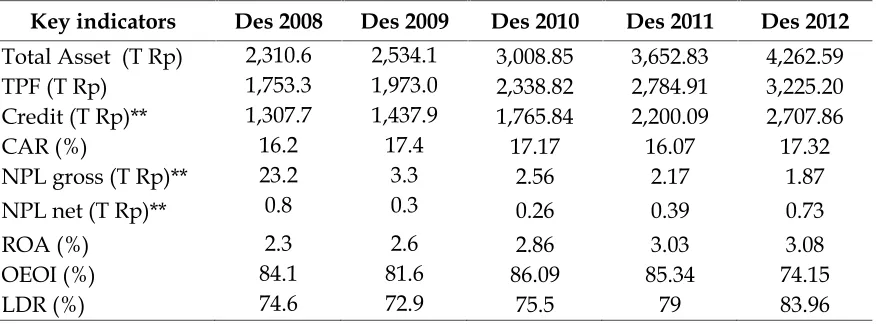
The performance of banks in Indonesia continues to increase. Judging from the main indicators of the bank's performance in the last five years of banking in Indonesia, particularly in the view of efficiency as measured from OEOI. OEOI increased from 84.1 percent in 2008 to 74.15 percent in 2012. Which are summarized in Table 2.
Before performing regression analysis of panel data it is necessary to test the data stationary. Stationary data testing is inten-ded to avoid the spurious regression. Unit root tests with panel shaped database are better than unit root test based on individual data (time series).
This research is using the Levin, Lin & Chu stationary method, with E-Views 8 application programs. The test results shows stationer output, with the stationer SIZE variable at the First Difference integration degree as seen in Table 3.
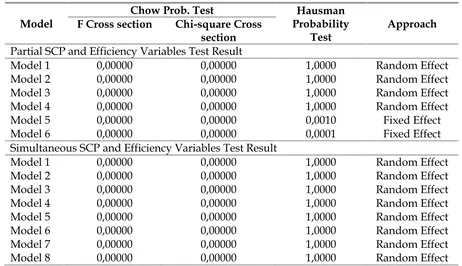
The FTest, LM-test and Hausman test results on the data showed that the proper approach to estimate the panel data regres-sion model is the Random Effects and Fixed effect on all models, which are summarized in Table 4.
Table 2
Key Indicators of Commercial Banks In Indonesia*
Key indicators Des 2008 Des 2009 Des 2010 Des 2011 Des 2012
Total Asset (T Rp) 2,310.6 2,534.1 3,008.85 3,652.83 4,262.59
TPF (T Rp) 1,753.3 1,973.0 2,338.82 2,784.91 3,225.20
Credit (T Rp)** 1,307.7 1,437.9 1,765.84 2,200.09 2,707.86
CAR (%) 16.2 17.4 17.17 16.07 17.32
NPL gross (T Rp)** 23.2 3.3 2.56 2.17 1.87
NPL net (T Rp)** 0.8 0.3 0.26 0.39 0.73
ROA (%) 2.3 2.6 2.86 3.03 3.08
OEOI (%) 84.1 81.6 86.09 85.34 74.15
LDR (%) 74.6 72.9 75.5 79 83.96
**Data includes Commercial Bank and Sharia bank *Without credit channeling
Source: Banking Supervision Report 2010 and 2012
Table 3
Stationer Test Result
Variables Integration Degree Levin, Lin and Chu
Statistic Prob.
ROA Level -5,29915 0,0000**
CR5TPF Level -4,07881 0,0000**
CR5ASSET Level -8,79141 0,0000**
HHITPF Level -4,00319 0,0000**
HHIASSET Level -5,73994 0,0000**
MSTPF Level -4,53809 0,0000**
MSASSET Level -6,28048 0,0000**
EFOEOI Level -12,3358 0,0000**
EFDEA Level -13,4044 0,0000**
LDR Level -7,14711 0,0000**
SIZE First Difference -30,4053 0,0000**
GTPF Level -27,9586 0,0000**
NPL Level -3,75626 0,0000**
OC Level -1,95796 0,0001**
INF Level -26,7426 0,0251*
Notes: ** Significant at α = 1%; *Significant at α = 10%
Source: E-View 8
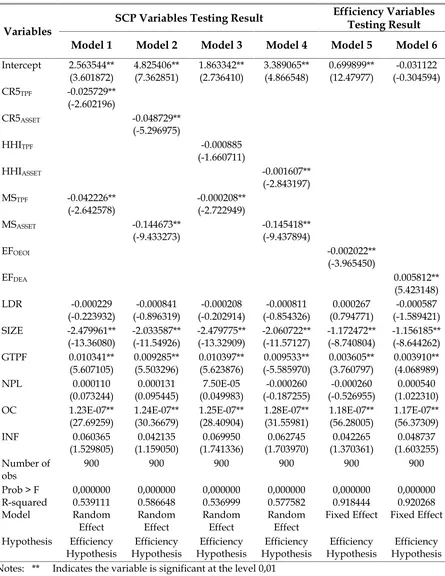
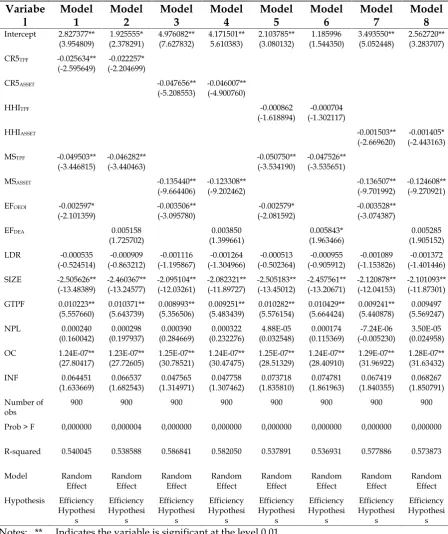
Efficiency variables as in model 5 and 6 shows significant effect to ROA. This nega-tive effect towards bank concentration has proof the efficiency hypothesis of Indonesian Banks. In table 6, as viewed from model 1-8 shows that the level of concentration, Market share, and efficiency combined shows the
same result, that Indonesian banks supports efficiency hypothesis.
Table 4
Chow and Hausman Test Result
Model
Chow Prob. Test Hausman
Probability Test
Approach F Cross section Chi-square Cross
section Partial SCP and Efficiency Variables Test Result
Model 1 0,00000 0,00000 1,0000 Random Effect
Model 2 0,00000 0,00000 1,0000 Random Effect
Model 3 0,00000 0,00000 1,0000 Random Effect
Model 4 0,00000 0,00000 1,0000 Random Effect
Model 5 0,00000 0,00000 0,0010 Fixed Effect
Model 6 0,00000 0,00000 0,0001 Fixed Effect
Simultaneous SCP and Efficiency Variables Test Result
Model 1 0,00000 0,00000 1,0000 Random Effect
Model 2 0,00000 0,00000 1,0000 Random Effect
Model 3 0,00000 0,00000 1,0000 Random Effect
Model 4 0,00000 0,00000 1,0000 Random Effect
Model 5 0,00000 0,00000 1,0000 Random Effect
Model 6 0,00000 0,00000 1,0000 Random Effect
Model 7 0,00000 0,00000 1,0000 Random Effect
Model 8 0,00000 0,00000 1,0000 Random Effect
Notes: Significant if p-value < 5%
Source: E-View 8
This is visible from the coefficient of concentration levels and market share that negatively affect performance. This finding supports research by Sathye and Sathye (2004), Fatheldin (2005), Abbasoglu et al.,
(2007), Samad (2008), Al-Obaidan (2008), Mensi and Zouari (2010), Rettab,et al.,(2010), Sanuri (2011), and Tajgardoon, et al., (2012) who found that the increase in profit occurs because the bank efficiency, not because of increasing concentration.
This means that API policies that affect the structure and the competition level of Indonesian banking that led to increased bank concentration has encourages banks to become more efficient. In addition, Bank Indonesia made policies to strengthen the banks’ structure by applying multiple licen-ses on November 2012. If a bank’s capital is small then its business activities will be limited because Bank Indonesia assesses that that bank will operate more efficiently with core capital of 5 trillion rupiah.
So there is some "forcing" to banks to do mergers or acquisitions in order to strengthen their structure, creating bank efficiency.
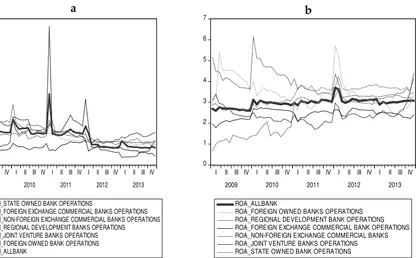
This result also confirmed by the analy-sis results on the efficiency variables that showed significant influence to performance (OEOI with significant negative effect and technical efficiency with significant positive effect) thus strengthening the result that efficiency improvements will improve the performance of the bank. In the last 5 years, banks in Indonesia continue to increase its efficiency. This condition is seen from the continued decline in OEOI of Indonesia’s banks within the years 2009-2013. However, not only the efficiency of banks that keep increasing, the banks’ performance mea-sured by ROA also increased as seen in figure 1 below:
Table 5
Partial SCP and Efficiency Variables Testing
Variables
SCP Variables Testing Result Efficiency Variables Testing Result
Model 1 Model 2 Model 3 Model 4 Model 5 Model 6
Intercept 2.563544**
900 900 900 900 900 900
Prob > F 0,000000 0,000000 0,000000 0,000000 0,000000 0,000000 R-squared 0.539111 0.586648 0.536999 0.577582 0.918444 0.920268
Model Random
Fixed Effect Fixed Effect Hypothesis Efficiency Notes: ** Indicates the variable is significant at the level 0,01
Table 6
Simultaneous SCP and Efficiency Variables Testing Variabe
900 900 900 900 900 900 900 900
Prob > F 0,000000 0,000004 0,000000 0,000000 0,000000 0,000000 0,000000 0,000000
R-squared 0.540045 0.538588 0.586841 0.582050 0.537891 0.536931 0.577886 0.573873
Model Random
Notes: ** Indicates the variable is significant at the level 0,01 * Indicates the variable is significant at the level 0,05
60 80 100 120 140 160 180
I II III IV I II III IV I II III IV I II III IV I II III IV
2009 2010 2011 2012 2013
OEOI_STATE OWNED BANK OPERATIONS
OEOI_FOREIGN EXCHANGE COMMERCIAL BANKS OPERATIONS OEOI_NON-FOREIGN EXCHANGE COMMERCIAL BANKS OPERATIONS OEOI_REGIONAL DEVELOPMENT BANKS OPERATIONS
OEOI_JOINT VENTURE BANKS OPERATIONS OEOI_FOREIGN OWNED BANK OPERATIONS OEOI_ALLBANK
0 1 2 3 4 5 6 7
I II III IV I II III IV I II III IV I II III IV I II III IV
2009 2010 2011 2012 2013
ROA_ALLBANK
ROA_FOREIGN OWNED BANKS OPERATIONS ROA_REGIONAL DEVELOPMENT BANK OPERATIONS ROA_FOREIGN EXCHANGE COMMERCIAL BANK OPERATIONS ROA_NON-FOREIGN EXCHANGE COMMERCIAL BANKS ROA_JOINT VENTURE BANKS OPERATIONS ROA_STATE OWNED BANK OPERATIONS
Source: Indonesia Banking Statistic from January 2009 to December 2013.
Figure 1
(a) OEOI level of all banks in Indonesia in January 2009 to December 2013; (b) ROA level of all banks in Indonesia in January 2009 to December 2013.
December 2013 with an average of 83,93 percent. Although in January 2010 there was a significant increase in OEOI due to an increase in OEOI of state-owned banks. Bank performance as measured by ROA increased from 2,69 percent in January 2009 to 3,08 percent in December 2013 with an average of 2,97 percent. Significant improvement occur-red in January 2011 at 3,70 percent due to the contribution of foreign banks’ performance, which reached 5,70 percent.
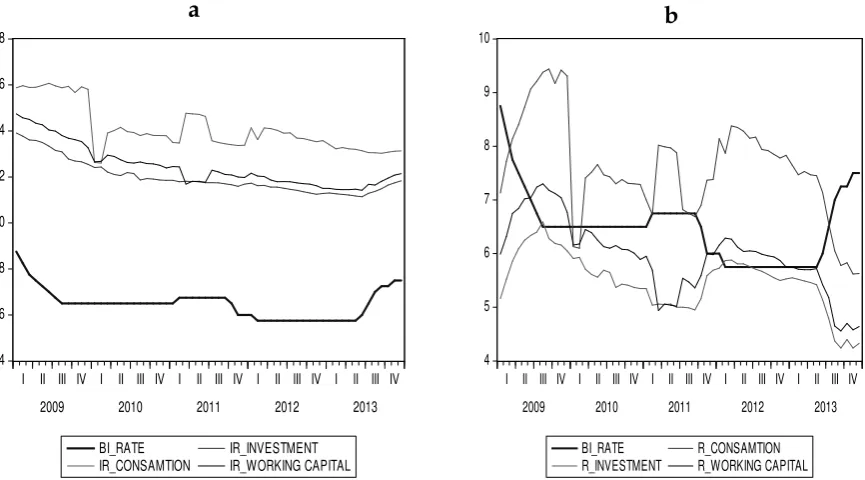
However, the efficiency of banks in Indonesia is still lower when compared with the banking industry in ASEAN. ASEAN banking efficiency levels between 20-40 per-cent, while Indonesian banks on average of 83,93 percent. This means that if compared with ASEAN banks, banks’ efficiency in Indonesia is very low. The low efficiency has resulted in high loan interest rate. Bank Indonesia has reduced the BI rate, but this decrease was not followed by a decrease in lending rates. In the last five years, lending
rates shows a decline in accordance with the BI Rate reduction, but if we look at the difference between the BI rate and loan interest rate, the loan interest rate does not follow the BI Rate decrease as Figure 2 shows:
High lending rates gave positive impact for banks in Indonesia. Net Interest Margin (NIM) of banks in Indonesia is the highest in the ASEAN region. The fact is banks in Indonesia have low efficiency but highest NIM in the ASEAN region. In the last 5 years, NIM of banks in Indonesia has not changed, even though OEOI and BI Rate is decreasing (Figure 3).
Average NIM of banks in Indonesia reached 5,58 percent compared with Philip-pines at 3,3 percent, Thailand at 2,6 percent, Malaysia at 2,3 percent, and Singapore at 1.5 percent. This situation clearly illustrates those banks in Indonesia practice high interest rate to achieve significant profit margin.
4 6 8 10 12 14 16 18
I II III IV I II III IV I II III IV I II III IV I II III IV 2009 2010 2011 2012 2013
BI_RATE IR_INVESTMENT IR_CONSAMTION IR_WORKING CAPITAL
4 5 6 7 8 9 10
I II III IV I II III IV I II III IV I II III IV I II III IV 2009 2010 2011 2012 2013
BI_RATE R_CONSAMTION R_INVESTMENT R_WORKING CAPITAL
Source : Indonesian Banking Statistics January 2009 - December 2013, processed. Notes : IR = Interest Rate, S = the difference between the Interest Rate with BI Rate.
Figure 2
(a) Comparison between BI Rate and Loan Interest Rate of All Banks in Indonesia, January 2009 - December 2013;
(b) Comparison between BI Rate and the difference between the Interest Rate with BI Rate of All Banks in Indonesia, January 2009 - December 2013.
4 5 6 7 8 9 10
I II III IV I II III IV I II III IV I II III IV I II III IV
2009 2010 2011 2012 2013
NIM R_INVESMENT
R_CONSUMTION R_WORKING CAPITAL
2 4 6 8 10 12
I II III IV I II III IV I II III IV I II III IV I II III IV
2009 2010 2011 2012 2013
BI_RATE NIM
OEOI ROA
Source: Indonesian Banking Statistics January 2009 - December 2013, processed. Notes: R = the differences between Credit Interest Rate with BI Rate.
Figure 3
(a) Comparison between NIM, the difference between the Interest Rate with BI Rate, BI Rate, OEOI and ROA of all Banks in Indonesia, January 2009 - December 2013; (b) Comparison between NIM, BI Rate, OEOI and ROA of All Banks in Indonesia,
January 2009 - December 2013.
a
b
This is a dangerous situation for Indonesia's competitiveness in facing MEA 2015.
The results of this study illustrate that the implementation of the API has no posi-tive impact for the creation of bank efficiency that should have an impact on the creation of competitiveness for Indonesia's economy in the next 5 years. API policies only have positive impact on banks with its fantastic profits, in the ASEAN region even in the world. Fantastic profits with higher interest have been practiced by banks in Indonesia, including state-owned banks such as BRI, Bank Mandiri and BNI as the largest bank in Indonesia.
CONCLUSION AND SUGGESTION Based on the analysis on the 15 largest banks in Indonesia in 2009-2013 can be summarized as follows: API policy has led to
increased concentrations of banks. This increase in concentration is not considered as a form anti competition, and so banks concentration level is not the factor that led to increased profitability but rather the efficiency that is carried out by the bank. So this study results support the efficiency hypothesis.
API policy only gave positive effect for banks but to the competitiveness of Indo-nesian economy. Banks efficiency has not been able to lower the high interest practice conducted by bank.
Recommendation from this research is that the Financial Services Authority (OJK) and the Business Competition Supervisory Commission (KPPU) and Bank Indonesia needs to revise its API`s policy to encourage the efficiency of banks and low interest practice.
4 5 6 7 8 9 10
I II III IV I II III IV I II III IV I II III IV I II III IV
2009 2010 2011 2012 2013
NIM R_INVESMENT
R_CONSUMTION R_WORKING CAPITAL
2 4 6 8 10 12
I II III IV I II III IV I II III IV I II III IV I II III IV
2009 2010 2011 2012 2013
BI_RATE NIM
OEOI ROA
Source: Indonesian Banking Statistics January 2009 - December 2013, processed. Notes: R = the differences between Credit Interest Rate with BI Rate.
Figure 3
(a) Comparison between NIM, the difference between the Interest Rate with BI Rate, BI Rate, OEOI and ROA of all Banks in Indonesia, January 2009 - December 2013; (b) Comparison between NIM, BI Rate, OEOI and ROA of All Banks in Indonesia,
January 2009 - December 2013.
REFERENCES
Ajide, F. M. dan J. O Ajileye. 2015. Market Concentration And Profitability In Nigerian Banking Industry: Evidence
From Error Correction Modeling.
International Journal of Economics,
Commerce and Management3(1): 1-12.
Al-Karasnehand, Ibrahim, dan A. M. Fatheldin. 2005. Market Structure and Performance in the GCC Banking Sector: Evidence from Kuwait, Saudi Arabia, and UAE. AMF Economic Papers. Number 11. Arab Monetary Fund., Abu Dhabi, United Arab Emirates: 1-46. Al-Obaidan, A. M. 2008. Market Structure,
Concentration and Performance in the Commercial Banking Industry of Emer-ging Markets.European Journal of Econo-mics, Finance and Administrative Sciences
12(1): 104-114.
Amalia, F. dan M. E. Nasution. 2007 bandingan Profitabilitas Industri Per-bankan Syariah dan Industri PerPer-bankan Konvensional Menggunakan Metode Struktur Kinerja Dan Perilaku. Jurnal Ekonomi Dan Pembangunan Indonesia
7(2): 31-51.
Abbasoglu, O. F., A. A. Faruk, dan G. Ali. 2007. Concentration, Competition, Efficiency and Profitability of the Turkish Banking Sector in the Post-Crises Period. Banks and Bank Systems
2(3):106.
Bhatti, G. A. dan H. Haroon. 2010. Evidence on Structure Conduct Performance Hypothesis in Pakistani Commercial Banks. International Journal of Business and Management5(9): 174-187.
Chen, S.H. dan C.C.Liao. 2011. Are foreign banks more profitable than domestic banks? Home and host-country effects of banking market structure, gover-nance, and Supervision. Journal of Banking & Finance35(4): 819–839.
Chortareas, G. E., J. G. G. Garcia, dan C. Girardone. 2010. Banking Sector Per-formance in Some Latin American Countries: Market Power versus Efficiency. Working Paper, Banco de Mexico. N. 2010-20: 1-25.
Cooper, W. W., L. M. Seiford, dan T. Kaoru. 2006. Introduction to Data Envelopment Analysis and Its Uses with DEA-Solver Software and References. Springer Science and Business Media, Inc. New York.
Gajurel, D. P. Dan R. S. Pradhan. 2011. Structure-Performance Relation in Nepalese Banking Industri. IAC S IT Press, Manila, Philippine.IPEDR2: 25-31 Gujarati, D. N. dan D. C. Porter. 2010.
Essentials of Econometrics, 4th ed. McGraw-Hill/Irwin. New York.
Günalp, B. dan T. Celik . 2006. Competition In The Turkish Banking Industry. Applied Economics38(11): 1335–1342. Hauner, D. dan S. J. Peiris. 2008. Banking
Efficiency and Competition In Low Income Countries: The Case of Uganda. Applied Economics40(21): 2703–2720. Hall, M. J. B. dan R. Simper. 2013. Efficiency
and Competition In Korean Banking.
Applied Financial Economics 23(10): 881– 890.
Hoxha, I. 2013. The Market Structure of The Banking Sector And Financially Dependen Manufacturing Sectors. Inter-national Review of Economics and Finance
27: 432–444.
Loukoianova, E. 2008. Analysis of the Efficiency and Profitability of the Japanese Banking System. IMF Working Paper. WP/08/63
Majid, M. Z. A, dan F. Sufian 2006. Consolidation and Competition in Emerging Market: An Empirical Test for Malaysian Banking Industry. Econ Change39(1): 105–124.
Maniatis, P. (2006). Market Concentration And Industry Profitability: The Case Of Greek Banking (1997-2004).International Business & Economics Research Journal 5(10): 39-48
Masood, O. dan B. S. Sergi. 2011. China’s Banking System, Market Structure, and Competitive Conditions. Front. Econ. China6(1): 22–35.
Mensi, S. dan A. Zouari. 2010. Efficient Structure versus Market Power: Theo-ries and Empirical Evidence. Inter national Journal of Economics and Finance
2(4):151-166.
Competition Of Islamic Banking In Malaysia.Humanomics24(1): 28-48. Mlambo, K. dan M. Ncube. 2014.
Compe-tition and Efficiency in the Banking Sector in South Africa. African Develop-ment Review23(1): 4–15.
Mulyaningsih, T dan A. Daly. 2011. Compe-titive Conditions In Banking Industri: An Empirical Analysis of The Consoli-dation, Competition And Concentration In The Indonesia Banking Industri Between 2001 And 2009. Buletin Ekono-mi, Moneter dan Perbankan Bank Indonesia
14(2): 151-185.
Naylah, M. 2010. Pengaruh Struktur Pasar Terhadap Kinerja Industri Perbankan Indonesia. Tesis Program Pasca Sarjana Universitas Dipenogoro.
Rettab, B,. H. Kashani., L. Obay. dan A. Rao. 2010. Impact of Market Power and Efficiency on Performance of Banks in the Gulf Cooperation Council Coun-tries. International Research Journal of Finance and Economics. Euro Journals Publishing, Inc50: 190-203.
Rinkevičiūtė, V dan R. Martinkutė-kaulienė. 2014. Impact Of Market Concentration On The Profitability Of Lithuanian Banking Sector. Business: Theory and Practice, 15(3): 254–260.
Samad, A. 2008. Market Structure, Conduct and Performance: Evidence From the
Bangladesh Banking Industry.Journal of Asian Economics19(2): 181-193.
Sanuri. 2011. Pembuktian Paradigma Struc-ture-Conduct-Performace atau Hipo-tesis Efficient-Structure Dalam Industri Perbankan Indonesia. Tesis. Program Pasca Sarjana Universitas Indonesia. Jakarta.
Sathye, M. 2005. Market Structure and Performance in Australian Banking.
Review of Accounting and Finance 4(2): 107-122.
Spulbăr, C. dan M. Niţoi. 2014. Deter-minants Of Bank Cost Efficiency In Transition Economies: Evidence For Latin America, Central And Eastern Europe And South-East Asia. Applied Economics46(16): 1940–1952.
Tajgardoon, G., M. Behname., dan K. Noormohamadi. 2012. Is Profitability as a result of Market Power or Efficiency in Islamic Banking Industri?Economics and Finance Review2(5): 01-07.
Ye, Q., X. Zongling dan D. Fang. 2012. Market Structure, Performance, And Efficiency of The Chinese Banking Sector.Econ Change Restruct45: 337–358 Zhu, J. 2014. Quantitative Models for