ANTECEDENT AND CONSEQUENCE FACTORS TO CEO TURNOVER
IN INDONESIA
ABSTRACT
This study aimed to test the usefulness of accounting information and market of the CEO turnover issues in Indonesia. The results of this study is planned for the long term to capture the overall factors that affect CEO turnover in Indonesia, not only from the accounting side but also from market side, so it can make a significant contribution for the company strategy to determine the corporate governance’ setting. Previous research show inconclusive results about CEO turnover is whether the antecedent factors and consequences. Also, the issue of CEO turnover research is still very rarely done in Indonesia, since the turn of information not generally available.
The sample used is all firms that are identified through the turn (either routine or non-routine) in the company's top management level (in this case is President Director). The main advantage of this study is to use the sample all firms that conduct the CEO turnover period 1998-2005, and subsequently determine the accounting variables that allegedly able to explain these changes. For the companies that during the year observations is never do turnover action we define as a control sample. Final sample that we used for testing accounting data is as much as 140 companies, consisting of 81 companies that make the turnover and the 59 companies that did not. For the final sample testing of market data totaled 131 firms, consisting of 77 companies that make the turnover and the 54 companies that did not. Final sample for the second data source is set after considering the availability of data and the confounding effects during the observation period.
Both of accounting data and market data are tested using logit models (separately), because the dependent variable used is a binary variable, 1 for turnover and 0 for others. The results of test show that accounting data (i.e. Total Asset, Total Sales, ROA, ROE and Earnings), statistically have a negative significant effect of turnover decisions while CurRatio and D/ Equity is not significant. The results of test for market data show the performance of stock prices statistically negative significant effect, while market risk have a statistically positive significant effect. This finding is consistent with previous research which states that in the CEO turnover decision making, the company will consider the performance of accounting and market performance achievements of the CEO. From the results of different test using paired samples t-test, we found the stock price rose significantly after the turn while the risk of being seen significant decreases. These findings reveal a positive response to the changing market. And finally, from the analysis of this study we conclude that the better performance of both (accounting and market) then there is a tendency for the incumbent CEO who will not be fired and the worse the performance of both the CEO who is appointed will have the potential to be replaced (down position or enter to the board of commissioners) and fired from the company as ultimatelly.
1. Introduction
A good corporate governance is the preparation of the team that will work from a plan set up to achieve it, is a basic framework that will determine the pattern, direction and achievement of company performance. For companies, having a strong management team to be an important reason to win the competition in the business world that are difficult to predict changes. In countries that already have very sophisticated technology, even though, sometimes the degree of influence was not significant executive leadership for the company because the management system has been running well, partial results showed that CEO turnover (forced or voluntary) have a material impact (positive or negative) significant effect on firm performance. Substitute (successor) CEO also becomes an important consideration in turn of different issues. External substitutes are needed in conditions of forced turnover when firms are faced with a deteriorating performance, because the external replacement is expected to bring a new strategy that is different from previous strategies that lowered the company's performance. While in the case of voluntary turnover, while CEOs get out because they have better opportunities in the labor market, generally the board of directors will choose a successor internally who have understood the company’s long-term strategy that posed no major changes, because the issue of voluntary turnover is usually the company does not confronted with problems of poor performance.
establishment of strategies in corporate governance. This study also expected to provide information, based on empirical evidence for companies (especially the board of directors) to determine the treatment of the company’s CEO, in a performance good or bad they had, with the use of accounting information. Therefore, this study aimed to find the answer to the question of whether the accounting and market information influence on CEO turnover decisions in Indonesia.
Baron, Hannan and Burton (2001) argued that research that analyzed the topic of CEO turnover needs to be done, because the CEO is considered as a very influential figure for the company. They expressed the need for an understanding that any changes in leadership occur, will cause changes to the organization that eventually would have an impact on organizational performance. The results of this study are consistent with statements from the modern institutional experts, that a leader, in this case is the CEO (especially if they are also the founders of the company), will largely determine the organizational blueprint, travel and the organization’s future. Organizational ecologists also reinforce the need to study about the reasons for changing the blueprint of corporate executives is synonymous with disrupt and destabilize the organization. CEO turnover does not just mean a change in top management teams, but also means changing the organizational blueprint of the companies which are already living in employee morale. Organization will be suffered with a high turnover in the organization. So, this change will have a tremendous effect is great, even on some of the research found the impact of CEO turnover led to bankruptcy (Carroll 1984; Davidson, Worrell & Datta 1993).
2. Theoretical Framework and Hypothesis Development
Study in the areas of CEO turnover in the field of accounting and capital markets have been started by Coughlan and Schmidt, (1985); Warner et al., (1988); and Weisbach, (1988). They have analyzed CEO turnover and begin developing the field of literature in this study. But until now, only few studies were done explanation of the variation between companies in the link between accounting and market-based performance measurement of sustainability executives working. Most of the previous study only see one side at the turn of the CEO, of the antecedents and consequences of changing course, and/or from the performance side of it accounting or market performance. Our study will try to conduct a longitudinal test by analyzing the antecedents and consequences of change on accounting performance and market performance as well, following the changes. Research Engel, Hayes and Wang (2003) examines how memboboti accounting and market-based performance measures in CEO turnover decisions are related to the weighting of traits as a measure of managerial performance. Specifically they are putting greater expectations on a more informative information on managerial performance. They argued that the board should have more trust in the accounting return in making decisions about the sustainability of employment, when the accounting information is proven to be more sensitive to explain the issue of CEO turnover.
2.1. Antecedent of CEO Turnover
presence of other factors that tend to moderate the relationship between performance with the replacement. This statement is found in many previous studies (see: Miller, 1991; Cannella and Lubatkin, 1993; Zajac and Westphal, 1996; Finkelstein and Hambrick, 1996).
2.1.1. Accounting Performance
Research Smith, Wright and Huo (2008) uses the variables are statistically significant finding in previous research. Variables that are offered in papers such as Total Assets, Total Debt, Book value of equity, Debt to equity, retained Earnings; Current Ratio, Interest Coverage Ratio, Net equivalent income / Interest expense. They found significant results with p-value smaller than 0.05 for all samples, including the Total Assets, Total Debt, Book Value of Equity, Current Liabilities, Current Liabilities, and the interest coverage ratio for the surviving company. Estimated coefficients for the current ratio is negative and statistically significant, a result which, according to Smith et al. study supports the findings of Altman et al. (1977) and Hill et al. (1996), and indicate that firms with lower current ratio has a greater probability of bankruptcy.
Return on Assets (ROA). These variables are widely used in previous studies that
analyzed the ratio is one of the accounting return on assets (Virany, Tushman, and Romanelli, 1985; Harrison, Torres, and Kukalis, 1988, Shen 2007). ROA found negatively related to turnover from the outside. Nothing is explained clearly, why the researchers use a variable ROA. Apparently, this is just about the selection of the many existing accounting ratio variables. However, the negative relationship found from previous research indicates that the deterioration in corporate performance as reflected by the low rate of return on corporate assets to boost CEO turnover.
Earnings (EBIT). Engel, Hayes and Wang (2003) and DeFond and Hung (2004) uses
decision, and linking these characteristics on performance measures. DeFond and Park (1999) suggests that firms in less concentrated industries have a broad comparison companies. Consequently the industry earnings provide the right signal as factors affecting the company in the industry. Engel et al. find that CEO turnover is more common in the less concentrated industries. This finding is consistent with DeFond and Park research that directors can learn more quickly about the ability of CEOs in this industry and further types can replace the poorly performing CEO immediately. This result is only found in DeFond and Park on the sample firms experiencing turnover. Engle et al. (2003); DeFond & Hung (2003) in their research found a negative relationship in the relationship between earnings and turnover. These findings reinforce the position antaseden earnings as factors of change. Ha1: Performance of accounting effect on CEO turnover
2.1.2. Stock Performance and Risk
Results of previous empirical research has given results that conflict still about the company’s stock performance. Warner, Watts and Wruck (1988) found a significant relationship between poor stock performance with a frequency change of management but found no significant relationship between excess return for shareholders on the announcement of management changes. Warner et al. (1988) and Jensen and Warner (1988) reported findings of abnormal return on announcement of a change in management is a combination of the effect announcement itself information (real information) and the effects of other information. Effects of information if it actually has a negative relationship implies that changes in company performance was so bad that achieve market in return. Beatty and Zajac (1985) also found a negative correlation of return (but) not significant at the announcement of management changes, while Furtado and Rozeff (1987) and Weisbach (1988) reported significant positive returns at the announcement of management changes.
Share Price. Paper written by Warner et al. (1988) is one of the beginners in the
price and market return with the company’s top management changes. They found there was a negative correlation (inverse) between the probability of change management with the company’s stock performance. Engel, Hayes and Wang (2003) also specifically examine the cross-sectional variation in an important position in the market return CEO decisions, and relate these properties on performance measures. Paper Engle et al. This paper examines how memboboti (give value) market-based performance measurement in CEO turnover decisions are related to the weighting of traits as a measure of managerial performance using a force until the turn of the CEO (forced Departures).
Beatty & Zajac (1987), previously, had argued in his study of a view that differs from similar research topics. Beatty and Zajac test the hypothesis by using a longitudinal research design/cross-sectional, with a sample of 209 large companies. Results they obtained showed that the announcement of CEO turnover is usually associated with a decrease in the value of the company, as reflected in the stock market perception, and subsequently penganti CEO (new) tend to affect significantly the production and investment decisions in the company. Substitute used in this paper is derived from within the party (insider) and external (outsider) companies. In the study of Beatty and Zajac also explained that there are two streams of research in connection with a change of leadership and performance. The first test of the impact of changes in leadership, as a rival to analyze the impact of leadership. Competing theories in the debate carried out by several groups. For example, the statement that common-sense states that managerial turnover will be encouraged to improve organizational performance, is opposed to using a vicious circle (Grusky 1963) who argue that managerial turnover, reduce performance. Ritual theory of black sheep (Gamson and Scotch 1964), on the other hand, postulates there is no significant relationship between turnover and performance. Beatty and Zajac this study, focusing only on changes in top leadership in large corporations, and studied the perceptions and reactions of capital markets before and after the change of CEO.
experiencing financial difficulties. They found positive and significant excess retun, which is consistent with the hypothesis of internal controls that management changes follow the company’s poor performance associated with benefits that would be obtained by shareholders. This condition implies that a change of management in the company’ss poor performance, will increase the return after the turn so it will be profitable for shareholders.
Risk. The analysis conducted Whiedbee and Farrell (2003) showed that the board
focuses on the expected deviation of performance, not on the CEO’s own performance, in making the CEO turnover decision, especially when there is an agreement (with no tolerance / lack of spread) among the analysts forecasting corporate earnings or when there are a large number of analysts to control the company. In addition, the results of Farrell and Whiedbee shows that the board seemed to appoint a CEO who will change their policy and corporate strategy (ie, originating from the outside) when the expected growth in EPS over the five years of decline and there is greater uncertainty (more spread out) in among analysts about the company’ss long-term forecasting.
Ha2: The performance has a significant market for CEO turnover.
2.2. Impact CEO Turnover
Results of research in studies of the consequences of CEO turnover indicates that a change can have positive effects on performance (Helmich, 1974; Davidson, Worrell and Dutia, 1993) if the CEO comes out is the personal which does not create a good performance for the company. However, some studies also found negative effects of change (Grusky, 1963; Allen, Panian, and Lotz, 1979; Carroll, 1984; Beatty and Zajac, 1987; Haveman, 1993), for causing a disturbance for the organizationally. Results of other studies have not looked at the turn of the consequences on performance if the change is only symbolize the event scapegoating (Gamson and Scotch, 1964; and Boeker, 1992).
Studies Beatty and Zajac (1987) also examine the impact (consequences) turnover and examine the information content of the announcement of CEO turnover. To prove that the notice fully and correctly anticipated by market participants, in the hope that there is a change in the price of shares in connection with the announcement of CEO turnover. They hypothesized that the company’s share price related to the announcement of CEO turnover. And then, the relationship between changes in leadership and market assessments in long-term adjustments in their production and investment decision analysis using ANCOVA test of Chow (1960).
problems in Indonesia, so that contributions from this research is better than previous research. This study will also examine the differences in market performance before and after the turn. Hopefully, there are significant differences between market performance (stock price and risks) to provide further explanations on the issue of turnover.
Ha3: There was significant difference between the market performance before and after
the change of CEO
3. Research Methods
3.1. Data and Research Sample
Data used in this study are all CEO turnover data from 1998 to 2005 period. Turnover that occurred during the period 2001-2003 and four consecutive years does not make the turn is the sample used in this study. Because we assume, this CEO will bring a change in the company until 2005. Data will be obtained from a direct investigation on the financial statements of all companies listed in Indonesia Stock Exchange for eight years observation. Consistent with previous studies, we will use the position of President Director of the company as CEO (in DeFond and Hung 2004) if the company does not use the term chief executive in writing. CEO turnover data obtained by scanning the data by comparing the company’s President Director of the company name during observations. In this way we hope to obtain information in case of change of name of CEO. CEO name change is what we mean by a change of CEO in a particular company in a given year.
three years of financial data prior to turnover and market data three years after the turn and did not have the confounding effects such as restructuring and stock management), the final sample for the turnover that use accounting data are amounting to 81 companies while for market data that can be used is for 77 companies.
3.2. Research Variables
3.2.1. Accounting and Market Performance Explaining Change (Change of CEO as
Dependent Variable)
Variables used in this study is the variable that has been used in previous studies (such as Smith, Wright and Huo 2008) found that variables are statistically significant in previous research. The variables we use are:
a) Total assets (ln-TAsset), as a proxy for company size, and is used to control the natural log data ketidaklinieran very high. These variables are believed to have a negative relationship between turnover because total assets increased reflecting the positive growth of the company.
b) Current ratio (CurRat), formulation of current assets / current liabilities, and served as a proxy for short-term financial shortage. Research in the bankruptcy case had previously shown a negative relationship to the probability of turnover (Flagg and Giroux, 1991, Zmijewski, 1984, and Altman, 1977) in Smith et al. 2008.
c) Debt to equity (DEquity), is a common ratio used in research into the level of debt proxy. The higher the ratio of total debt-to-total-equity found by Zmijewski (1984) - in Smith et al. 2008, the more significant increase in the probability of turnover.
d) Total sales (ln-TSales), which is the size of the company’s operational performance management with the log dinatural ketidaklinieran to control data. ln-TSales allegedly negatively related to turnover, which means that ln-high TSales will not encourage change of CEO.
f) Return on Equity (ROE), as an alternative to the successful consideration of return on equity management company. ROE values obtained from the equation of earnings divided by total equity. These variables are believed to have a negative relationship between turnover, so that failure in the capital pegembalian be the reason for the turnover for the company. g) Earnings. These measurements were used in Engle et al. (2003); DeFond & Hung
(2004) and gives a negative relationship between earnings and turnover. This size become very common and widely used as a consideration of performance management. We use net income to represent earnings.
h) Share Price (ln-SPrice). What is the measure of success wealth managers to increase the company’s owner. Decreasing stock prices are expected to increase the probability of turnover.
i) Risk. Farrell and Whiedbee examine CEO turnover and replacement decisions from different perspectives with the expectation of performance. This variable is similar to that used in the study and Weintrop puffer (1991). Meanwhile, Bushman (2008) use return volatility as a proxy for risk. However, in this study we will use as a proxy for the market beta risk. The higher the risk the greater the probability the company CEO of a company’s turnover.
3.2.2. Following Market Variable Substitution CEO
Our study will only examine the variables that follow the market as a factor the issue of turnover. For the variable market, if previous studies using daily stock price since previous research using the date of announcement (such as: Setiawan 2008, Beatty and Zajac 1987), our research using share prices and the annual risk, because we use the observations at the turn of the year. Market factors we think are more sensitive to the issue of turnover compared with the accounting because accounting performance generally requires a relatively long span of time to respond to the phenomenon that happens.
Testing of antecedent variables (Ha1 and Ha2) will use the logit as in equation (1) that is commonly used in research that uses binary variables as the dependent variable (in this study a = change and 0 = others) and cross sectional data. This research model has been widely used in research in Accounting and Management. Zhou, Xiong and Garguli (2009) who conducted a study in the field of accounting also uses the binary model when they use the dependent variable and not pengadopasian IFRS. They further symbolizes Adopt (1.0). They use logit analysis to examine possible relationships between independent and dependent variables. Hoetker (2007) using logit models in his research on strategic management issues. From studies in many papers, in recent years logit analysis to be one important part of research analysis, to maintain the strength of methodology in which high-standard journals.
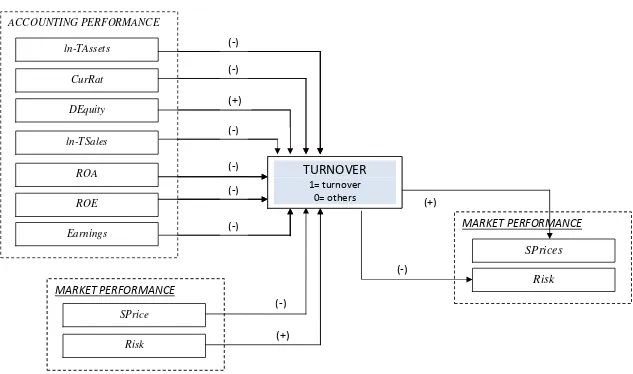
TURNOVER (1,0)= α0 + α1ln-TAssetsit + α2CurRattit +α3DEquityit + α4ln-TSalesit +
α5 ROAit + α6ROIit + α7Earningsit + α8SPriceit + α9Riskit + εit (1)
Ha3 to market performance was tested by using paired samples t-test for this hypothesis different from trying to test an average of two mean originating from the same sample.
3.3.1. Additional tests
In this study, we will conduct testing for the change that occurs regularly and non-routine in addition to explaining the turnover issue in Indonesia. Additional tests are expected to provide explanatory power to the main test results. This research model as a whole we show in Figure 1.
4. Results and Analysis
4.1. Logit Regression Results on Accounting Performance
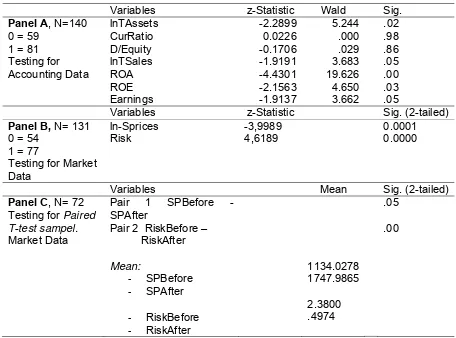
Overall, the logit test results for the accounting data used in this study (such as Total Assets, Current Ratio, Debt to Equity, Total Sales, ROA, ROE and Earnings) shows a significant effect on turnover decisions on the level of p = 0.000. And individually, five of the seven accounting variables showed significance at p ≤ 0.05 level. This value is supported by an omnibus test of chi-square test which shows the influence of antecedent models in accounting and a very strong market significance, respectively (p = 0.000). The value of chi-square omnibus test of model coefficients that are less than p = 0.05 this indicates that the nul hypothesis of the study stating that there was no influence of independent to dependent variable is rejected. Furthermore, Nagelkerke’s R square which is a modification of the coefficient of cox and Snell R square is used as a consideration to ensure variety of relationship for each independent variable on the dependent variable. Effect of independent variables collectively indicated by Nagelkerke’s R square value of 0.67 and 0.98 on accounting variables on market variables, while the partial value of Nagelkerke’s R square indicated by Wald and significance. Special market variables, Waldnya value could not be explained because this relationship is very strong.
Table 2 describes the characteristics and results of tests conducted in this study along with the sample. Panel A of Table 2 examines the effect of the change of CEO turnover sample of 140 companies consisting of 59 firms with no change and 81 companies with turnover. testing showed logit for accounting data. By using accounting data, the analysis show that of the seven accounting variables analyzed in this study, five variables showed significance of the turnover. Total Sales and Earnings significant at the level of p ≤ 0.05, Total Assets and ROE levels of significance at p = 0.05, and for the ROA variable is significant that the most powerful show that is equal to p ≤ 0.0000. However, we did not find this significance in the variables and the Current Ratio, Debt to Equity Ratio of turnover.
previous researchers, Engel, Hayes, and Wang (2003), who hopes the accounting information into the information considered when making important decisions at the company. ROA variables that showed significance at the turn of a strong relationship is also consistent with the findings of Shen (2000) that test the ROA and discover the significance of the turnover. These results indicate that the accounting performance be a factor considered by the company when deciding on CEO turnover.
4.2. Logit Regression Results on Market Performance
Panel B shows the results of the test market data. In a sample of 131 samples comprising 77 companies and 54 companies do change control (which does not make the turn), the results of our analysis found strong support to influence the stock price variable (Sprices) and Risk. We get for the stock price is negatively related statistics (z-statistic -3.9989) is significant at the level of p = 0.0000, and so did the risk variables are statistically related to the positive (z-statistics 4.6189) significantly to the company CEO turnover. These results indicate that stock prices are declining on average over three years led to the change of CEO. Stock prices are found to be a determining factor when deciding which changes in the results of our study is consistent with the results of previous research conducted by Eagle et al. (2003), Beatty and Zajac (1987), DeFond and Hung (2004), and Warner, Watts and Wruck (1988).
Similar to the stock price, increasing the risk that the company is positively related with the probability of turnover. In other words, companies that have a high risk that the company would be viewed as a bad performance so to do a repair, and in this case the CEO is the person deemed most responsible for the deteriorating performance of the company’s market, so needs a replacement. This finding is consistent with the study results and Whidbee Farrell (2003) who found a positive relationship with EPS deviation from analyst forecasts. These findings both support our second hypothesis that a market performance variables that influence in determining CEO turnover in Indonesia.
In our market data to test the different separation rates and market risk the company three years before and three years after the CEO turnover year by using paired t-test samples. Table 2 Panel C shows the results of different test against 72 companies, and we found a significant difference to the stock price and market risk before and after the company between the CEO turnover in Indonesia. Mean stock price before the change amounted to 1134.028 (SPBefore) while the mean after pergatian increased to 1747.986 (SPAfter). From the test results are statistically analyzed paired samples there are significant differences at the level of 0:05 in the stock price. These results support the study Johnson et al. (1985) and Warner et al. (1988) who found and reported a positive stock price reaction after the turn, but both these studies failed to show significant share price reaction.
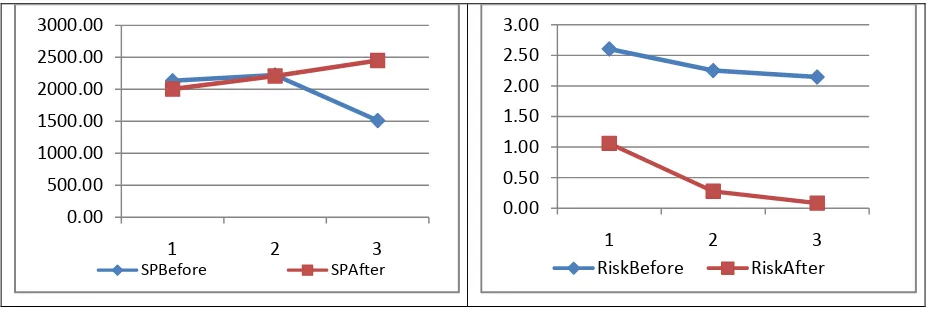
Market risk, in turnover companies, found significant at the 0.0001 level with t = 31. 471. Mean risk is the market before the turnover of 2.380 (RiskBefore) and decreased significantly to 0497 (RiskAfter) after the turnover. The result of the second Test of this market variables supporting our third hypothesis which states that there are any differences of market performance in before and after turnover. These results indicate that CEO turnover appreciated positively by the market participants thereby increasing the company’s stock price performance and reduce market risk, in other words, turnover is viewed by principals as a efforts of companies to improve corporate performance in the future and can improve the welfare of their owners. These results prove that the companies that make replacement CEO, who generally come from companies that declined during the three-year stock performance before the turnover, can improve the performance of the company’s market for at least three years after the turn. Figure 2 shows the changes in stock prices and risk after CEO turnover.
with a UK study conducted by Dahya et al. (1998), where the market reacted positively to the 67 top management changes that are not routine reporting from Extel between 1989 and 1992.
Positive and negative reactions are found on market reaction in the study of changes caused by factors that are contingent on the issue of turnover. Generally if CEO turnover occurs in companies that have poor performance, then these changes will be responded positively by the market. Positive reactions are common for CEOs who come from outside. The reason for that is built on this case is the CEO who comes from outside is expected to provide change for a company that has failed to provide welfare to its shareholders by bringing new strategies into the company. While for some turnover in underperforming companies, the market reacts to the home also found a new CEO, the CEO of the positive and negative for the CEO from the outside. But the market reaction found in this type of turnover is not excessive. In addition to the CEO of origin, age factors (related to retirement) and the new CEO personality affects the market reaction is also found. This condition is well described by using the contingencies theory.
4.4. Additional Tests: Market Performance of Routine and Non-Routine
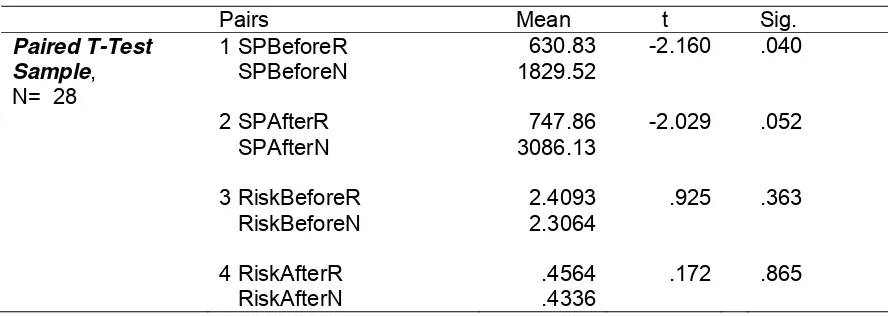
We defined turnover process very carefully. Non-routine turnover is turnover that resulted in the CEO does not have served any time (the board of commissioners or members of top management team) in the original company and whose ownership or in the same company. Setiawan (2008) uses the direction of Kang and Shivdasani (1996) in identifying the process of replacing non-routine and routine. If the CEO who turned out to be a member of the board of commissioners then considered a routine replacement process, is the opposite. In addition to being members of the commissioners, we also consider the research on CEO turnover at firms whose ownership and also consideration of a member of top management team. Furthermore, we found a significant difference (p = 0.04) in the share price before the change of routine at the price of shares before non-routine turnover. So did the stock price difference after the turn of the routine with the following non-routine changes (significant at level 0.05).
We do further analysis on the risk variables to the process of change and non-routine routine both before and after the turn. Mean at risk before the turn of the routine (RiskBforeR) is approximately 2409, while the mean risk before non-routine turnover seen lower the amount of 2306. Decrease in mean values of risk occurs after the turn of routine and non-routine, each became 0456 and 0434. Once again we make the conclusion that non-routine turnover is considered to have more good news than content with a change in routine. And this is reflected in the risk of diminishing the company at the turn of non-routine, although not significant.
5. Conclusions, Implications and Limitations
the variable lnTAsset, lnRSales, ROA, ROE and Earnings. This finding is well explained about kemanfaat accounting information, which is expected by the public accounting as an information considered in the decision of the company. In addition to accounting information, market information looks to be a consideration (antecedent) and action (consequences) of turnover. The stock price is relatively increased after the company’s turnover and the risk of a significant decrease at level < 0001.
The results inform the existence of a signal to turn on accounting and market performance have been declining in the company. Owners increasingly consider the performance of accounting firms in making important decisions at the company, in this case is in consideration of CEO turnover. CEO turnover is not an easy action in an organization because the CEO change means changing the organizational model and lead the organization “sick” (Baron, Hanan and Burton 2001). So that shows the significance of accounting information when tia is used in making important decisions for its users, in this case is the company. And the significance of accounting information can not be separated from the quality of the information. On the other hand, the owner of the company’s turnover also must make decisions very carefully, because the turnover action had a significant response from the market. This reaction will affect the welfare of that will be received by the owners at the end.
Although we have done prudence in carrying out this research, such as sample selection and data considerations, but we still feel the lack, in this work we will improve as a motivation for future research. Several limitations in this study is not yet considering the reasons broader changes like retirement, death, or changes that are forced or voluntary, that the results of previous research diarea show considerable effect. For further research, it is necessary to consider the following characteristics with the personality of the CEO comes out and the new. Logit models are still a lot of statistical testing model used to regress the dependent variable is dichotomous or binary variables.
Allen, P. A. and Panian, S. K. 1982. Power, performance, and succession in the large corporation. Administrative Science Quarterly 27:538-547.
Altman, E., Haldeman, R., & Narayanan, P. 1977. Zeta analysis, a new model for identifying bankruptcy risk of corporation. Journal of Banking and Finance 1: 29-54.
Baron, James N., Hannan, Michael T., and Burton, M. Diane. 2001. Labor Pains: Change in Organizational Models and Employee Turnover in Young, High-Tech Firms. The American Journal of Sociology 106(4): 960-1012.
Beadles II, N. A., Lowery, Christopher M., Petty, M. M., and Ezell, H. 2000. An Examination of the Relationships between Turnover Functionality, Turnover Frequency, and Organizational Performance. Journal of Business and Psychology 15(2): 331-337
Beatty, Randolph P. and Zajac, Edward J. 1987CEO Change and Firm Performance in Large Corporations: Succession Effects and Manager Effects. Strategic Management Journal 8(4): 305-317.
Boeker, W. 1992. Power and managerial dismissal: Scapegoating at the top. Administrative ScienceQuarterly 37: 400-421.
Borstadt, L. 1985. Stock price reaction to management changes, Unpublish paper (University of Utah, Salt Lake City, UT).
Bonnier, Karl-Adam, and Bruner, Robert F. 1989. An analysis of stock prices reaction to management change in distressed firms. Journal of Accounting and Economics 11: 95-106.
Bushman, Robert., Dai, Zhonglan, Wang, Xue. 2008. Risk and CEO Turnover. Working Paper Series.
Cannella, JR., Albert, and Lubatkin, Michael. 1993. Succession as a sociopolitical process: Internal impediments to outsider selection. Academy of Management Journal 36(4): 763-793.
Carroll, G. R. 1984. Organizational Ecology. Annual Review of Sociology 10; 71-93.
Chow C. 1960. Test of equality between subsets of coefficients in two linear regressions, Economnetrica 28: 591-609.
Coughlan, A. T. and R. M. Schmidt. 1985. Executive compensation, managerial turnover, and firm performance: An empirical investigation. Journal of Accounting and Economics 7: 43-66.
Davidson, W. N., D. Worrell, and D. Dutia. 1993. The stock market effects of CEO succession in bankrupt? Journal of Management 19(3): 517-533.
Dedman, Elisabeth and Lin, Stephen W.J. 2002. Shareholder wealth effects of CEO departures: Evidence from the UK. Journal of Corporate Finance 8: 81–104
Defond, Mark L. and Hung, Mingyi. 2004. Investor Protection and Corporate Governance: Evidence from Worldwide CEO Turnover. Journal of Accounting Research 42(2): 269-312.
Denis, David J. and Denis, Diane K. 1995. Performance Changes Following Top Management Dismissals. The Journal of Finance 50(4): 1029-1057.
Engel, Ellen, Hayes, Rachel M., and Wang, Xue. 2003. CEO turnover and properties of accounting information. Journal of Accounting and Economics 36: 197–226.
Farrell, Kathleen A., and Whidbee, David A. 2003. Impact of firm performance expectations on CEO turnover and replacement decisions. Journal of Accounting and Economics 36: 165–196.
Flagg, J., & Giroux, G. 1991. Predicting corporate bankruptcy using failing firms. Review of Financial Economics 1(1): 67-78.
Fredrickson, James W., Hambrick, Donald C., and Baumrin, Sara. 1988. A Model of CEO Dismissal. The Academy of Management Review 13(2): 255-270.
Furtado, F.P. and Rozeff, M.S. 1987. The wealth effects of company initiated management dwatges, Journal of Financial Economics 18: 147-160.
Gamson, W., and Scotch, N. 1964. Scapegoating in baseball. American Journal of Sociology 70:69-76.
Grusky, O. 1964. Reply to Scapegoating in Baseball. American Journal of Sociology 70: 72-76.
Harrison, J. R., D. L. Torres, S. Kukalis. 1988. The changing of the guard: Turnover and structural change in top-management positions. Administration Science Quarterly 33: 211-232.
Haveman, Heater. 1993. Organizational size and change. Administrative Science Quarterly 38: 20- 50.
Helmich, D. L. (1974). 'Organizational growth and succession patterns', Academy of Management Journal 17: 771-775.
Hill, N., Perry, S., & Andes, S. 1996. Evaluating firms in financial distress: An event history analysis. Journal of Applied Business Research 12(3): 60-71.
Hoetker, Glenn. 2007. The Use Of Logit And Probit Models In Strategic Management Research: Critical Issues. Strategic Management Journal 28: 331–343.
Huson, Mark R., Parrino, Robert, and Starks, Laura T. 2001. Internal Monitoring Mechanisms and CEO Turnover: A Long-Term Perspective. The Journal of Finance 56(6): 2265-2297
Jackofsky, Ellen F. 1984. Turnover and Job Performance: An Integrated Process Model. The Academy of Management Review 9(1): 74-83.
Jackofsky, Ellen F., Slocum, John W., McQuaid, Jr., Sara J. 1987. Cultural Values and the CEO: Alluring Companions? The Academy of Management Executive 2(1): 39-49.
Jensen, Michael C. & Warner, Jerold B., 1988. The distribution of power among corporate managers, shareholders, and directors. Journal of Financial Economics 20(1-2): 3-24. Kang, Jun-Koo & Anil Shivdasani. (1996). Does the Japanese Governance System Enhance
Shareholder Wealth? Evidence from the Stock-Price Effects of Top Management Turnover. The Review of Financial Studies 9(4): 1061-1095.
Kesner IF, and Sebora TC. 1994. Executive succession: past, present & future, Journal of Management 20: 327-372.
Miller, D. 1991.'Stale in the saddle: CEO tenure and the match between organization and environment, Management Science 37: 34-52.
Puffer, Sheila M., and Weintrop, Joseph B. 1991. Corporate performance and CEO turnover: the role of performance expectations. Administrative Science Quarterly 36:1-19.
Rappaport, A. 1981. Selecting strategies that create share-holder value. Harvard Bulsiness Review May-June: 139-149.
Reinganum, M.K., 1985, The effect of executive succession on stockholder wealth, Administrative Science Quarterly 30:46-60.
Setiawan, Doddy. 2008. An Analysis Of Market Reaction To CEO Turnover Announcement: The Case In Indonesia. International Business & Economics Research Journal 7(2): 119-127.
Shen, Wei. (2000). Political dynamics within corporate upper echelons and their Impacts on contender and outsider CEO successon. Academy of Management Proceedings BPS: H1.
Smith, Frank, Wright, Alan, and Huo, Y. Paul. 2008. Scapegoating Only Works If The Herd Is Big: Downsizing, Management Turnover, And Company Turnaround. International Journal Of Business Strategy 8(3): 72-83.
Virany, Beverly, Michael L. Tushman, and Elaine Romanelli. 1992. Executive Succession and Organization Outcomes in Turbulent Environments: An Organization Learning Approach. Organization Science 3: 72-91.
Warner, Jeroid B. Watts, Ross L., and Wruck, Karen H. 1988. Stock prices and top management changes. Journal of Financial Economics 20: 461-492.
Weisbach, Michael S. 1988. Outside directors and CEO Turnover. Journal of Financial Economics 20: 431-460.
Zajac, E. J. and J. D. Westphal. 1996. 'Who shall succeed? How CEO/board preferences and power affect the choice of new CEOs'. Academy of Management Journal 39: 64-90. Zhou, Haiyan, Xiong, Yan and Ganguli. 2009. Does The Adoption of International Financial
Reporting Standards Restrain Earnings Management? Evidence from an Emerging Market. Academy of Accounting and Financial Studies Journal 13 Special Issue: 43-56. Zmijewski, M. 1984. Methodological issues related to the estimation of financial distress
APPENDICES
Table 1
Sampel Selection
Describe Amount Total Companies Investigate period 1998-2006
Total turnover identified 1998-2006
Pergantian tanpa perubahan selama 4 tahun berturut-turut dalam periode 2001-2003
Final Sample for accounting data Final Sample for market data
Fnal sample for Sampel akhir untuk uji beda data pasar
3200 *81 turnover sample; 59 control sample
** 77 turnover sample dan 54 control sample
*** Control sample is a company that during the years 1998-2005 observed no change in CEO. The company is expected to have a relatively stable performance. Accounting and market data that we use for analysis is the average data over five year periods from 2001 to 2005.
Table 2
Testing Result each Hypotesis
Variables z-Statistic Wald Sig.
Variables z-Statistic Sig. (2-tailed)
Table 3
Result of Additional Testing
Pairs Mean t Sig.
Paired T-Test Sample, N= 28
1 SPBeforeR SPBeforeN 2 SPAfterR SPAfterN 3 RiskBeforeR RiskBeforeN 4 RiskAfterR RiskAfterN
630.83 1829.52 747.86 3086.13 2.4093 2.3064 .4564 .4336
-2.160
-2.029
.925
.172
.040
.052
.363
(
‐
)
Figure 1. Testing Model
Figure 2. Share Price and Risk, before and after turnover.
LOGIT Result of Accounting Data
EVIEWS
Dependent Variable: Y
Method: ML - Binary Logit (Quadratic hill climbing) Date: 06/02/10 Time: 06:47
Sample: 1 140
Included observations: 140
Convergence achieved after 8 iterations
Covariance matrix computed using second derivatives
Variable Coefficient Std. Error z-Statistic Prob.
X1 -0.978792 0.427436 -2.289916 0.0220
X2 0.000427 0.022612 0.018895 0.9849
X3 -0.002710 0.015885 -0.170591 0.8645
X4 -0.699486 0.364486 -1.919103 0.0550
X5 -1.269806 0.286631 -4.430109 0.0000
X6 -0.020631 0.009568 -2.156346 0.0311
X7 -0.003231 0.001688 -1.913732 0.0557
C 0.713474 1.237403 0.576590 0.5642
LOGIT Result of Market Data
Dependent Variable: Y
Method: ML - Binary Logit (Quadratic hill climbing) Date: 05/31/10 Time: 10:58
Sample: 1 131
Included observations: 131
Covariance matrix computed using second derivatives
Variable Coefficient Std. Error z-Statistic Prob.
X1 -0.489785 0.122477 -3.998982 0.0001
X2 2.563277 0.554955 4.618895 0.0000
C 0.599274 1.853769 0.323273 0.7465
McFadden R-squared 0.899550 Mean dependent var 0.587786 S.D. dependent var 0.494123 S.E. of regression 0.100747
Akaike info criterion 0.181943 Sum squared resid 1.299199 Schwarz criterion 0.247787 Log likelihood -8.917248 Hannan-Quinn criter. 0.208698 Restr. log likelihood -88.77269 LR statistic 159.7109 Avg. log likelihood -0.068071 Prob(LR statistic) 0.000000
ADDITIONAL TESTING:
T-Test
Paired Samples Test
-613.959 2637.41792 310.82268 -1233.72 5.80408 -1.975 71 .052
1.88264 .43337 .05107 1.78080 1.98447 36.862 71 .000
SPBefore - SPAfter
-1198.69 2936.58813 554.96299 -2337.38 -60.00142 -2.160 27 .040
-2338.27 6098.13412 1152.439 -4702.88 26.33670 -2.029 27 .052
.10286 .58866 .11125 -.12540 .33111 .925 27 .363
.02286 .70306 .13287 -.24976 .29548 .172 27 .865