QUALITATIVE EVALUATION OF QUANTUM
ENHANCEMENT
FOR EDGE DETECTION OF MEDICAL
IMAGES
1A.B. MUTIARA, 2R. REFIANTI, 3M.C. KAMU
1
Prof, Faculty of Computer Science and Information Technology, Gunadarma University, Indonesia 2
Asst.Prof, Faculty of Computer Science and Information Technology, Gunadarma University, Indonesia 3
Alumni, Faculty of Computer Science and Information Technology, Gunadarma University, Indonesia E-mail: 1,2{amutiara,rina}@staff.gunadarma.ac.id, [email protected]
ABSTRACT
In recent years, quantum mechanics has been connected with computer science, information theory in communication and digital signal processing. Developing new computing methods and signal processing algorithms by borrowing the principle of quantum mechanics is a very interesting and new research topic. In this research, a quantum digital image processing algorithms will be presented and compared to five other edge detection algorithms, such as Roberts, Sobel, Prewitt, Laplacian of Gaussian, and Canny. Therefore an edge detection method comparison using MATLAB is done in order to find the best edge detection method for qualitative evaluation, namely sensitivity and specificity. From all the comparisons process, the best edge detection method for sensitivity and specificity is known. For the sensitivity, Canny’s edge detection algorithm without quantum enhancement is the best method with sensitivity value amount 83.33% and for the specificity, Roberts edge detection algorithm using quantum enhancement is the best method with specificity value amount 83.33%.
Keywords: Image processing, Edge Detection Algorithm, Quantum Signal Processing, Qubit
1.
INTRODUCTIONDigital image processing technology has developed rapidly. An image is rich of information, but the information in the image is sometimes degraded, as it contains noise, blurring, less sharp, and so on. Therefore, the image needs to be manipulated into another image which has better quality. In medical and biological fields, image data are ubiquitously used in clinical as well as scientific studies to infer details regarding the process under investigation whether it be a disease process or a biochemical pathway. There are two main issues that concern the field of image processing and analysis applied to medical applications, such as improving the quality of the acquired image data and extraction of information from medical image data in a robust, efficient, and accurate manner [1-2].
There are many applications of edge detection technique in medical images such as outlining of tumors or organs, extraction of interested objects like needle or other surgery tools. In recent years, quantum mechanics has been connected with computer science, information theory in communication and digital signal processing. Thus,
developing new computing methods and signal processing algorithms by borrowing from the principle of quantum mechanics is a very interesting and new research topic. A quantum digital image processing algorithms will be presented and compared to five other edge detection algorithms, such as Roberts, Sobel, Prewitt, Laplacian of Gaussian, and Canny [3-7].
Following Omer and Prasanna [2], we develop a qualitative evaluation criteria, especially the accuracy is characterized using the metrics of sensitivity (SE) and specificity (SP). Both these measures describe the edge detector’s ability to correctly identify true edges, while it negates the false alarms. Sensitivity and specificity can define by True Positive (TP), False Positive (FP), False Negative (FN), and True Negative (TN). With this qualitative evalution criteria, we cloud find which edge detection algorithm is the best or better than the others.
evaluatin criteria are presented in Sec.4. Testing means here, we present the concept of accuracy that refers to the quality of information provided by an edge map. The assessment of the edge map accuracy is necessary. The accuracy is characterized using the metrics of sensitivity (SE) and specificity (SP). Following section are experimental results and conclusion of our work.
2.
BASIC THEORY2.1 Quantum Signal Processing
The information of a binary bit is represented by the state 1 or 0 in classical information processing. In QSP [8-9], the bit is called qubit (Quantum Bit). The state of a qubit is a superstition of two quantum states |0> and |1>, i.e |1> are the two ground states in one qubit system.
In a n-qubit quantum subsystem, let the state of the ith qubit be:
| ϕi> = ai |0> + bi |1> (2)
According to the principle of quantum states superposition, then, the state of the n qubits quantum subsystem is the tensor product state of n qubits, which is defined as:
n is the probability amplitudes of the ith ground state; |Wi|
2
is the probability of the ith ground state. They must satisfy the normalizing condition:
∑
−2.2 Definition of a Pixel Qubit
The mathematics expression of a pixel qubit is needed with the elicitation of the basic principles of QSP, In order to map the pixel gray value in an image space to the quantum system space, Let f(m,
n) be a normalized input image, f(m, n)ϵ [0,1] is the gray value of the (m, n) pixel. Under the viewpoint of the probability statistics, the (m, n) pixel qubit single quantum system. They are the corresponding black and white states of the current pixel binary image. 1-f(m,n) are the appearance probability of states |0> and |1>.
2.3 Quantum Probability Statistics for Image Enhancement
Theoretically, an ideal edge of medical images has the step change in gray level [11]. However, practical edges are usually blurred, low contrast because of the impact of optics, sampling, and other imaging imperfections. Therefore, the real edges are more like a ramp profile. In order to detect edge effectively, image enhancement for medical images is needed to obtain high contrast and eliminate noise to some degree. An image enhancement operator based on the quantum probability statistics was proposed firstly by Fu et.al. [10], which combines with gray correlative characteristic of pixels in the 3x3 neighborhood window.
111
Table 1. Location of Pixels in The 3x3 Neighborhood
P7 P6 P5
P8 P1 P4
P9 P2 P3
where |Wi|2 is the probability of the corresponding ground state in three qubits subsystem, composed of
P8,P1,P4 pixels.
In order to enhance the information in the horizontal direction, according to the probability statistics in the three qubits subsystem, the operator
OP0° is defined as:
Similarly, the operators of the P1 pixel in the 45°, 90°, and 135° directions are expressed as follows:
2 operators is considered as the output gray value GF (m,n) of the P1 pixel after the processing, GF (m,n) ϵ [0; 1]. That GF (m,n) is enhanced gray value of current pixel, and is defined as:
{
}
3.
ANALYSIS AND DESIGN PROCESSThere are ten edge detection algorithms will be compared. The algorithms are Roberts, Prewitt, Sobel, Laplacian of Gaussian (LoG), Canny, Quantum Roberts, Prewitt Quantum, Quantum Sobel, Quantum Laplacian of Gaussian, and Quantum Canny.
There are several phases to be done in the process of this comparative analysis.
• Sample Collection. Sample collection is done through a search on the Internet. X-Ray images that can be accessed for free are massive. There are 30 X-ray images used in this study. X-ray image is used because it is related with this research focus on medical images. The images are generally consists of various parts of skeleton and human bones, such as back bone, skull, fingers, feet, and knees.
• Data preprocessing. Data preprocessing is used to minimize the noise. In this research, the data preprocessing phases include sample cropping and resizing.
• Sample cropping. X-ray images usually have extra background that does not need to be researched, for example a white background on the four sides of the image. Extra background in the X-ray images can be a noise for the output of image processing.
• Sample Resizing. Image that has been collected has various resolutions, such as 375x500, 600x942, and many more. To make an accurate result and analysis, then all images converted to 240x320. This size is chosen since commonly fit in the center of a computer monitor or even cell phones without being too large or too small to analyze.
• Coding using Matlab.
• Analysis. At this phase, the analysis is done on each processed image. There are 30 images are analyzed, where an original image will be processed to obtain the results of edge detection with or without quantum enhancement. Then, the result of this process will be compared with the parameters used. These parameters will be explained in detail in testing section.
• Output. The result of the analysis that has been done is a statement that shows the edge detection method which produces the best output based on sensitivity and specificity. The outputs of this research are hoped to be able to give a solid reference for researches related to the field of image processing, medical imaging and computer vision.
The concept of accuracy refers to the quality of information provided by an edge map. Thus, the assessment of the edge map accuracy is necessary. Refers Omer and Prasanna [2], the accuracy is characterized using the metrics of sensitivity (SE) and specificity (SP). Both these measures describe the edge detector’s ability to correctly identify true edges, while it negates the false alarms. Sensitivity and specificity can define by True Positive (TP), False Positive (FP), False Negative (FN), and True Negative (TN).
4.1 Sensitivity and Specificity
Sensitivity expresses the probability of identifying a true edge as edge pixel. The sensitivity is computed as:
FN TP
TP y Sensitivit
+
= (12)
Specificity expresses the probability of identifying an actual non-edge as non-edge pixel. The specificity is computed as:
FP TN
TN y Specificit
+
= (13)
4.2 Qualitative Evaluation
The value of TP, FP, FN, and TN can be measured by determined the range value from 1-5. 1 is the lowest value and 5 is the highest value for the criteria of each parameter. The qualitative values of each parameter are shown in Table 2 through Table 5.
Table 2. Qualitative Evaluation for True Positive Values True Positive
1 Very small parts of existing edges are marked 2 Small parts of existing edges are marked 3 Moderate parts of existing edges are marked 4 Most parts of existing edges are marked 5 Almost all parts of existing edges are marked
Table 3. Qualitative Evaluation for False Positive Values False Positive
1 Very small parts of wrong edges are marked 2 Small parts of wrong edges are marked 3 Moderate parts of wrong edges are marked 4 Most parts of wrong edges are marked 5 Almost all parts of wrong edges are marked
Table 4. Qualitative Evaluation for False Negative Values False Negative
1 Very small parts of existing edges are left empty
2 Small parts of existing edges are left empty 3 Moderate parts of existing edges are left empty 4 Most parts of existing edges are left empty
5 Almost all parts of existing edges are left empty
Table 5. Qualitative Evaluation for True Negative Values True Negative
1 Very small parts of blank spaces are left empty 2 Small parts of blank spaces are left empty 3 Moderate parts of blank spaces are left empty 4 Most parts of blank spaces are left empty 5 Almost all parts of blank spaces are left empty
These parameters are determined to measure the value of sensitivity and specificity for ten edge detection algorithms. To determine the value of each parameter, the process will be done manually by seeing the outputs of images which are processed with edge detection algorithms. Then, sensitivity and specificity are measured based on the formula to determine which output image has better result.
4.3 Testing Result
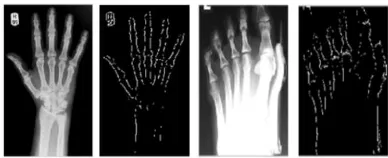
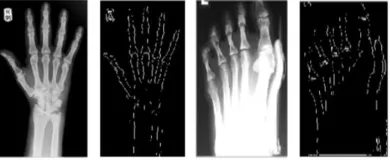
Fig. 1 through Fig. 10 is the results of each edge detection algorithm.
Figure 1. Images processed by Roberts algorithm
Figure 2. Images processed by Sobel algorithm
Figure 4. Images Processed by Laplacian of Gaussian Algorithm
Figure 5. Images Processed by Canny Algorithm
Figure 6. Images Processed by Quantum Roberts Algorithm
Figure 7. Images Processed by Quantum Sobel Algorithm
Figure 8. Images Processed by Quantum Prewitt Algorithm
Figure 9. Images Processed by Quantum Laplacian of Gaussian Algorithm
Figure 10. Images Processed by Quantum Canny Algorithm
5.
EXPERIMENTAL RESULTSFrom the comparison of Roberts algorithm and Roberts algorithm using quantum enhancement, Prewitt algorithm and Prewitt algorithm using quantum enhancement, Sobel algorithm and Sobel algorithm using quantum enhancement, LoG algorithm and LoG algorithm using quantum enhancement, Canny algorithm and Canny algorithm using quantum enhancement, obtained the result in Table 6.
5.1 Comparison and Analysis Result
Table 6 shows the conclusion of ten algorithms which are compared. From Table 6 it can be seen that more higher the sensitivity value, specificity value is getting higher too. It means that more good and more detail the ability of edge detection algorithm detect true edges, more good and more detail the ability of this algorithm to detect wrong edges too.
Table 6. The Conclusion of Ten Algorithms which are compared
Algorithm TP FP FN TN Se(%) Sp(%)
Roberts 2 2 4 4 33.33 66.66
Quantum
Roberts 1 1 5 5 16.66 83.33
Sobel 2 3 4 4 33.33 57.14
Quantum
Sobel 1 2 4 4 20.00 66.66
Prewitt 3 3 3 3 50.00 50.00
Quantum
Prewitt 2 3 4 4 33.33 57.14
LoG 3 4 2 2 60.00 33.33
Log
Canny 5 5 1 2 83.33 28.57
Quantum
Canny 4 4 1 3 80.00 42.85
5.2 Final Comparison
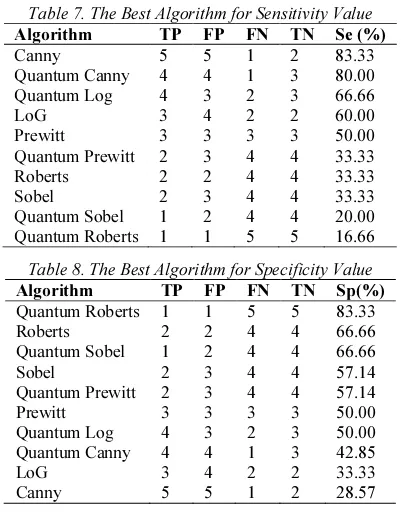
Table 7 shows the result of the best algorithm for sensitivity and Table 8 shows the result of the best algorithm for specificity. The algorithm which has the highest value is the best algorithm which has measured from each parameter. From Table 7 it can be seen that the best algorithm for sensitivity is Canny. From Table 8 it can be seen that the best algorithm for specificity is Roberts algorithm using quantum enhancement.
Table 7. The Best Algorithm for Sensitivity Value Algorithm TP FP FN TN Se (%)
Canny 5 5 1 2 83.33
Quantum Canny 4 4 1 3 80.00
Quantum Log 4 3 2 3 66.66
LoG 3 4 2 2 60.00
Prewitt 3 3 3 3 50.00
Quantum Prewitt 2 3 4 4 33.33
Roberts 2 2 4 4 33.33
Sobel 2 3 4 4 33.33
Quantum Sobel 1 2 4 4 20.00
Quantum Roberts 1 1 5 5 16.66
Table 8. The Best Algorithm for Specificity Value Algorithm TP FP FN TN Sp(%)
Quantum Roberts 1 1 5 5 83.33
Roberts 2 2 4 4 66.66
Quantum Sobel 1 2 4 4 66.66
Sobel 2 3 4 4 57.14
Quantum Prewitt 2 3 4 4 57.14
Prewitt 3 3 3 3 50.00
Quantum Log 4 3 2 3 50.00
Quantum Canny 4 4 1 3 42.85
LoG 3 4 2 2 33.33
Canny 5 5 1 2 28.57
6.
CONCLUSIONIn this research, two X-Ray images processed by edge detection algorithms. Each image is converted into grayscale prior to be processed by twenty edge detection algorithms. These images are compared to determine the best edge detection algorithm for sensitivity and specificity. The quality of edge detection process will be determined through four parameters. These four parameters are true positive, false positive, false negative, and true negative. The value of these parameters can be measured by determined the range value from 1-5. 1 is the lowest value and 5 is the highest value for the criteria of each parameter. These parameters are determined to
measure the value of sensitivity and specificity for ten edge detection algorithms.
From all the comparisons process, the best edge detection method for sensitivity and specificity is known. For the sensitivity, Canny edge detection algorithm without quantum enhancement is the best method with sensitivity value amount 83.33% and for the specificity, Roberts edge detection algorithm using quantum enhancement is the best method with specificity value amount 83.33%.
One of important things from this work is a qualitative evaluation method of quantum enhancement for edge detection of medical images. For the future work we will use the evaluation method for medical images that results from MRI or CT-Scan and also for other types of images.
REFERENCES:
[1] S.N. Maitra and S. K. Bandyopadhyay, “A Novel Edge Detection Algorithm for Digital Mammogram”, International Journal of Information and Communication Technology Research, 2012, pp. 207-215.
[2] H.A.M.D. Omer and K. S. Prasanna, “Image Processing with Matlab Applications in Medicine and Biology”, Taylor and Francis Group, 2009
[3] J.F. Canny, “A Computational Approach to Edge Detection”, IEEE Computer Society Press, 1986, pp. 679-697.
[4] J.M.S. Prewitt, “Object Enhancement and Extraction in Picture Processing and Psychopictorics”, IEEE Transaction on Information Theory, 1970, pp. 75-149.
[5] R.C. Gonzales and R.E. Woods, “Digital Image Processing”, Prentice Hall, 2002.
[6] M. Juneja and P. S. Sandhu, “Performance Evaluation of Edge Detection Techniques for Images in Spatial Domain”, International Journal of Computer Theory and Engineering, 2009, pp. 993-999.
[7] G. Stamatia and S. Tania, “Optimal Edge Detection Using Multiple Operators for Image Understanding”, EURASIP Journal on Advances in Signal Processing, 2011, pp. 28-38, DOI:10.1186/1687-6180-2011-28.
[9] Y.C. Eldar and A.V. Oppenheim, “Quantum Signal Processing”, IEEE Signal Processing Magzine, 19 (6), 2002, pp. 12-32.
[10]X. Fu, M. Ding, Y. Sun and S. Chen, “A new quantum edge detection algorithm for medical images”, MIPPR 2009: Medical Imaging, Parallel Proceesing of Images, and Optimization Techniques, ed. By J. Liu, K. Doi, A. Fenster, S.C. Chen. Proc of SPIE, vol. 7497, 2009, pp. 7497241-7497246. DOI: 10.1117/ 12.832499