90
92
94
96
97
TABEL FREKUENSI
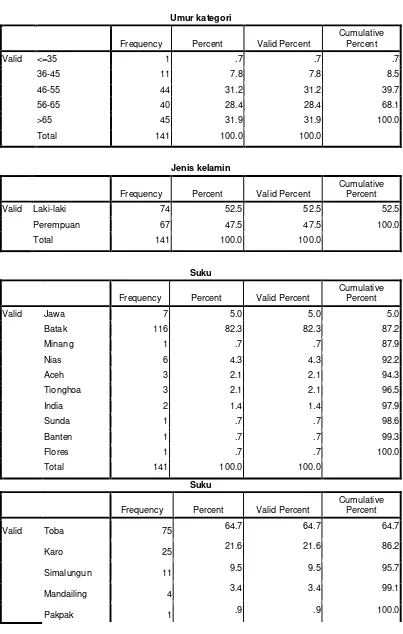
Umur kategori
Frequency Percent Valid Percent
Cumulative
Frequency Percent Valid Percent
Cumulative
Frequency Percent Valid Percent
Cumulative
Frequency Percent Valid Percent
98
Pekerjaan
Frequency Percent Valid Percent
Cumulative
Frequency Percent Valid Percent
Cumulative
Frequency Percent Valid Percent
Cumulative
Frequency Percent Valid Percent
Cumulative Percent Valid Kota Medan 88 62.4 62.4 62.4
Luar Kota Medan 53 37.6 37.6 100.0
Total 141 100.0 100.0
99
Frequency Percent Valid Percent
Cumulative Percent Valid Badan Lemas/Mual dan
Muntah
29 20.6 20.6 20.6
nyeri pada kaki/bengkak/luka
Frequency Percent Valid Percent Cumulative Percent
Valid Ada 84 59.6 59.6 59.6
Tidak Ada 57 40.4 40.4 100.0
Total 141 100.0 100.0
Kadar pemeriksaan HbA1c
Frequency Percent Valid Percent Cumulative Percent
Valid 1 24 28.6 28.6 28.6
2 60 71.4 71.4 100.0
100
Biaya
Frequency Percent Valid Percent
Cumulative
Frequency Percent Valid Percent
Cumulative Percent Valid Obat Hipoglikemik Oral
(OHO)
Frequency Percent Valid Percent
Cumulative Percent Valid Pulang Berobat Jalan 99 70.2 70.2 70.2
Pulang Atas Permintaan Sendiri
32 22.7 22.7 92.9
Meninggal 10 7.1 7.1 100.0
Total 141 100.0 100.0
Descriptives
Statistic Std. Error
Lama rawatan (hari) Mean 6.26 .428
95% Confidence Interval for
Mean
Lower Bound 5.42
Upper Bound 7.11
5% Trimmed Mean 5.75
Median 5.00
Variance 25.809
Std. Deviation 5.080
101
Minimum 1
Maximum 28
Range 27
Interquartile Range 5
Skewness 1.618 .204
Kurtosis 3.146 .406
Crosstabs
Case Processing Summary
Cases
Valid Missing Total
N Percent N Percent N Percent Kategori komplikasi * Umur
analisis
141 100.0% 0 .0% 141 100.0%
Kategori komplikasi * Umur analisis Crosstabulation
Umur analisis
Total <=45 >45
Kategori komplikasi Komplikasi akut Count 1 10 11 % within Kategori
komplikasi
9.1% 90.9% 100.0%
% within Umur analisis 8.3% 7.8% 7.8% % of Total .7% 7.1% 7.8% Komplikasi kronik Count 11 119 130
% within Kategori komplikasi
8.5% 91.5% 100.0%
% within Umur analisis 91.7% 92.2% 92.2% % of Total 7.8% 84.4% 92.2%
Total Count 12 129 141
% within Kategori komplikasi
8.5% 91.5% 100.0%
102
Chi-Square Tests
Value df
Asymp. Sig. (2-sided)
Exact Sig. (2-sided)
Exact Sig. (1-sided) Pearson Chi-Square .005a 1 .943
Continuity Correctionb .000 1 1.000
Likelihood Ratio .005 1 .943
a. 1 cells (25,0%) have expected count less than 5. The minimum expected count is ,94. b. Computed only for a 2x2 table
Case Processing Summary
Cases
Valid Missing Total
N Percent N Percent N Percent Kategori komplikasi * Jenis
kelamin
141 100.0% 0 .0% 141 100.0%
Kategori komplikasi * Jenis kelamin Crosstabulation
Jenis kelamin
Total Laki-laki Perempuan
Kategori komplikasi Komplikasi akut Count 3 8 11 % within Kategori
komplikasi
27.3% 72.7% 100.0%
% within Jenis kelamin 4.1% 11.9% 7.8% % of Total 2.1% 5.7% 7.8% Komplikasi kronik Count 71 59 130
% within Kategori komplikasi
54.6% 45.4% 100.0%
% within Jenis kelamin 95.9% 88.1% 92.2% % of Total 50.4% 41.8% 92.2%
Total Count 74 67 141
% within Kategori komplikasi
52.5% 47.5% 100.0%
% within Jenis kelamin 100.0% 100.0% 100.0% % of Total 52.5% 47.5% 100.0%
103
Chi-Square Tests
Value df
Asymp. Sig. (2-sided)
Exact Sig. (2-sided)
Exact Sig. (1-sided) Pearson Chi-Square 3.040a 1 .081
Continuity Correctionb 2.043 1 .153
Likelihood Ratio 3.120 1 .077
a. 0 cells (,0%) have expected count less than 5. The minimum expected count is 5,23. b. Computed only for a 2x2 table
Case Processing Summary
Cases
Valid Missing Total
N Percent N Percent N Percent Pengobatan * Kategori
komplikasi
141 100.0% 0 .0% 141 100.0%
Pengobatan * Kategori komplikasi Crosstabulation
Kategori komplikasi
Total Komplikasi
akut
Komplikasi kronik Pengobatan Obat Hipoglikemik Oral
(OHO)
Count 8 76 84
% within Pengobatan 9.5% 90.5% 100.0% % within Kategori
komplikasi
72.7% 58.5% 59.6%
% of Total 5.7% 53.9% 59.6%
Insulin Count 2 38 40
% within Pengobatan 5.0% 95.0% 100.0% % within Kategori
komplikasi
18.2% 29.2% 28.4%
% of Total 1.4% 27.0% 28.4% OHO dan Insulin Count 1 16 17 % within Pengobatan 5.9% 94.1% 100.0% % within Kategori
komplikasi
9.1% 12.3% 12.1%
104
Total Count 11 130 141
% within Pengobatan 7.8% 92.2% 100.0% % within Kategori
komplikasi
Linear-by-Linear Association .627 1 .428 N of Valid Cases 141
a. 2 cells (33,3%) have expected count less than 5. The minimum expected count is 1,33.
Case Processing Summary
Cases
Valid Missing Total
N Percent N Percent N Percent keadaan pulang * Kategori
komplikasi
141 100.0% 0 .0% 141 100.0%
keadaan pulang * Kategori komplikasi Crosstabulation
Kategori komplikasi
Total % within keadaan
pulang
6.1% 93.9% 100.0%
% within Kategori komplikasi
54.5% 71.5% 70.2%
% of Total 4.3% 66.0% 70.2% Pulang Atas
Permintaan Sendiri
Count 3 29 32
% within keadaan pulang
9.4% 90.6% 100.0%
% within Kategori komplikasi
27.3% 22.3% 22.7%
% of Total 2.1% 20.6% 22.7%
105
Meninggal Count 2 8 10
% within keadaan pulang
20.0% 80.0% 100.0%
% within Kategori komplikasi
18.2% 6.2% 7.1%
% of Total 1.4% 5.7% 7.1%
Total Count 11 130 141
% within keadaan pulang
7.8% 92.2% 100.0%
% within Kategori komplikasi
Linear-by-Linear Association 2.264 1 .132 N of Valid Cases 141
a. 2 cells (33,3%) have expected count less than 5. The minimum expected count is ,78.
T-Test
Group Statistics
Kategori komplikasi N Mean Std. Deviation Std. Error Mean Lama rawatan (hari) Komplikasi akut 11 5.45 4.865 1.467 Komplikasi kronik 130 6.33 5.110 .448
Independent Samples Test
Levene's Test for Equality of Variances
t-test for Equality of
Means
F Sig. t
Lama rawatan (hari) Equal variances assumed .060 .807 -.548 Equal variances not
assumed
-.571
Independent Samples Test
106
df Sig. (2-tailed) Mean Difference Lama rawatan (hari) Equal variances assumed 139 .585 -.876
Equal variances not assumed
11.946 .578 -.876
Independent Samples Test
t-test for Equality of Means
95% Confidence Interval of the Difference
Std. Error
Difference Lower Upper Lama rawatan (hari) Equal variances assumed 1.599 -4.038 2.286
Equal variances not assumed
1.534 -4.220 2.468
Group Statistics
Biaya analisis N Mean Std. Deviation
Std. Error Mean Lama rawatan (hari) Biaya sendiri 125 6.14 5.005 .448
bukan biaya sendiri 16 7.25 5.710 1.427
Independent Samples Test
Levene's Test for Equality of Variances
t-test for Equality of
Means
F Sig. t
Lama rawatan (hari) Equal variances assumed .882 .349 -.825 Equal variances not
assumed
-.745
Independent Samples Test
t-test for Equality of Means
df Sig. (2-tailed) Mean Difference Lama rawatan (hari) Equal variances assumed 139 .411 -1.114
Equal variances not assumed
18.075 .466 -1.114
107
Independent Samples Test
t-test for Equality of Means
95% Confidence Interval of the Difference
Std. Error
Difference Lower Upper Lama rawatan (hari) Equal variances assumed 1.350 -3.784 1.556
Equal variances not assumed