A New Alternative Indicator for Chronic Energy Deficiency in Women of
Childbearing Age in Indonesia
Ummi Kalsum,
1Bambang Sutrisna,
2Ratna Djuwita,
2Endang L Achadi,
2Abas Basuni Jahari
31Jambi Provincial Health Department, Jambi Province 2Faculty of Public Health, Universitas Indonesia, Jakarta
3National Institute of Health Research and Development, Ministry of Health, Jakarta
Corresponding Address: Ummi Kalsum E-mail: [email protected]
Received: September 17, 2014; Revised: October 30, 2014: Accepted: November 10, 2014.
Abstrak
Latar belakang: Indikator untuk penilaian status gizi pada wanita usia subur (WUS) khususnya untuk mendeteksi risiko Kurang Energi Kronis (KEK) masih sangat terbatas. Saat ini digunakan lingkar lengan atas (LiLA) sebagai alat skrining KEK dan Indeks Massa Tubuh (IMT) untuk penilaian status KEK, namun mempunyai beberapa keterbatasan. Tulisan ini bertujuan mengembangkan indikator baru untuk penilaian KEK pada WUS di Indonesia.
Metode: Disain studi adalah cross sectional. Analisis memakai sebagian data Riset Kesehatan Dasar (Riskesdas) 2013 pada WUS (18-49 tahun) di Kota Makassar dan Kabupaten Tana Toraja Provinsi Sulawesi Selatan sebanyak 1009 orang dan pengumpulan data primer. Analiisis ROC dipergunakan untuk mendapatkan formula dan titik potong optimal dengan IMT < 18,5 sebagai standar baku.
Hasil: Hasil studi menemukan formula yang optimal adalah Rasio LiLA/ÖPLA dengan titik potong < 4,25 untuk mendeteksi KEK pada WUS, lebih baik validitasnya (Sn= 80%; Sp=84%) dibandingkan validitas LiLA < 23,5 cm (Sn= 76%; Sp=87,2%) menggunakan baku emas Indeks Massa Tubuh < 18,5. Prevalensi KEK pada WUS 9,9% (IMT< 18,5); 22,4 % menurut Rasio LiLA/ÖPLA < 4,25. Korelasi antara LiLA-Berat badan r = 0,82; PLA-tinggi badan r = 0,45; LiLA-IMT r = 0,82 dan rasio LiLA/ÖPLA-IMT r = 0,80 (P = 0,000).
Kesimpulan: Rasio LiLA/ÖPLA < 4,25 dapat menjadi alternatif indikator baru yang praktis dan efektif untuk menilai risiko KEK pada WUS (18-49 tahun) di Indonesia. (Health Science Indones 2014;2:-)
Kata kunci: Rasio, LiLA, Panjang lengan, KEK, WUS
Abstract
Background: Indicators for assessment of nutritional status in women of childbearing age (WCA) in
particular to detect the risk of chronic energy deficiency (CED) were limited. Currently, we used mid
upper arm circumference (MUAC) as a screening tool of CED and Body Mass Index (BMI) for CED status assessment, but have some limitations. This paper aims to develop a new indicator for the risk assessment of CED on WCA in Indonesia.
Methods: The design was a cross sectional study. This analysis used a part of National Basic Health Health Research (Riskesdas) 2013 among 1009 WCA (18-49 years) in Makassar and Tana Toraja, South Sulawesi Province. ROC analysis was used to obtain the optimal formula and the cut off point with BMI <18.5 as the gold standard.
Results: The study found that the optimal formula was MUAC/ÖUAL < 4.25 to detect a risk of CED, better validity (Sn = 80%; Sp= 84%) compared to MUAC < 23,5 (Sn = 76%; Sp= 87.2 %) with the gold standard was Body Mass Index (BMI). Prevalence of CED on women of reproductive age 9.9% (BMI <18.5); 22.4% (MUAC/ÖUAL <4.25). Correlation MUAC to weight r = 0.82; UAL to height r = 0.45; MUAC to BMI r = 0.82 and ratio of MUAC/ÖUAL to BMI r = 0.80 (P = 0.000).
Conclusion: The ratio of MUAC/ÖUAL < 4.25 can be new alternative indicator that simple and effective for detecting CED on WCA (18-49 years) in Indonesia. (Health Science Indones 2014;2:-)
There were many women of childbearing age (WCA) who suffer malnutrition, especially chronic energy
deficiency (CED). WCA or pregnant women who
suffer from CED have a greater risk of morbidity and the risk of having a low birth weight (LBW) baby, death during childbirth, bleeding and postpartum
were difficult because of weak and prone to health
problems.1 In developed countries the prevalence of
CED on WCA is already low, whereas in developing countries is still high. In Indonesia, in 2007 13.6% WCA (15-45 years old) had at risk of CED,2 which
increased to 20.8% in 2013. [3] In South of Sulawesi province, WCA at risk of CED were 16.5% (2007),2
increased to 25.1% in non-pregnant WCA and 31.2% in pregnant WCA (2013).3
Body Mass Index (BMI) is used for adult nutritional status assessment, which CED status measured by BMI <18.5. BMI is currently considered the best indicator for the assessment of nutritional status of adults because it uses two indicators of growth, namely body weight (a measure of the growth of tissue mass) and height (a measure of linear growth). But BMI have several limitations: less practical because using two items i.e. scale and the height measurement (stadiometer) so it is relatively expensive, can not be applied to infants, children, adolescents, pregnant women and the elderly and also people who have constraints to stand as do not have legs, paralysis, people are bedridden or a hunchback. Therefore, the coverage of nutritional status assessment was limited and the numbers of CED that recorded or reported today tend to be lower than the real number in community (underestimate and underreported).
Currently in Indonesia, risk of CED assessment on WCA is the mid of upper arm circumference (MUAC) <23.5 cm.4 MUAC is an indicator that
simple, inexpensive, practical and easy to do by staff who are not professional such as cadres.5-6 MUAC
relatively stable, and often used as an indicator of prepregnancy nutritional status. MUAC can be used to measure the approximate of muscle of upper arm and subcutaneous fat thickness estimate, so as to estimate a person’s weight.7 Some studies found that MUAC
were closely related to body weight and can be used as a predictor of body weight in fetal, children, adults, and even in the elderly.8-9 However, the MUAC alone
is still not comprehensively describe the nutritional status (because a single indicator). MUAC has been developed in combination with other indices (called “QUAC Stick”) including MUAC/height. Validity of MUAC/height is better than using MUAC only,10 but
MUAC/height have the same constraints to BMI.
We know that the measurement of MUAC is the length of upper arm (from the elbow to the limit point of the arm bone at the base of the shoulder) as a central point for placing tape of MUAC. The length of the upper arm need to measure MUAC, but never used as one of alternative to estimate the parameters of height. Whereas in the studies of forensic, length of hand or upper arm length are often used as estimator to a person’s height.11-12 and shown have a
strong correlation.
The purpose of this study was to develop a new tool that practical and simple but effective to assess the risk of CED at WCA (18-49 years) in Indonesia.
METHODS
This study used a part of data of a cross sectional study of National Basic Health Research (Riskesdas) 2013. The population in the Riskesdas 2013 were all households, Riskesdas households sample were selected based on the Population Census listing (SP) 2010.Household selection process was determined by the Central Bureau of Statistics (BPS) that provided a list of selected census building from selected census blocks (CB) by the technique of probability proportional to size (PPS).From each selected CB were selected 25 of households randomly, and from each selected household, all household members as individual samples.
The samples consisted of women in South of Sulawesi in 553 CB, 13639 households and 47839 individual household members3
For this analysis the subjects consisted of women in Makassar and Tana Toraja (South Sulawesi Province) aged 18-49 years, not pregnant, willing to be participant in this study. Those who had complete data were 1009 women from 1171 WCA consisted of 844 persons in Makassar and 327 persons in Tana Toraja.
The variables used anthropometric data (weight, height and mid upper arm circumference (MUAC). In this study, the upper arm length (UAL) measurements as additional variable was performed in conjunction with data collection process of Riskesdas 2013 during the months of May-July 2013.
length of the fixed objects. Body weight was measured
using digital scales brand FESCO to the nearest 0.1 kg, were calibrated every day before data collection. Scales have tested the reliability and stability by weighing 610 peoples and proved more stable than others. MUAC and upper arm length measurement performed using
fiber glass tape to the nearest 0.1 cm.
Data collection was performed by 45 enumerators (30 enumerators in Makassar and 15 in Tana Toraja). Enumerators had minimum Diploma 3 in health (environmental health, nutrition, nurse, midwife, health analyst,or public health). Enumerators had structured training before data collection process for 10 days in
Makassar. They worked within a team of five peoples
and each team had a chairman who was responsible for their team. The team leader coordinated each day with their technical managers in their District/City.
Anthropometric measurement reliability test had been conducted on 9 enumerators to one standard gauge. Nine enumerators were represent each team conducting data collection of Riskesdas 2013 in Makassar and Tana Toraja. Anthropometric measurements conducted on 30 women in two of census blocks in Makassar. Anthropometric measurements were performed twice by each enumerator for each subject, to assess the agreement of inter and intra-reader to these anthropometric measurements.
In this study, the validity of the new indicator used body mass index (BMI) as the gold standard. It was calculated based on body weight (kg) divided by height (m) squared.
Chronic Energy Deficiency (CED) status using BMI
<18.5 while a BMI 18.5 or over as not CED, and the risk of CED if MUAC < 23.5 cm.
The upper arm circumference (MUAC) was measurements taken with tape wrapped at the midpoint between the base of shoulder (acromnion) to the elbow (olecranon) in cm; (not CED if MUAC > = 23.5 cm and CED if MUAC <23.5 cm). MUAC was a proxy for a person’s weight that assessed their correlation with body weight and BMI.
The upper arm length (UAL) was the length of the base of the shoulder and to the elbow using MUAC tape (in cm). This measure was obtained from one of the stages of MUAC measurement. This size was associated with height.
The MUAC/ÖUAL were developed using a combination of MUAC index to the upper arm length to detect the risk of CED. This formula was chosen to assess the validity of the optimal formula among 18 alternatives were tested.
The analysis used STATA version 11.0. Receiver operating characteristic (ROC) curve was used to
define the optimal cut point and formula based on the assessment of sensitivity and specificity. Spearman’s
correlation to determine the strength and direction of relationships between anthropometric indices. Colton was divided the strength of relationship between two variables (r = 0.00 to 0.25: there is no or weak relationship; r = 0.26 to 0.50: medium relationships; r = 0.51 to 0.75: strong relationship; and r = 0.76 to 1.00: very strong or perfect relationship).
Pittman and Kappa Cohen’s test and Bland Altman plots to assess the agreement between the indicator and the reliability of intra-and inter-reader.Statistic
significance level was P <0.05.
Approval for this study was obtained from the Health Research Ethics Committee at the Indonesian Ministry of Health and the Research Ethics Committe, Public Health Faculty University of Indonesia.
RESULTS
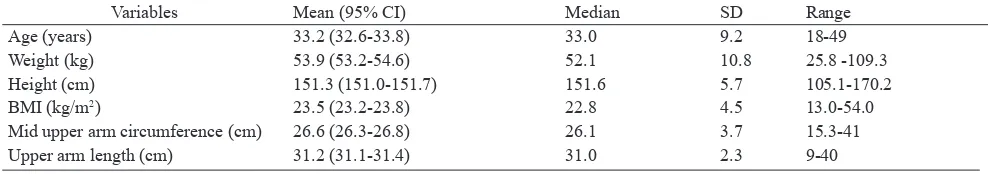
Table 1 shows that women being subject in this study were aged in young adults (proportion of women aged <= 35 years ± 57%), with an average body weight 53.9 kg, height 151.3 cm, and BMI was 23.5 on average, the average size of MUAC 26.6 cm and the average of upper arm length (UAL) was 31.2 cm.
Table 1. Numerical conclusions from anthropometric variables
Variables Mean (95% CI) Median SD Range
Age (years) 33.2 (32.6-33.8) 33.0 9.2 18-49
Weight (kg) 53.9 (53.2-54.6) 52.1 10.8 25.8 -109.3
Height (cm) 151.3 (151.0-151.7) 151.6 5.7 105.1-170.2
BMI (kg/m2) 23.5 (23.2-23.8) 22.8 4.5 13.0-54.0
Mid upper arm circumference (cm) 26.6 (26.3-26.8) 26.1 3.7 15.3-41
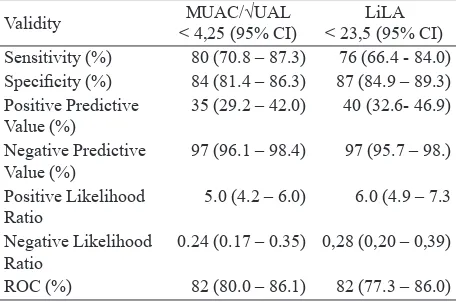
Table 2 shows that the sensitivity of the ratio MUAC/ÖUAL < 4.25 better than MUAC < 23.5 cm to BMI <18.5 as the gold standard. But the other
performance of the validity e.g. specificity, positive
pedictive value (PPV), negative predictive value (NPV), likelihood ratio positive and negative and ROC values were similar between both indicators.
Table 3 shows that the pattern of relationship between the ratio of MUAC/ÖUAL to BMI, MUAC to BMI, MUAC to Weight, had a positive and strongly correlation (r > = 0.8). The more increase the size of MUAC will be followed by the increase in weight and increasing BMI, increased ratio of MUAC/ÖUAL also be followed by increasing BMI. Similarly, the more increase in length of the upper arm would be followed by the increasing women’s height although the r value between the upper arm length (UAL) with height was relatively lower but statistically associated (P = 0.000).
There were variations of the prevalence of CED based on several indicators. Approximately 9.9% women had CED based on BMI<18.5, while the prevalence of CED based on MUAC/ÖUAL < 4.25 were 22.4%. The prevalence of risk of CED according to MUAC < 23.5 cm were 19.0%.
The results of anthropometric measurements of reliability assessment on 9 enumerators at sub-sample Riskesdas 2013 in Makassar were found that there were no variation in measurement of weight, MUAC and UAL both intra-and inter-reader, so there were no inter-reader variation in measurement of height but there were 11% of intra-reader variation in height measurements compared to standard gauge. Measurement agreement of BMI <18.5 and MUAC < 23.5 cm among enumerators showed excellent
Table 2. Comparison of the performance of validity of ratio of MUAC/ÖUAL and MUAC < 23.5 cm
Validity MUAC/√UAL
< 4,25 (95% CI)
LiLA < 23,5 (95% CI) Sensitivity (%) 80 (70.8 – 87.3) 76 (66.4 - 84.0) Specificity (%) 84 (81.4 – 86.3) 87 (84.9 – 89.3) Positive Predictive
Value (%)
35 (29.2 – 42.0) 40 (32.6- 46.9)
Negative Predictive Value (%)
97 (96.1 – 98.4) 97 (95.7 – 98.)
Positive Likelihood Ratio
5.0 (4.2 – 6.0) 6.0 (4.9 – 7.3
Negative Likelihood Ratio
0.24 (0.17 – 0.35) 0,28 (0,20 – 0,39)
ROC (%) 82 (80.0 – 86.1) 82 (77.3 – 86.0)
results (Kappa = 1 on BMI and between 0.9 to 1.0 on MUAC < 23.5 cm), the data were not shown.
DISCUSSION
Tool to assess nutritional status of WCA is still limited, especially on pregnant women. Moreover, BMI can not be applied to pregnant women, while the assessment of nutritional status during pregnancy is important to prevent mother’s health problems and also has an impact to outcome of pregnancy. There has never been a study that examined the possibility of developing new indicators as an alternative to BMI by using the same concept with a BMI (wasting) using the ratio of MUAC to upper arm length (UAL) in any country. Therefore, this study has a novelty that needs to be further developed and revalidation.
It is necessary to assess the validity of the new tool compared to a gold standard to develop a new tool. The main elements of validity are sensitivity and
specificity. Sensitivity (Sn) is the ability of the tool to find those who suffer from the disease, while specificity (Sp) is the ability of the tool to find those
who do not suffer from the disease.
This study found that the ratio of MUAC/ÖUAL <4.25 have the most optimal validity. Ability of ratio of MUAC/ÖUAL in detecting CED as really
CED using BMI was 80%. While the ability to find
a healthy woman (do not have the risk of CED) according to the ratio of MUAC/ÖUAL was really not the CED using the gold standard was 84%. This indicator had shown a good performance because the value of Sn and Sp were more than 70%.14
This new indicator is more sensitive than the MUAC <23.5 cm, although not too much difference. The high sensitivity is required in a diagnostic tool for detecting cases that have a serious impact, while the
high specificity is required if the treatment or care
for the cases have a high risk. [15] CED have serious consequences for WCA if not detected early, to the pregnancy’s outcome, also impact on morbidity
Table 3. The relationship between Antrophometry indices
Indicators r- value r2 P
MUAC and weight 0.82 0.67 0.000
UAL and height 0.45 0.20 0.000
MUAC and BMI 0.82 0.67 0.000
and mortality both in the WCA and fetus,2 (but the
prevention or treatment of CED do not harm, even
its likely give the benefit for women because the
interventions of CED are supplementary feeding for 90 days), so that more sensitive tool is better for detecting the risk of CED. This is consistent with Sutrisna’s statement : “when the test is used for
case finding in order to get the treatment, then the
test with high sensitivity is more appropriate to use
although specificity is sacrificed.13
However, when disease prevalence is low and there is no intention to ascertainment of the diagnosis,
using the test that have a high specificity but lower
sensitivity is more appropriate. [13] This is consistent with the purpose of developing the new indicator using Ratio of MUAC/ÖUAL as alternative effective and simple new tool for assessing the risk of CED on WCA.
In this study, the prevalence of CED was low according to BMI (9.9%), while according to the ratio of MUAC/ÖUAL, the prevalence was higher (22.4%). It caused of the limitations of BMI in detecting CED status in the short mother. The short mothers with weight proportional to height, detected as non CED by BMI. Whereas women in Indonesia are still quite a lot of short (stunted). In this study population the proportion of women who had a height <150 cm was 39%, while the mother is short (<150 cm) based on National Health Survey (Riskesdas) 2013 was 31.3% 3 The short mothers (<150 cm) have
a high risk to CED. So we can say that the ratio of MUAC/ÖUAL can illustrate the CED problems that do exist in the population.
This is corroborated by the finding that the relationship
between the length of the upper arm to height was
medium (r = 0.45) but significant. Although the
relationship of the upper arm length to height in this study was slightly lower than that found by Tugcu et al. (2006) in Turkey,12 and Ahmed (2013) in Sudan,11
respectively r = 0.66 and r = 0.643. However, the same association was found with previous studies
that found a positive significant relationship pattern
that the higher a person’s stature is followed by the length of the upper arm (humerus), and vice versa.
The relationship between upper arm length to body height which not very strong can illustrates that the upper arm length is relatively independent to the height. BMI is a complex measure, but it is not sensitive to body composition. The short mothers can not be captured by BMI, especially when having a proportional weight to her height so not detected
as CED by BMI, when in fact they have problem of chronic malnutrition (CED). Ratio of MUAC/ÖUAL can precisely identify it. The role of the upper arm length is more visible in identifying CED on short mother. However, it is necessary to validate this new indicator with further research using gold standard BIA (Bio Impedance Analysis) as a tool that can see a person’s body composition.
The concept of BMI is indicative of wasting when low weight associated with decreased soft tissue mass. Either BMI or Ratio of MUAC/ÖUAL are using the same concept of assessing thinness or wasting that can be intervened immediately with recovery supplementary feeding. The concept of wasting is actually considering body proportions, because relatively to height (a measure of linear growth).
Body height component consists of the upper limb (head, neck and trunk) and lower extremities (pelvis and legs). The growth of the trunk and extremities have a certain period of growth. There is a difference in height composition according to a certain race or ethnicity.
In general, the racial difference in the upper and lower segments have known. Blacks have longer legs and a shorter trunk than whites.16 Asians have longer trunk
and shorter legs than the white race, Hispanics have the same body proportions as the white race, but shorter. Among the various populations there were relative leg length differences. Differences in leg length usually found in various surveys, especially when weight is associated with height (IMT concept) in order to indicative obese or underweight. IMT will be more likely to detect a person’s as overweight or obese when have a short legs, or detect a person thin or underweight when have a long legs.17 This is one of
the weaknesses and limitations of BMI, that BMI have less sensitivite to the proportion of a person’s body.
In this new indicator, used the upper arm length that proved empirically associated with height. The upper arm length is part of the upper extremity which the proportions of the upper extremity are relatively stable from birth to adulthood on a person’s height, about 10%. 18 Similarly, the length of the trunk or
Although there were differences in the proportion of length of vertebral or length of lower extremity to height in the various races in the world, but for Indonesian people, the proportion or composition of the vertebra or the lower extremities were relatively similar among ethnic groups in Indonesia. It is expected, result of this study can be applied as a new alternative indicator on WCA nutritional status in Indonesia and so to the ethnic that have same of body proportions and composition, namely the Malays or not Malays ethnic but have similar body composition.
As a diagnostic tool for assessing the risk of CED
(case finding), the indicator of ratio MUAC/ÖUAL
have good validity. However, caution is required in its application to the community, because it still requires some revalidation in several different populations in further study.
The ratio of MUAC/ÖUAL meet the “FACE” criteria;19 “fast” (fast measurement because simple
and practical), “accurate” (validity and reliability have proven good), “convinience” (no additional measurement, because the same measurements
with MUAC), “ethics/effective/efficient” (meet the
criteria and does not violate the ethical propriety,
effective and efficient because using only one
tool which cheap and easy to use and can be done anywhere, with maximum results).
In conclusion, the ratio of MUAC/ÖUAL <4.25 can be a new alternative indicator that practical, simple but effective to detect the risk of CED on WCA (18-49 years) in Indonesia.
Acknowledgments
The Authors wish to express their sincerest gratitude to The National Institute of Health Research and Development, Ministry of Health Republic of Indonesia for the approval to use the datasets, particularly to the Laboratory of Data Management. Special thanks to Prof. Bastaman Basuki, Prof Agus Suwandono and their team for technical assistant during preparation of this paper.
REFERENCES
1. Adriani M, Wirjatmadi B. The role of nutrition in the life cycle. Jakarta: Kencana Prenada Media Group; 2012. 2. Departemen of Health of Indonesia. Report of
national basic health research year 2007. Jakarta: The Departemen; 2008.
3. Ministry of Health of Indonesia. Report of national basic health research year 2013. Jakarta : The Ministry; 2014.
4. Departement of Health of Indonesia. Guidelines for the use of measuring tools upper arm circumference (UAC) in women of childbearing age. Jakarta: The Departement y; 1999.
5. Krasovec K, Anderson MA. Maternal nutrition and pregnancy outcome. Washington DC: PAHO Library; 1991.
6. Ariyani DE, Achadi EL, Irawati A. Validity mid-upper arm circumference to detect chronic energy
deficiency malnutrition risk of Indonesian women. J
National Public Health. 2012;7:83-90.
7. Almatsier S, Soetardjo S, Soekarti M. Balanced nutrition in life cycle. Jakarta: Gramedia Pustaka Utama; 2011.
8. Liang RI, Chang FM, Yao BL et al. Predicting birth weight by fetal upper-arm volume with use of three-dimensional ultrasonography. American J Obstetric Gynecology. 1997;177:632-8 [cited 2013 August 24]. Available from: http://www.scopus.com.
9. Cattermole GN, Leung PYM, Mak PSK, et al. Mid-arm circumference can be used to estimate children’s weights. Resuscitation. 2010;81:1105-1110. [cited 2013 July 17]. Available from: http://www.elsevier. com/locate/resuscitation.
10. Gibson RS. Principles of nutritional assessement. 2nd edition. New York: Oxford Univ Press; 2005.
11. Ahmed AA. Estimation of stature from the upper limb measurement of Sudanese adults. Forensic Science International. 2013;228:178.e1-178.e7 [cited 2013 August 19]. Available from: http://www.elsevier.com/ locate/forsciint.
12. Tugcu H, Ozaslan A, Koc S, et al. Estimation of stature from upper extremity. Military Medicine. 2006;171:288-91 [cited 2013 August 19]. Available from: http:// www.proquest.com.
13. Sutrisna B. Introduction to method of epidemiology. Jakarta: PT. Dian Rakyat; 2010.
14. Waspadji S. Nutritional status assessment, epidemiology studies. Jakarta: Universitas Indonesia; 2003.
15. Park SH, Goo JM, Jo CH.. Receiver operating characteristic (ROC) curve : practical review for Radiologist. Korean J Radiology. 2004;5:11-18 [cited 2013 September 02]. Available from: http://www. scholar.google.com.
16. Wagner DR, Heyward VH. Measures of body composition in blacks and whites : a comparative review. American J Clinical Nutrition. 2000;71:1392-1402. [cited 2013 October 4]. Available from: http:// www.ajcn.nutrition.org.
17. Jelliffe DB, Jelliffe EFP. Nutrition and growth. New York: Plenum Press; 1979.
18. Sinclair D. Human growth after birth. 4th edition. Oxford: Oxford University Press; 1986.