Haptical feeling of rotary switches
J ö r g R e i s i n g e r1, J ö r g W i l d2 G e r h a r d M a u t e r H e i n e r B u b b3 H e i l b r o n n U n i v e r s i t y
A u t o m o t i v e C o m p e t e n c e C e n t e r
A u d i A G, I n g o l s t a d t Te c h n i s c h e U n i v e r s i t ä t M ü n c h e n L e h r s t u h l f ü r E r g o n o m i e
ABSTRACT
It is a general standard in the description of the haptical charac-terization of rotary switches to plot the torque vs. angle. This graphical description is originated in the available measurement technology: the availability of torque and position sensors. However, it does not consider the human perception as it cannot describe the intuitively perceived characteristics. Therefore most people, except those with a lot of experience, are not able to create a realistic haptical interpretation of the torque-characteristic. The question that should be answered by this research project is: what feedback does the user of a rotary switch feel intuitively?
Previously we used different ways in order to describe the haptical characteristic. We found a main hypothesis that the description of the used up energy plotted vs. angle shows a much better intuitive representation than the description of plot-ted torque vs. angle. We staplot-ted four additional hypotheses to test this main hypothesis. These are the rest position, the similarity and the amplitude of sinusoidal and triangular shape and the asymmetry of shapes.
In order to evaluate these hypotheses, tests with subjects are made. We use a rotary haptical simulator, by which the re-quested parameters can be changed. The whole test runs auto-matically and the subject controls the duration of the single tests by himself.
Two basic principles are used for the tests: In the first case two haptical characteristics are compared. The applied method is the interpretation of the yes-no answers to the question if the characteristics are equal. In the second case the subjects have the task to assign the haptical feeling to one of the graphic represen-tations. The hypotheses are confirmed with 25 subjects on 80 single tests each. Clear tendencies can be found that confirm the hypothesis in each test without any contradiction.
The test is also designed to give answers about the just noticeable difference of haptical discrimination in connec-tion with rotary switches. Furthermore it can be shown that the just noticeable difference is independent of the shape of the torque characteristics.
K e y w o r d s : Haptic, Rotary Switch, Rotary Encoder, Haptical Description, Torque Perception, Torque Detection, Haptic Inter-face, Just Noticeable Difference, Psychophysics
1 INTRODUCTION
For the haptical description of rotary switches the spatial plot of torque vs. angle is the industrial standard. There is one big question in the design of rotary switches:
How has this torque characteristic to look like to get a favored haptical feeling? This knowledge is essential to get the haptical
design of switches for an intended purpose.
Our research focuses on this question. The haptical interpretation of the common torque vs. angle curve has hard specific problems. These problems can only be solved with a lot of experience and knowledge. In [1] we described these problems in detail and showed an alternative way towards a correct haptical interpretation. This paper describes shortly the common problems of the torque characteristics, an alternative description theory and their evaluation with tests in detail, as well as we have a look at the identification of just noticeable differences (JND) comparing rotary switches.
2 GENERAL PROBLEMS WITH THE TORQUE CHARACTERISTICS
As mentioned before, the usual way to describe rotary-switch characteristics is plotted torque vs. angle. This way to describe switches has its roots in the availability of measurement technologies. Torque or force sensors and also spatial sensors for displacement are available. It requires additional mathematical operations to get other units like speed, energy or power. It suggests itself that the first step would be using the given units for a characterization instead of any other. We do the second step.
Our approach uses a plot of energy vs. angle. It can be interpreted with a topological shape which is generating the torque-profile idealized by differentiation. So this can be mathematically described with an integration of the torque against the angle as shown in (1). This energy E is necessary to get from position ϕ1 to position ϕ2.
The following paragraphs describe the mentioned problems with the torque-characteristics and their behavior using the energy characteristics.
ϕ
ϕ
ϕ
d
M
E
=
∫
2
1
(1)
2.1 Rest position
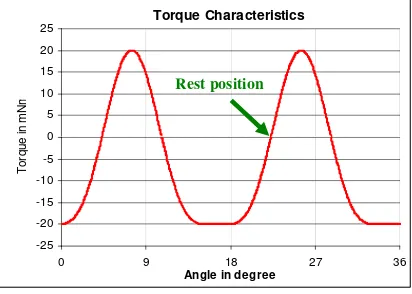
The first obvious problem is the rest position. It is usually identified at the bottom of the characteristic curves (see figure 1). Meanwhile the torque characteristic’s rest position is usually in the middle of the characteristic curves when passing the zero value as shown in figure 1.
1 e-mail: [email protected]
2 e-mail: [email protected]
Contrary to expectations no difference in shape is felt, only the amplitude seems to be smaller on the triangular curve. This could be seen as low pass behavior or a Fourier series effect, but the rest position and the asymmetric shapes (see 2.3 below) would not fit into this theory.
Torque characteristics
The energy characteristic, as shown in figure 4, provides a different view.
Energy of sinusoidal shape Energy of triangular shape
expected rest position
Figure 1: Rest position problem in the torque characteristics.
This is a correct engineering description because the zero torque is needed for a stable rest position, but it does not fit human perception.
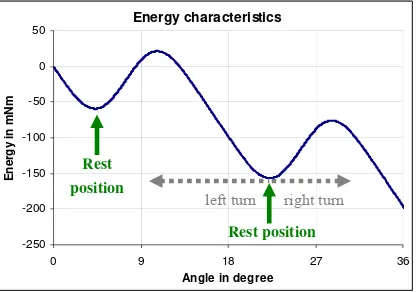
The energy characteristics have both expected and real rest positions in the same position (see figure 2).
Figure 4: sine and triangular shape in the energy characteristics Energy characteristics
The result of the integration of the triangular shape as shown in figure 3(b) is a parabolic energy characteristic, with a very high similarity to a sinusoidal shape. Furthermore it can be seen that the maximum amplitude of the triangular energy shape is about 21 % smaller than the sine. A reduction of the sinusoidal shapes maximum torque of about 21% can compensate for this effect.
real = expected rest position
2.3 Asymmetrical shape
The third problem is the use of curves which are not symmetrical to the rest position. Applying such shapes causes, for example, that a right turn is moving more easily than a left turn. Subjects expected a symmetric behavior in each direction. Figure 5 shows such an asymmetric shape.
Figure 2: Rest position in the energy characteristics
Torque Characteristics
2.2 Similarity of sinusoidal and triangular shapes
The second problem is a strong haptical similarity of sinusoidal and triangular torque-shapes as shown in figure 3. The haptical
perception is very similar while the graphics differ a lot. Rest position
Torque characteristics
Sinusoidal shape Triangular shape
Figure 5: Asymmetric shape of the torque characteristics
The more useful diagram is once more the energy characteristics as shown in figure 6. Here it can be easily imagined that a right turn is more easily performed than a left turn. It can be interpreted as a topology with a hill and a mass that should be moved.
Figure 3: Sinusoidal (a) and triangular (b) torque shape.
Energy characteristics
-250 -200 -150 -100 -50 0 50
0 9 18 27 36
Angle in degree
E
n
e
rg
y
in
m
N
m
3.2 Main hypothesis
The main hypothesis means that the energy characteristic is more intuitive than the torque characteristic if significantly more subjects assign the haptical perception to the energy shape than to the torque shape. For this main hypothesis the method of assigning haptical perception to graphical description is suitable.
Rest position
left turn right turn
Figure 6: Shape of the energy characteristics
3 TESTING HYPOTHESES
The previously described theory is tested with a set of hypotheses basing on the described problems. The following paragraphs describe these hypotheses and the used testing methods.
3.1 Used test methods
For the recent tests we are using the method of paired comparison with the interpretation of yes-no answers and a method of assigning haptical perception to graphical description.
3.1.1 Method of paired comparison (I)
The first test uses the method of paired comparison. Two characteristics are applied to the haptical simulator. The focus lies on the haptical differences, i.e. the subjects have to decide if two applied haptical characteristics are the same or not. Their decisions in form of ‘yes’ and ‘no’ answers are documented. The applied characteristics change in shape and maximum torque level.
The occurrences of the yes-no answers plotted vs. relative differences are the basic principle for the interpretation. The functionality of these methods is previewed in [1].
3.1.2 Method of graphical assignment (II)
The second test uses the assignment between haptical perception and graphical description.
A haptical shape is applied to the simulator. This applied haptical shape then has to be assigned to one out of six graphical shapes. The selection contains both torque and energy shape. To prevent any influences, the axes in the graphics are not labeled.
The occurrences of each graphic selection are the values for this principle of interpretation.
3.1.3 Drawing the stopping point in an existing graphical
description (III)
In this test the subject has to locate the rest position in a prepared graphical shape. The occurrences of located rest positions are the basis of this interpretation.
3.3 Sub hypotheses
Rest position
The main hypothesis can be split up into four sub hypotheses that support the main hypothesis if they are all valid or not opposite. So the main hypothesis is supported if the following cases are fulfilled:
3.3.1 Rest position (compare 2.1)
– If significantly more subjects locate the rest position in the bottom of the graphical description than in the middle of it. Principle (III) is useful for this test.
3.3.2 Similarity of sinusoidal and triangular curves (2.2)
This similarity offers three sub hypotheses.
– If significantly more subjects assign a triangular haptical characteristic to a sinusoidal rather than to a triangular graphical shape.
– If significantly more subjects identify sinusoidal and triangular haptical characteristics as equal.
– If there is the significant maximum occurrences of the relative difference of the maximum torque between sinusoidal and triangular shapes lays shifted to the right around 21%.
For the test of these principles both the method of paired comparison (I) and the method of graphical assignment (II) are suitable.
3.3.3 Asymmetric curve (2.3)
– If significantly more subjects assign a falling shape (compare the energy characteristic, similar to the main hypothesis), the method of graphical assignment (II) is suitable.
4 EQUIPMENT
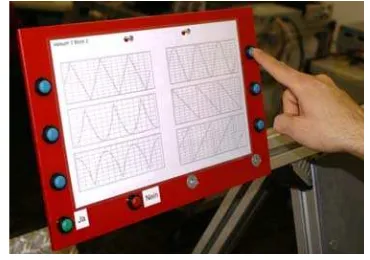
Figure 7 shows the haptical display we used for these tests.
It is a single degree of freedom device, designed for haptical research on rotary switches in our laboratory (see [1]). We use an aluminum knob with a diameter of 35.5 mm. For this test two characteristics can be changed via a toggle switch by the subject himself. Actually a set of 16 different haptical characteristics can be stored to the simulator. During the whole test different sets are load to the simulator.
As a base for the tests we use a seat box where the simulator is built-in and also the keypad for the recording of the answers is mounted. The design of the seat box is oriented at the working place of a car-driver as shown in figure 8a.
The simulator is mounted in the centre console of the seat box obviating special haptical expectations caused by its size. Thus only the knob is visible for the subjects. Moreover the console is covering the simulator avoiding acoustical influence to the subject as shown in figure 8b.
Figure 8: Test setup with the seat box (a) and the integrated rotary haptical simulator with toggle switch for changing the haptical
characteristics by the subject (b).
As shown in figure 8b the toggle switch is located next to the simulator knob. The LED’s next to it indicate the subject if the test can be continued.
Figure 9: Input field for the recording of the answers.
The keypad consists of eight push buttons (see figure 9). There are two buttons in green (yes) and red (no) color for answering the first test. Six additional blue buttons are also mounted on the keypad. They are used for the assignment to
graphics in the second test. A program based on the National Instruments’ Labview controls the whole setup (simulator and documentation). The tests are designed in an Excel-sheet and the answers of each subject are documented in a separate copy of this sheet. The summarization of all single tests is made by a second software tool.
5 PARTICIPANTS
25 participants take part in the experiment. The group consists of subjects with professions like economic and technical students, employees, housewives and workers and is not especially selected.
The subjects have to fill in a questionnaire with personal questions about sex, handedness, age, profession, hobbies, sports, music instruments, driven car and earlier contact with haptical design. A presentation leads the participant to the topic and furthermore shows him step by step the tasks he has to fulfill. This has to be done very carefully to prevent influence on the results. The subjects are requested to play with the knob intensively: to turn left and right, slow and fast. They can control the duration of the test themselves and can switch between the two applied characteristics as often as they like.
Keypad for the subject’s answers (a)
5.1 Order of the tests
supervisor Seat box with
integrated rotary simulator
One question that should be answered of this research project was: what feedback does the user of a rotary switch feel intuitively? Therefore it is important to know about previous haptical knowledge of the subjects and rather obviate influencing information.
(b)
Toggle switch and LED display
Thus the order of the tests plays an important role: The subjects are confronted with the graphical description as late as possible.
The test starts up with the paired comparison of haptical characteristics.
Knob of the rotary haptical simulator
After this the participants are led to the comparison of haptical perception with graphical description. Therefore they are called upon drawing their haptical percept. Previous tests have shown that this kind of test will not lead to a result, but it is useful for getting familiar with the following tasks (see [1]).
In the following task the subjects have to do the haptical assignment to one out of six graphs. Here the first usual characteristics appear, but without clear definition.
In the final task the subjects see the same characteristics as haptically applied to the simulator. Now they have to locate the rest position in the graph.
6 EXPERIMENT 1: HAPTICAL ASSIGNMENT TO A GRAPHICAL DESCRIPTION (3.1.2)
In this experiment the subjects have to assign the haptical impression to one out of six graphical shapes as seen in Figure 9. The shapes have just a qualitative not a quantitative character. In previous tests the ability of subjects was tested to see if they were able to fulfill this task ([1]).
The test is designed to give answers about the in 3.2 and 3.3 described hypotheses: the main hypothesis, the similarity of sinusoidal and triangular curves and the asymmetric shapes.
6.1 Main hypothesis
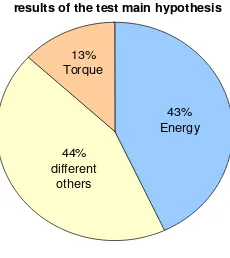
results of the test main hypothesis
Table 2: Results of experiment 1c: Percentage of selections of the asymmetric shape.
Figure 10: Results of experiment 1a: Percentage of selections and ranges in the single tests.
Table 1: Results of experiment 1: Percentage of selections and ranges in the single tests.
Shape Percentage
of selections
It can be seen clearly that the energy shape is the most commonly selected group. The consistency of the remaining group can be seen clearly in the range of the selections. There is only a maximum selection of 28% while the energy shape is selected in each single test from 32% up to 62%. Comparing the range of the torque shape with the range of the remaining selections shows nearly no difference: this means that other shapes are selected as often as the torque shapes. It shows clearly that the torque shape is selected randomly like the other shapes.
This distribution shows a test of χ2 = 20,167 which results in a very high statistical significance value (SPSS: 0,000%).
6.2 Similarity of sinusoidal and triangular curves (2.2 and 3.3.2)
This test is a subset of the main hypothesis; anyway we have a closer look at it. When a triangular torque-characteristic is applied to the subject, most of them identify a sinusoidal or very similar parabolic shape (56%). Only 8% of the subjects identify the torque shape. Thereby other shapes are identified in the same range (0% to 16%).
6.3 Asymmetric shape (2.3. and 3.3.3)
This subset needs some more interpretation because the selections are not made so clearly.
Table 2 shows: the energy shape is once again identified in 32%. The shape of the “falling ramp” is selected in 24% and also 28% select the “integrated falling saw tooth” shape. This shows that it is very difficult for the subjects to fulfill this task in this special case. The torque shape is only selected by 8% - clearly the least selected.
For a more clear interpretation we determine the general trend of the shapes: The “falling saw tooth” shape is also falling off, similar to the energy shape. The wide bottom of the “integrated falling saw tooth” shape has more similarity to the torque shape for we decide to put these in another group. Even if these values are not the real shapes they can partly explain their huge rate in the table.
We receive a sum of 56% for the “extended” energy and 36% for the “extended” torque characteristics. This supports the basic trend.
6.4 Location of the rest position (2.1 and 3.3.1)
The location of the rest position is an additional test with the goal to find the preferred location of the rest position: at the bottom of the shape for the energy characteristic and in the middle of the curve for the torque characteristic (compare figure 1). The subjects can feel a sinusoidal characteristic (sine, because energy and torque shape are nearly the same) and have to draw the rest position into the graph.
The result of the test shows, at 49% for the energy characteristic, also a clear tendency supporting the main hypothesis.
7 EXPERIMENT 2: METHOD OF PAIRED HAPTICAL COMPARISON (3.1.1)
This test uses the method of paired haptical comparison in a special way: The haptical perception of a rotary switch is a multidimensional problem, i.e. changes in, for example, ‘shape’ cannot be described with one single adjective. Therefore we limit these variations on the basic shape and in the amplitude. In this case a comparison method (equal or different) as described in [2], [3] or [4] is used.
The high number of possible variations requires further restrictions: We use different basic shapes like sine, triangle, rising and falling saw tooth and asymmetric sine. These shapes are applied haptically to the subjects. We use two torque amplitudes as basic values for the tests. Based on these, percentage variations of the torque amplitude are applied.
The subjects’ task is to differentiate if the two applied haptical characteristics are the same or not (yes-no answer).
7.1 Basic description and just noticeable difference
The following hypotheses can be evaluated with this test: (I) sine-triangle similarity and (II) sine-triangle amplitude-difference. Additionally the just noticeable differences of rotary switches are in focus.
For this test the relative difference of the maximum torque of the curves is chosen for the abscissa. The maximum torque of each pairing is the reference magnitude. The mathematical definition to calculate the abscissa values xi is shown in (2). The index of a single test is i.
The relative occurrences of the ‘yes’ answers are assigned to the ordinate. Each measuring point contains the answers of 25 subjects.
This setup generates a plot of relative occurrences vs. relative torque difference.
To get more continuity in the graph, additional tests focusing on the existing gaps in the abscissa are made. These
Percentage Shape
of selections
Torque shape (asymmetric sine) 8%
Energy shape (falling sine) 32%
Falling saw tooth shape 24%
Sine shape 8%
additional tests show reproducible results which are added to the existing ones.
Generally all the basic JND functions can be described
with nearly the same parameters. This leads to the conclusion that the basic shape of a haptical characteristic does not influence the just noticeable difference.
Results of the sinusoidal shape experiment
0%
relative difference of the maximum torques
rel
measured values regression function Finally we fit a function of a cumulated Gaussian
distribution into the measured values. The least square fit method is used for this. The error is normalized by dividing by the number of tests. The used equation for the cumulated Gaussian distribution F(x) is shown in (3). The parameters we
use are the amplitude a, the average µ and the standard
deviation σ.
We test three different shapes: (a) a rising saw tooth shape, (b) a sinusoidal shape and (c) a falling saw tooth shape. These shapes show extreme differences in the haptical feeling getting a better haptical quality from (a) to (c). Additionally we compare the sinusoidal and the triangular shape (d). Figure 11 shows the
applied haptical shapes. Figure 12: Results of the test with a falling saw tooth.
Applied haptical shapes
Rising saw tooth shape (a) Sinusoidal shape (b)
Falling saw tooth shape (c) Triangular shape (d)
Figure 11: Applied haptical shapes.
Figure 12 shows, as an example, the results of experiment 2 realized with the falling saw tooth shape.
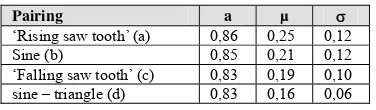
Table 3 shows that the parameters of the Gaussian
distribution (amplitude a, average µ, standard deviation σ). They are very similar for each tested shape. The changes in the
parameters of (a)-(c) are negligibly small and are in the range of measuring errors in this experiment.
The average value can be seen in the way that more than half of the subjects identify differences bigger than 20% of the maximum torque. In other words: if haptical differences have to be felt, the amplitude of the switches will have to differ by more than 20% to be significant for most of the subjects.
Rest position
Another look at the amplitude parameter a shows that there is an error of around 15% in the decision of the subjects. This is of interest because only one shape is applied as a pairing and it is not switched on the simulator during these tests of 0% difference. This effect can be explained with the situation the subjects are in: they concentrate on differences. Thereby big differences will be identified clearly, while no or even small differences cause uncertainty and thus to the appearance of non-existing differences. This is a systematic error. The main question is: how does this error influence the parameters of the results. The answer could be given with the method described in [5] and [6] where the decision has to be made if a property of the first object is bigger or smaller than the same property of the second one. This requires a multidimensional analysis of the haptical differences basing on the estimation with adjectives like ‘more’ or ‘less heavy’ for example.
Table 3: Parameters of the Gaussian distribution, for each tested pairing.
Amplitude a, average µ, standard deviation σ.
7.2 Sinusoidal compared with the triangular shape
To evaluate the sine-triangle similarity and the
sine-triangle amplitude-difference the sinusoidal and the triangular shapes are compared. Any other used combinations of different shapes have no significant correlation.
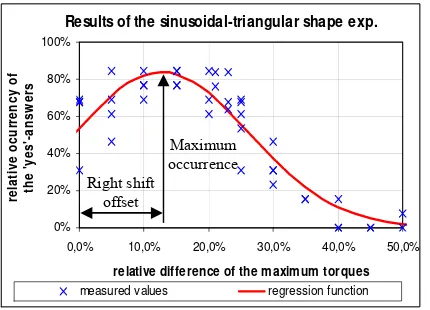
Theoretically the results should show a high conformity to support similarity, but with a maximum occurrence at around 21% to support the amplitude difference. It can be seen clearly in figure 13 that there is the maximum occurrence not in the origin of the graph, but shifted to the right.
The Gaussian distribution is used as a symmetric regression function and identifies the maximum at around 13%. The maximum lies at around 13% and not at the theoretically expected 21%. This difference can be influenced by friction and other mechanical parameters and we plan to investigate this more detailed. Regarding to this we see the theory as supported.
Pairing a µ σ
‘Rising saw tooth’ (a) 0,86 0,25 0,12
Sine (b) 0,85 0,21 0,12
‘Falling saw tooth’ (c) 0,83 0,19 0,10
8 CONCLUSION
Results of the sinusoidal-triangular shape exp.
0% 20% 40% 60% 80% 100%
0,0% 10,0% 20,0% 30,0% 40,0% 50,0%
relative difference of the maximum torques
re
lat
ive o
cu
rr
e
n
cy o
f
th
e '
yes'
-an
s
w
er
s
measured values regression function
The tests we made support the theory in each step without contradiction: the energy characteristic describes haptical feeling of rotary switches more intuitive than the common torque characteristics. This helps to find parameters for intended purposes in haptical design of rotary switches.
Maximum occurrence
We find a value of around 20% of torque difference for just noticeable difference of rotary switches, when most of the subjects can differentiate and some not.
Right shift offset
Further there is an uncertainity in the decision of the subjects of around 15% finding haptical differences between two rotary switches.
The just noticeable difference function for this purpose can be described with a cumulated Gaussian function independent from the basic shape.
Further work will look more detailled into the characteristics and their parameters. Especially the difference of the shifted occurrence maximum between measurement and the theory of the sinusoidal and the triangular shapes is in focus.
Figure 13: Results of the comparison of sinusoidal and triangular shape with a Gaussian distribution as regression function.
For further analysis we transform the abscissa to get the maximum to the origin of the graph. The 13% average value of the Gaussian distribution is used for the transformation. Background is that the amplitude of the sinusoidal shape has to be 13% lower than the triangular shape to have the maximum conformity.
REFERENCES
[1] Reisinger J., Wild J., Mauter G., Bubb H.: Mechatronic Tools in haptic
research for automotive applications, Proceedings of REM2005, 30.6.-1.7., Annecy, France, p.293 - 298, 2005.
The fitting of the cumulated Gaussian distribution shows interesting parameters: the sinusoidal-triangular shape has nearly the same amplitude a as the other single-shape tests. This is an important answer, changing angled shapes to more smooth ones or backward. This may be useful for acoustical design and other purposes.
[2] Goldstein, E. B.: Sensation and Perception. Wadsworth Publishing
Company, 2002.
[3] Levitt, H.: Transformed Up-Down Methods in Psychoacoustics. The
journal of the acoustical Society of America, American Institute of Physics (AIP), Volume49, Number 2 (Part 2), p.467-477, 1971.
[4] Liter, J. C., Bülthoff, H. H.: An introduction to object recognition.
Zeitschrift für Naturforschung, Section C. Biosciences, 53 (7-8), 610-621, 1998.
Also the average value µ lies close to the other parameters, but with 16% even smaller.
[5] Thurstone, L.L.: A law of comparative judgement. Psychological
Review, 34, p.278-286, 1927.
The standard deviation has only half value of the other parameters. This means that the regression curve is falling stiffer than the others. Thereby the differentiation between the same and different switches changes more rapidly.
[6] Fanger, P.O.: Thermal Comfort. Analysis and Applications in
Environmental Engineering. New-York: McGraw-Hill, 1973.
Generally we find that the haptical similarity of sinusoidal and triangular shapes is fully supported.
Additionally the shifting of the maximum occurrence supports it even if the theoretical and the measured values do not correspond. To find the reasons is part of further work.