Iowa State University
From the SelectedWorks of Kurt A. Rosentrater
July, 2006
Characteristics of North American Meat & Bone
Meal Relevant to the Development of Non-feed
Applications
Rafael A. Garcia,
United States Department of Agriculture
Kurt A. Rosentrater,
United States Department of Agriculture
Rolando A. Flores,
United States Department of Agriculture
The authors are solely responsible for the content of this technical presentation. The technical presentation does not necessarily reflect the official position of the American Society of Agricultural and Biological Engineers (ASABE), and its printing and distribution does not constitute an endorsement of views which may be expressed. Technical presentations are not subject to the formal peer review process by ASABE editorial committees; therefore, they are not to be presented as refereed publications. Citation of this work should state that it is from an ASABE meeting paper. EXAMPLE: Author's Last Name, Initials. 2006. Title of Presentation. ASABE Paper No. 06xxxx. St. Joseph, Mich.: ASABE. For information about securing permission to reprint or reproduce a technical presentation, please contact ASABE at [email protected] or 269-429-0300 (2950 Niles Road, St. Joseph, MI 49085-9659 USA). Mention of trade names or commercial products in this article is solely for the purpose of providing specific information and does not imply recommendation or endorsement by the U.S.
An ASABE Meeting Presentation
Paper Number: 066158
Characteristics of North American Meat & Bone Meal Relevant to
the Development of Non-feed Applications
Rafael A. Garcia
USDA-ARSEastern Regional Research Center
Fats, Oils and Animal Coproducts Research Unit
600 E. Mermaid Ln.
Wyndmoor PA 19038
Kurt A. Rosentrater
USDA-ARSNorthern Grain Insects Research Laboratory
Crop and Entomology Research Unit
2923 Medary Ave
Brookings SD 57006
Rolando A. Flores
USDA-ARSEastern Regional Research Center
Crop Conversion Science and Engineering Research Unit
600 E. Mermaid Ln.
Wyndmoor PA 19038
Written for presentation at the
2006 ASABE Annual International Meeting
Sponsored by ASABE
Oregon Convention Center
Portland, Oregon
The authors are solely responsible for the content of this technical presentation. The technical presentation does not necessarily reflect the official position of the American Society of Agricultural and Biological Engineers (ASABE), and its printing and distribution does not constitute an endorsement of views which may be expressed. Technical presentations are not subject to the formal peer review process by ASABE editorial committees; therefore, they are not to be presented as refereed publications. Citation of this work should state that it is from an ASABE meeting paper. EXAMPLE: Author's Last Name, Initials. 2006. Title of Presentation. ASABE Paper No. 06xxxx. St. Joseph, Mich.: ASABE. For information about securing permission to reprint or reproduce a technical presentation, please contact ASABE at [email protected] or 269-429-0300 (2950 Niles Road, St. Joseph, MI 49085-9659 USA). Mention of trade names or commercial products in this article is solely for the purpose of providing specific information and does not imply recommendation or endorsement by the U.S. Department of Agriculture.
Abstract. Unmarketable animal tissues are typically processed by rendering plants, which transform them into meat & bone meal (MBM) or similar products. MBM’s traditional use as animal feed has become increasingly threatened, but MBM has potential for non-feed applications. Development of new products and processes is hindered by lack of reliable data on many of MBM’s chemical and physical properties. MBM samples as well as data on raw material and process were collected from 19 rendering facilities in the United States and Canada. A large majority of the raw material was tissue from cattle, swine and poultry. All facilities surveyed practiced continuous dry rendering; 89% of the facilities use continuous cookers and 11% use falling film evaporators. MBM is high in protein (44.6-62.8%, mfb), but this protein is poorly soluble; at pH 7 solubility ranged from 2.20 to 7.22 %. Among all samples, the particles’ median geometric mean diameter was 387 µm, and the size distribution was broad. The median density of MBM particles was 1.41 (g/ml); median density of MBM in bulk ranged from 0.50 g/ml when loose-filled to 0.68 g/ml when packed. pH values of the samples ranged from 5.89 to 7.19 and samples containing the most cattle tissue had the highest pH. Thermal diffusivity and thermal conductivity values for both loose-filled and packed MBM are
reported, as well as CIE L*a*b* color values.
Introduction
Since the second half of the 19th century, rendering plants have processed the majority of the unmarketable tissues from slaughtered farm animals (Burnham, 1996; Schoeff, 1985). The rendering process adds value to this material by dehydrating and stabilizing it against
degradation, and by fractionating it into two primary product streams: a purified fat stream and a stream high in protein and ash. The protein and ash stream is transformed into a commodity commonly known as ‘meat & bone meal’ (MBM; variations on this name can indicate specific raw materials, for example ‘poultry meal’ or ‘porcine meat & bone meal’, or proximate
composition, for example ‘meat meal’ when the phosphorus content is less than a specified concentration) (Association of American Feed Control Officials, 2002; National Renderers Association, 2003).
The rendering industry produces large quantities of MBM. In 2004, US renderers produced 2.1 million metric tons of bovine, porcine or mixed species MBM (Swisher, 2005) while in 2000, Canadian renderers produced 432 thousand metric tons (Canadian Food Inspection Agency, 2002). Prior to the United Kingdom’s outbreak of bovine spongiform encephalopathy (BSE) in the 1980’s, almost all MBM was utilized as a high protein ingredient in animal feed. Today, most countries do not allow MBM containing any amount of ruminant tissue to be fed to ruminant animals. In the United States, MBM with ruminant tissue is used in feed for non-ruminant farm animals (especially poultry and swine), companion animals and aquaculture species, which, with the exception of cats, have never been shown to contract BSE under normal circumstances (Matthews and Cooke, 2003; Oidtmann et al., 2003). In the European Union, MBM is banned from the feed of any animals that may become human food (Taylor and Woodgate, 2003). In the EU, MBM is now primarily either incinerated or used for its energy content in operations such as cement plants (Heilemann, 2002; Struckmann et al., 2004), or used as an ingredient in pet food.
While MBM’s feed use has become increasingly restricted, growing attention has focused on the development of new, non-feed applications. Investigators have demonstrated MBM’s utility as an agent to control plant pathogens (Lazarovits et al., 1999), as a nitrogen source for the fermentative production of bio-based materials (Koller et al., 2005), as the primary ingredient in an adhesive (Park et al., 2000), as fuel for fluidized bed combustors (McDonnell et al., 2001), and as a main ingredient in a hard plastic material (Garcia et al., 2004). These and other applications have potential commercial value, but with the exception of fuel uses, most have only been implemented on a laboratory or demonstration scale.
The design of manufacturing processes utilizing unfamiliar materials is simplified when data are available on the normal range of critical properties (Day et al., 1993; Rosentrater et al., 1999). MBM has been well characterized in terms of its nutritional properties (Bureau et al., 2000; Hua et al., 2005; Johnson and Parsons, 1997; Lueking et al., 1996; Parsons et al., 1997) and several reports have described significant variability in these properties (Hegedus, 1984; Hendriks et al., 2002). It has been shown, however, that MBM from a single renderer is considerably more consistent (Kirby et al., 1993; Kirstein, 2003). Some renderers or protein blenders supply MBM with tightly controlled ash and protein contents by blending MBM from different sources
(National Renderers Association, 2003). While many of the properties previously reported are very specific to animal nutrition (e.g., protein efficiency ratio, digestible energy, pepsin N
‘gross calorific value’ or ‘higher heating value’), and amino acid profile could be useful in the design of non-feed applications.
Other types of information, of major importance in the design of new products and processes, are not readily available. For example, there is little industry-wide information on the raw material used to produce MBM, the cooking treatment used, or geographic availability. Data on properties relevant to materials handling and product formulation is similarly scare. One recent study (Yang et al., 2005) emphasized the importance of properties such as material density and particle size distribution to the evaluation of biomass fuels; reliable data on such properties in MBM are not to be found in the scientific literature. The present study addresses these gaps in the current knowledge by gathering processing information and MBM samples from renderers across the United States and Canada. MBM characteristics, including particle size, density, thermal properties, proximate composition, protein solubility, pH, and color are investigated, as are potential correlations between these properties and the raw materials and processes used to manufacture them.
Materials and Methods
Geographic Information
US rendering facilities were identified and located by analysis of public inspection records (FDA Center for Veterinary Medicine, 2005); these records were created by the Food and Drug Administration’s Center for Veterinary Medicine by inspecting renderers, feed mills, ruminant feeders, protein blenders, pet food manufacturers, pet food salvagers, animal feed distributors and transporters, ruminant feeders, and others to determine compliance with BSE/ruminant feed regulations (FDA, 2003). Similar records for Canadian facilities were not available; many were located through the membership directory of the National Renderer’s Association (Alexandria, VA), which claims that its membership represents more than 98% of the rendering capacity in both Canada and the United States (Anonymous, 2005). Data obtained from these sources were augmented and corroborated through analysis of government reports, industrial contacts and literature (Canadian Food Inspection Agency, 2002; Pearl, 2005; Sparks Companies Inc., 1997; United States Government Accountability Office, 2005).
MBM Samples and Questionnaires
Through the Fats and Proteins Research Foundation (FPRF, Alexandria, VA) requests were made to 22 US and Canadian rendering facilities to submit 10 pounds of unblended (i.e., single batch) MBM. Sample providers were also asked to complete a detailed questionnaire (see Appendix) concerning the specifics of their rendering process, and the raw material they were processing on that day. Samples and questionnaires were assigned serial identification numbers by an intermediary at FPRF, and transferred to the researchers without revealing the source of any particular sample.
Individual MBM particles vary widely in size and composition, and the particle types have a strong tendency to spontaneously segregate, so care was required to obtain small,
representative samples for analysis. Submitted samples of MBM were thoroughly homogenized and split into sub-samples by repeated cone and quartering. Sub-samples were
re-homogenized prior to being analyzed.
Particle size analysis
standard series of sieves according to ASTM D 1921-01 (ASTM International, 2001). Geometric mean diameter and geometric standard deviation of the particle size distributions were
calculated using standard equations according to method ASAE S319.3 (American Society of Agricultural Engineers, 2003a).
Density
Loose bulk density of each sample was determined in triplicate using standard method AACC 55-10 (American Association of Cereal Chemists, 1995b), which involved pouring MBM into a cup of known volume and determining the mass. Performing the test exactly as described in the standard, however, resulted in the funnel above the test cup becoming clogged with MBM. To avoid this, MBM was added to the funnel in two smaller batches. The diameter of cup was large enough that the MBM filled the cup without ‘bridging’ or leaving any large air spaces.
Tapped bulk density of each sample type was determined in at least triplicate using an Autotap (Quantachrome Instruments, Boynton Beach, FL) set to deliver 3000 taps to each sample. These data were used to compute the Hausner ratio, the ratio of a material’s tapped bulk density to its loose bulk density (Grey and Beddow, 1969), for each sample.
Apparent material density, which is the average density of individual particles including closed pores, was determined using a helium pycnometer (AccuPyc 1330, Micromeritics, Norcross, GA). Before testing, samples were dehydrated to a constant mass, at 70 C, under
approximately 100 kPa (gauge) vacuum. Three sub-samples from each sample were obtained, and the density of each of these sub-samples was determined three times and averaged.
Thermal Properties
Material was allowed to free flow into 50 mL polypropylene centrifuge tubes via a standard bushel tester funnel (Seedburo Equipment Co., Chicago, IL). Compacted samples were produced by tapping on the laboratory bench by hand 20 times in a consistent manner.
Thermal conductivity and diffusivity were determined, on both loose-filled as well as compacted samples, with a thermal properties meter (KD2, Decagon Devices, Pullman, WA), which utilized the line heat-source probe, maximum slope technique (Baghe-Khandan et al., 1981; Wang and Hayakawa, 1993).
Proximate Analysis
Lipid content was determined by Soxhlet extraction with hexane according to ASTM D 3495-83 (ASTM International, 1994). Moisture content determinations were performed by dehydrating 2g samples at 70 C, under approximately 100 kPa (gauge) vacuum, to constant mass, which typically took 24 hours. The relatively low drying temperature in both the lipid and moisture analyses was chosen to minimize error due to vaporization of free fatty acids. Ash
determination was performed by overnight incineration of 2 g samples in ceramic crucibles in a 600 °C muffle furnace.
Nitrogen content in samples was determined using an automated analyzer (model FP-2000, Leco Corporation, St. Joseph, MI). Because the sample size used in this analysis was only 50 mg, 5g samples were finely milled in a freezer mill (model 6800, Spex Centiprep Inc., Metuchen, NJ) and homogenized before drawing out sub-samples for nitrogen determination. A nitrogen to protein conversion factor of 6.45 was calculated based on recently published amino acid
Three to five repetitions of each proximate composition analysis were performed.
Protein Solubility
Protein solubility was determined using a well-validated and widely-used method developed for commodity proteins such as soy protein concentrate or spray dried whey (Morr et al., 1985). Under carefully defined conditions 500 mg of sample protein were stirred in a solution of 0.1 M NaCl for one hour, at pH 7. After centrifugation, the dissolved protein concentration was determined; the bicinchoninic acid assay (Walker, 1996) was used rather than the
recommended biuret assay. The percent solubility was calculated as the mass of protein dissolved, divided by the mass of protein in the original sample. Duplicate analyses were performed on each sample.
pH
The methodology used for pH determination was adapted from standard methods for pH in flour and meat (American Association of Cereal Chemists, 1995a; Food Safety and Inspection
Service, 1993). Briefly, 5 g sample material was stirred into 50 mL of ultrapure water that had recently been boiled to eliminate dissolved CO2. The solid material was allowed to settle
momentarily and then the pH was measured using a calibrated pH meter. Triplicate analyses were performed on each sample.
Color Analysis
Images of MBM samples were produced by photographing them in a controlled and
standardized manner. Specifically, duplicate samples were prepared by filling large Petri dishes (150 x 15 mm) with MBM and smoothing the surface with a straightedge. Photographs were taken with a Nikon D-70 camera, 60 mm lens, 1/60 sec F8 aperture, under studio lighting. A test shoot was performed to establish in-camera white balance. The resulting 16-bit TIFF images were analyzed using Photoshop CS (Adobe Systems Inc., San Jose, CA). A template layer superimposed on each image specified five color sampling locations, arranged in a cross pattern; at each location, a 5 by 5 pixel color sample was measured and the CIE L*a*b* color space coordinates were recorded.
Results and Discussion
Geographic Distribution of the Rendering Industry
There are approximately 250 rendering facilities operating in the US and 32 operating in Canada. Geographic data shows that rendering facilities are not distributed homogeneously (Figure 1); the states of Texas, Nebraska, California, and Illinois contain 28% of all the
rendering plants in the US. The data available on Canadian facilities is less complete; of the 19 facilities identified, 68% were in the provinces of Ontario, Alberta or Quebec.
General Survey Results
The 22 requests sent out resulted in submission of 19 MBM samples accompanied by completed questionnaires (86.4% response rate). Although samples were submitted
material known as ‘crax’ or ‘cracklings’, material which has not gone through the final operations of milling and screening to produce finished MBM; this sample was not subjected to the
laboratory analysis but the questionnaire data associated with it was used.
Figure 1. Geographic distribution of US rendering facilities. Alaska, Hawaii and Puerto Rico not to scale. Arrows indicate location of facilities that are difficult to see on the map.
Raw Material
Material from cattle, swine and poultry made up the majority of the raw material processed by the renderers surveyed (Figure 2). Most MBM submitted contained material of more than one species, three of the submitted samples were all pork material, three were all cattle, and one was 99% chicken. A minority of renderers reported using any material from cervids, horses or aquatic animals; none of these species made up greater than 10% of an individual renderer’s raw material. No renderers reported including any sheep, dog, cat or other companion, fur or zoo animals. The absence of canine or feline material is supported by an FDA report, which examined a range of commercial dog food, many varieties of which contained MBM. Using a very sensitive method to identify the species of the material, they did not detect any feline, canine or equine tissue (Myers et al., 2004). The absence of ovine material is consistent with a National Renderer’s Association policy against the inclusion of sheep material; since the
collection of the samples in the present study, this policy has been rescinded (Malone, 2005).
0
Figure 2. Types of animals in renderer’s raw material (n=19).
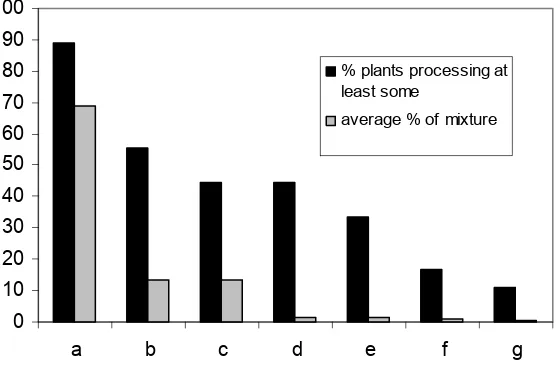
12 out of 19 respondents reported that the majority of their raw material consisted the remains of meat animal carcasses (excluding hair, hoof, horn, blood, and contents of the gastrointestinal tract) after they had been harvested for their high value tissues at a slaughterhouse (Figure 3). Ten out of 19 renderers used as least some material from dead stock (animals that died before slaughter); five of 19 renderers had dead stock as at least 10% of their raw material. None of the renderers reported using any dead stock from non-agricultural sources such as road kill, wildlife culling, racing animals, zoos, or veterinarians. Eight out of 19 renderers had some material that consisted of meat products past their ‘sell by’ date; five out of 19 renderers had this type of material as at least 10% of their raw material. Eight out of 19 included protein recovered by the dissolved air floatation unit in the plant’s effluent stream. Eight out of 19 included some material from the processing of hides (fleshings or trim).
0
Figure 3. Sources of renderer’s raw material (n=19). a) slaughterhouse bones and offal, b) dead stock, c) meat products past ‘sell-by’ date, d) DAF system skimmings, e) hide fleshings, f)
Processing Methods
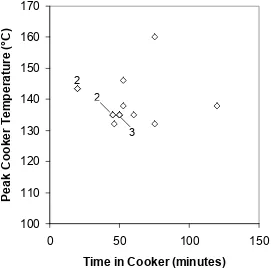
All facilities surveyed practiced continuous dry rendering; 16 of 18 facilities use continuous cookers and two of 18 use falling film evaporators. These results are consistent with reports that alternative processes, such as batch dry rendering, wet rendering and solvent extraction, are currently rare in the United States and Canada (Auvermann et al., 2004; Bisplinghoff, 1995; Prokop, 1996). The data reveal that material from different facilities has been subjected to very different time-temperature treatments (Figure 4).
100
Figure 4. Reported heat treatment received by raw material in the rendering process (n=15). Data points labeled with numbers represent multiple overlapping points.
Particle Size Distribution
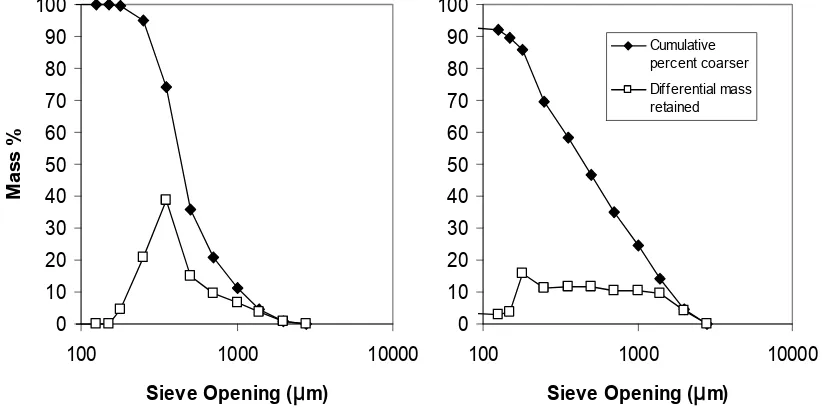
MBM particle sizes are widely distributed both within and between samples. Computed geometric mean diameter for individual samples were all within the range 256-800 µm, with a median of 387 µm. Within individual samples, two distinct patterns of particle size distribution were qualitatively observed, which correlated well with calculated values for log normal geometric standard deviation. Eight of the 18 samples had clear peaks in their distribution profiles, as typified in Figure 5a, and standard deviations of less than 70% of their mean diameter; the remaining samples displayed much flatter distribution profiles, as typified by Figure 5b, and standard deviations of greater than 70% of their mean diameter. The
questionnaire on rendering process specifics did not request any information on the final stages of the rendering process where crax is screened and milled into finished MBM. Anecdotal evidence, however, suggests that the flatter distribution profiles may originate at plants where screens have been removed from the normal finishing operation; the screens tend to become
2
blinded with fatty residue and some operators consider them an unnecessary nuisance (Hamilton, 2005).
Figure 5. Particle size distribution in MBM. Two distinct patterns are observed, a) a relatively narrow distribution, and b) a much broader distribution.
Density
Bulk MBM consolidates significantly when disturbed (Table 1); the median loose fill bulk density was 0.50 g/mL, while after extensive tapping the median bulk density increased to 0.68 g/mL. Strong positive correlations (α< 0.001) were found between ash content and both bulk and material densities. These correlations are consistent with earlier observations (Mendez and Dale, 1998) that rendered bone particles are denser that rendered soft tissue particles.
The Hausner ratio of a particulate material is known to correlate well with the material’s fluidization behavior (Geldart et al., 1984). Of the MBM samples tested, 11% had Hausner ratios indicating that they would behave as easy to fluidize Group A powders (Hausner ratio > 1.4), 5% as difficult to fluidize Group C powders (HR < 1.25), and the remaining 84% as transitional Group AC powders.
Table 1. Observed range of values for several of MBM’s physical and chemical properties (n=18).
minimum median maximum
True Protein (%, mfb) 44.6 56.6 62.8
Lipid (%, mfb) 8.9 12.2 16.0
Ash (%, mfb) 20.7 25.3 39.9
Moisture (%, as received) 1.9 3.1 5.7
pH 5.89 6.30 7.19
protein solubility (%) 2.2 5.4 7.2
loose fill 0.43 0.50 0.61
packed – 3000 taps 0.58 0.68 0.81
Hausner ratio 1.23 1.33 1.49
apparent material density
(g/mL) 1.36 1.41 1.55
thermal conductivity (W/(m°C))
loose fill 0.053 0.058 0.063
packed – 20 taps 0.070 0.085 0.110
thermal diffusivity (mm2/s)
loose fill 0.150 0.165 0.187
packed – 20 taps 0.107 0.120 0.137
L* 25.6 51.2 69.9
a* 13.4 22.1 26.5
b* 25.2 38.9 57.0
Thermal Properties
Thermal conductivity and diffusivity at 22.5 (±0.3) °C were determined for MBM samples at both low and high bulk densities (Table 1). The thermal conductivities of samples at their lowest stable bulk density all fell in a tight range, 0.05-0.06 W/(m°C); after compacting the samples with 20 standard taps, the conductivities increased and covered a larger range, 0.07-0.11 W/(m°C). These results are consistent with previous reports of the thermal conductivity of powders increasing along with bulk density (MacCarthy, 1985; Muramatsu et al., 2005).
The thermal diffusivities the samples at low density fell in the range 0.150-0.187 mm2/s, while at high density they fell in the range 0.107-0.137 mm2/s.
Proximate Analysis
The proximate composition of the MBM samples studied varied substantially from source to source (Table 1), consistent with the findings of previous studies. The use of unblended MBM in the present research exaggerates the variability of MBM’s proximate composition. It is standard practice for renderers to blend batches of MBM in order achieve a specified proximate composition (Anonymous, 2003; Kirstein, 2003).
The percentage of cattle tissue in the raw material had a significant positive correlation
(α=0.023) with the ash content of the finished MBM. No other correlations between raw material species and proximate composition were observed.
Protein Solubility
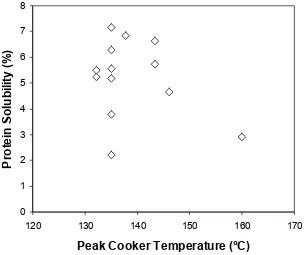
solubility; the present study found no correlation between processing parameters such as ‘peak cooker temperature’ and protein solubility (Figure 6).
0
120 130 140 150 160 170
Peak Cooker Temperature (°C)
Figure 6. Peak temperature applied to raw material in the rendering process versus the solubility of the resulting MBM protein at pH 7 (n=15)
pH
pH values of the samples ranged from 5.89 to 7.19 with a median value of 6.30. The samples with the 4 highest pH values were the samples with the 4 highest concentrations of cattle tissue.
Color
All 18 samples of MBM received could be described as brown or tan, but significant color differences between samples are easily observable (Table 1); in appearance the samples ranged from dark brown (similar to coffee grounds) to tan (similar to pale beach sand).
Conclusions
Data from the present research should assist engineers in evaluating whether MBM could be used in their product or process. This work has shown that differences in raw material and rendering processes result in considerable variation in the physical properties of the MBM produced. Any process designed to utilize MBM will have to accommodate this variation.
There are still significant hurdles to the adoption of MBM as a feedstock for bio-based products. Many potential applications are ruled out by the potential for prion contamination of the material. It should be noted, however, that BSE has been diagnosed in a total of four Canadian-born cows (Canadian Food Inspection Agency, 2005) and one US-born cow (Animal and Plant Health Inspection Service 2005); no cases have been found in Mexico (OIE, 2005). Thus, the chances of BSE contamination in North American MBM are extremely limited (Cohen et al., 2003).
Acknowledgements
Lorelie Bumanlag, Paul Pierlott, John Phillips, and Brian Coll provided valuable technical assistance in completion of this research.
References
Adedokun, S. A. and L. Adeola. 2005. Metabolizable energy value of meat and bone meal for pigs. J. Anim. Sci. 83(11): 2519-2526.
American Association of Cereal Chemists. 1995a. AACC method 02-52 hydrogen-ion activity (pH) - electrometric method. In Approved methods of the American association of cereal chemists, St. Paul, MN: American Association of Cereal Chemists.
American Association of Cereal Chemists. 1995b. AACC method 55-10: Test weight per bushel. In Approved methods of the American association of cereal chemists, St. Paul, MN: American Association of Cereal Chemists.
American Society of Agricultural Engineers. 2003a. ANSI/ASAE s319.3 feb03 method of determining and expressing fineness of feed materials by sieving. In ANSI/ASAE standards, St. Joseph, MI: American Society of Agricultural Engineers.
American Society of Agricultural Engineers. 2003b. ASAE s358.2 feb03 moisture
measurement—forages. In ASAE standards, St. Joseph, MI: American Society of Agricultural Engineers.
Animal and Plant Health Inspection Service 2005. USDA Texas BSE investigation—final epidemiology report, United States Department of Agriculture.
Anonymous. 2003. Finishing and blending rendered animal proteins. National By-products technical bulletin: 1-5.
Anonymous. 2005. Expanded feed controls in Canada not justified. Render (April): 54-55. Association of American Feed Control Officials. 2002. Feed terms & ingredient definitions. In
Official publication: Association of American Feed Control Officials, 210-327.
ASTM International. 1994. D 3495-83 standard test method for hexane extraction of leather. In Annual book of ASTM standards, West Conshohocken, PA: ASTM International.
ASTM International. 2001. D 1921-01 standard test methods for particle size (sieve analysis) of plastic materials. In Annual book of ASTM standards, West Conshohocken, PA: ASTM International.
Auvermann, B., A. Kalbasi and A. Ahmed. 2004. Rendering. In Carcass disposal: A
comprehensive review: National Agricultural Biosecurity Center Consortium, USDA APHIS Cooperative Agreement Project, Carcass Disposal Working Group, 1-76. Baghe-Khandan, M., S. Y. Choi and M. R. Okos. 1981. Improved line heat source thermal
conductivity probe. J. Food Sci. 46(5): 1430-1432.
slope-ratio assays with growing pigs, rats and chicks and by chemical techniques. Brit. J. Nutr. 55: 441-453.
Bisplinghoff, F. 1995. Cooking primer. Render (October): 10-12, 14.
Bureau, D. P., A. M. Harris, D. J. Bevan, L. A. Simmons, P. A. Azevedo and C. Y. Cho. 2000. Feather meals and meat and bone meals from different regions as protein sources in rainbow trout (oncorhynchus mykiss) diets. Aquaculture 181(3/4): 281-291.
Burnham, F. A. 1996. The rendering industry: A historical perspective. In The original recyclers, Alexandria, VA: National Renderers Association.
Canadian Food Inspection Agency. 2002. Risk assessment on bovine spongiform
encephalopathy in cattle in Canada part a: Evaluation of risk factors. Ottawa, Ontario, Canada.
Canadian Food Inspection Agency. 2005. Technical overview of BSE in Canada - March 2005. Cohen, J. T., K. Duggar, G. M. Gray, S. Kreindel, H. Abdelrahman, T. HabteMariam, D. Oryang
and B. Tameru. 2003. Evaluation of the potential for bovine spongiform encephalopathy in the United States, Harvard Center for Risk Analysis - Harvard School of Public Health Center for Computational Epidemiology - College of Veterinary Medicine - Tuskegee University.
Day, M., J. Graham, R. Lachmansingh and E. Chen. 1993. Characterization of auto shredder residue - a Canadian perspective. Resour. Conserv. Recy. 9(4): 255-279.
FDA. 2003. Compliance program guidance manual 7371.009-BSE/ruminant feed ban inspections, Food and Drug Administration: 1-75.
FDA Center for Veterinary Medicine. 2005. BSE/ruminant feed inspections firms inventory. Available at: http://www.accessdata3.fda.gov/BSEInspect/. Accessed 1 February 2005. Food Safety and Inspection Service. 1993. Phm - determination of pH of meat. In Analytical
chemistry laboratory guidebook: Food chemistry: Food Safety and Inspection Service. Garcia, R. A., C. I. Onwulata and R. D. Ashby. 2004. Water-plasticization of extruded material
made from meat and bone meal and sodium caseinate. J. Ag. Food Chem. 52(12): 3776 - 3779.
Geldart, D., N. Harnby and A. C. Wong. 1984. Fluidization of cohesive solids. Powder Tech. 37: 25-37.
Grey, R. O. and J. K. Beddow. 1969. On the Hausner ratio and its relationship to some properties of metal powders. Powder Tech. 2(6): 323-326.
Hamilton, C. R. personal communication. 23 May 2005.
Hegedus, M. 1984. Nutritive value of slaughter byproduct meals. Acta Vet. Hung. 32(3-4): 105-116.
Heilemann, M. 2002. [disposal of animal byproducts, perished and slaughtered animals.] (in german). Deut. Tierarztl. Woch. 109(8): 354-357.
Hendriks, W. H., C. A. Butts, D. V. Thomas, K. A. C. James, P. C. A. Morel and M. W. A. Verstegen. 2002. Nutritional quality and variation of meat and bone meal. Asian Austral. J. Anim. 15(10): 1507-1516.
Hua, K., L. Liu and D. P. Bureau. 2005. Determination of phosphorus fractions in animal protein ingredients. J. Agric. Food Chem. 53(5): 1571 -1574.
Johnson, M. L., C. M. Parsons, G. C. Fahey Jr., N. R. Merchen and C. G. Aldrich. 1998. Effects of species raw material source, ash content, and processing temperature on amino acid digestibility of animal by-product meals by cecectomized roosters and ileally cannulated dogs. J. Anim. Sci. 76(4): 1112-1122.
Kirby, S. R., G. M. Pesti and J. H. Dorfman. 1993. An investigation of the distribution of the protein content of samples of corn, meat and bone meal, and soybean meal. Poultry Sci. 72: 2294-2298.
Kirstein, D. D. 2003. Purchasing guidelines for meat & bone meal. Proceedings for the MidWest Poultry Federation Pre-Show Nutrition Symposium, St. Paul, MN.
Koller, M., R. Bona, G. Braunegg, C. Hermann, P. Horvat, M. Kroutil, J. Martinz, J. Neto, L. Pereira and P. Varila. 2005. Production of polyhydroxyalkanoates from agricultural waste and surplus materials. Biomacromolecules 6(2): 561-5.
Kondos, A. C. and G. L. McClymont. 1972. Nutritional evaluation of meat meals for poultry: Effect of processing temperature on total and biologically available amino acids. Aust. J. Agr. Res. 23: 913-922.
Lazarovits, G., K. L. Conn and J. Potter. 1999. Reduction of potato scab, verticillium wilt, and nematodes by soymeal and meat and bone meal in two Ontario potato fields. Can. J. Plant Path. 21(4): 345-353.
Lueking, D. D., N. R. Merchen, J. K. Drackley, M. F. Hutjens, A. Bach and M. D. Stern. 1996. Variation in composition and in situ and in vitro digestion of meat and bone meals. J. Anim. Sci. 74(Supplement 1): 82.
MacCarthy, D. A. 1985. Effect of temperature and bulk density on thermal conductivity of spray-dried whole milk powder. J. Food Eng. 4: 249-263.
Malone, J. 2005. NRA rescinds sheep material policy. ASI Weekly. Centennial, CO. Matthews, D. and B. C. Cooke. 2003. The potential for transmissible spongiform
encephalopathies in non ruminant livestock and fish. Rev. Sci. Tech. OIE 22(1): 283-296.
McDonnell, K., J. Desmond, J. J. Leahy, R. Howard-Hildige and S. Ward. 2001. Behaviour of meat and bonemeal/peat pellets in a bench scale fluidised bed combustor. Energy 26(1): 81-90.
Mendez, A. and N. Dale. 1998. Rapid assay to estimate calcium and phosphorus in meat and bone meal. J. Appl. Poult. Res. 7(3): 309-312.
Morr, C. V., B. German, J. E. Kinsella, J. M. Regenstein, J. P. Vanburen, A. Kilara, B. A. Lewis and M. E. Mangino. 1985. A collaborative study to develop a standardized food protein solubility procedure. J. Food Sci. 50(6): 1715-1718.
Muramatsu, Y., T. Kasai and A. Tagawa. 2005. Effective thermal conductivity of rice flour and whole and skim milk powder. J. Food Sci. 70(4): E279-E287.
Myers, M. J., D. E. Farrell, D. N. Heller and H. F. Yancy. 2004. Development of a polymerase chain reaction-based method to identify species-specific components in dog food. Am. J. Vet. Res. 65(1): 99-103.
National Renderers Association. 2003. Pocket information manual: A buyer's guide to rendered products. Alexandria, VA: National Renderers Association.
OIE. 2005. Number of reported cases of bovine spongiform encephalopathy (BSE) in farmed cattle worldwide. Available at: http://www.oie.int/eng/info/en_esbmonde.htm. Accessed 28 September 2005.
Park, S. K., D. H. Bae and N. S. Hettiarachchy. 2000. Protein concentrate and adhesives from meat and bone meal. J. Am. Oil Chem. Soc. 77(11): 1223-1227.
Parsons, C. M., F. Castanon and Y. Han. 1997. Protein and amino acid quality of meat and bone meal. Poultry Sci. 76: 361-368.
Pearl, G. G. personal communication. 7 March 2005.
Prokop, W. H. 1996. Technological and environmental impacts on the rendering industry. In The original recyclers, Alexandria, VA: National Renderers Association, 23-52.
Rosentrater, K. A., R. A. Flores, T. L. Richard and C. J. Bern. 1999. Physical and nutritional properties of corn masa by-product streams. Applied Eng. in Agric. 15(5): 515-523. Schoeff, R. W. 1985. History of the formula feed industry. In Feed manufacturing technology III:
American Feed Industry Association, 2-8.
Sparks Companies Inc. 1997. The economic impact of proposed ruminant protein regulations. Render (April): 40 ,42-45, 51, 54.
Struckmann, P., H.-J. Dieckmann, J. Brandenstein and M. Ochlast. 2004. Co-combustion of secondary fuels - prevention or reduction of operating problems. VGB PowerTech 84(1): 72-76.
Swisher, K. 2005. Market report 2004. Render (April): 10-16.
Taylor, D. M. and S. L. Woodgate. 2003. Rendering practices and inactivation of transmissible spongiform encephalopathy agents. Rev. Sci. Tech. OIE 22(1): 297-310.
United States Government Accountability Office. 2005. Gao-05-101 mad cow disease: FDA's management of the feed ban has improved, but oversight weaknesses continue to limit program effectiveness.
Walker, J. M. 1996. The bicinchoninic acid (BCA) assay for protein quantitation. In The protein protocols handbook, Totowa, NJ: Humana Press, 11-14.
Wang, J. and K. I. Hayakawa. 1993. Maximum slope method for evaluating thermal conductivity probe data. J. Food Sci. 58: 1340-1345.
Wang, X. and C. M. Parsons. 1998. Effect of raw material source, processing systems, and processing temperature on amino acid digestibility of meat and bone meals. Poultry Sci. 77(6): 834-841.
Yang, Y. B., C. Ryu, A. Khor, N. E. Yates, V. N. Sharifi and J. Swithenbank. 2005. Effect of fuel properties on biomass combustion. Part II. Modeling approach--identification of the controlling factors. Fuel 84(16): 2116-2130.
Appendix
Questionnaire Given to Renderers
When answering these questions, just consider the raw material that was rendered today to produce the MBM sample you are providing. Don’t consider anything that went into separate processes (feathers-> feather meal; restaurant grease-> recycled restaurant grease).
___% cattle [ ____% bone _____% offal _____% whole animal]
___% pork [ ____% bone _____% offal _____% whole animal]
___% sheep [ ____% bone _____% offal _____% whole animal]
___% turkey [ ____% bone _____% offal _____% whole animal]
___% chicken [ ____% bone _____% offal _____% whole animal]
___% deer, elk [ ____% bone _____% offal _____% whole animal]
___% horse [ ____% bone _____% offal _____% whole animal]
___% dog, cat or other pet [ ____% bone _____% offal _____% whole animal]
___% fish [ ____% bone _____% offal _____% whole animal]
___% other [ ____% bone _____% offal _____% whole animal]
(if other, what?___________________________________________)
Of this raw material, what % is: (your best estimate)
____ % Dissolved air floatation grease and solids
____ % Hide fleshings; species %_______; _______: _______
____ % Hides and trim; species %_______; _______: _______
____ % out-dated meat products; species %_______; _______: _______
____ % restaurant or food service waste
____ % dead stock
If there is dead stock in your material, where did it come from?
___% farm/ranch ___ % dairy ___ % feedlot ___ % veterinarian
___ % horse owners ___% zoo ___% wildlife managers ___% hunters
___ % roadkill ___ % other (if so, what? _____________________)
Is your rendering process continuous, batch, or falling-film evaporator? If other, please describe.
Is your rendering process dry (the steam does not come in direct contact with the raw material)?
How long does the raw material remain in the cooker? (specify average or minimum residence time)
What is the peak temperature of the material in the cooker?____ Exit temperature?_____
What date was this MBM sample produced on?
Do you add anything to the MBM (for example to dilute excess protein)?