LAMPIRAN A
PERCOBAAN VALIDASI METODE ANALISA SEDIAAN FILM BUCCOADHESIVE TERBUTALIN SULFAT
1. Perhitungan Statistika Kurva baku
Data Kurva Baku Terbutalin Sulfat dalam Larutan Dapar Fosfat Isotonis pH 6.8 Pengujian I
Data Kurva Baku Terbutalin Sulfat dalam Larutan Dapar Fosfat Isotonis pH 6.8 Pengujian II
Konsentrasi
(ppm) Absorbansi X² Y² XY
1,00 0,016 1,01 0,00 0,02 5,02 0,071 25,20 0,01 0,36 10,04 0,082 100,80 0,01 0,82 20,08 0,148 403,21 0,02 2,97 30,12 0,230 907,21 0,05 6,93 40,16 0,292 1612,83 0,09 11,73 50,20 0,345 2520,04 0,12 17,32 60,24 0,457 3628,86 0,21 27,53 70,28 0,519 4939,28 0,27 36,48 90,36 0,645 8164,93 0,42 58,28
110,44 0,805 12196,99 0,65 88,90
34500,36 1,83 251,33
Konsentrasi
(ppm) Absorbansi X² Y² XY
1 0,013 1,00 0,00 0,01
5 0,060 25,00 0,00 0,30
10 0,095 100,00 0,01 0,95
20 0,170 400,00 0,03 3,40
30 0,245 900,00 0,06 7,35
40 0,299 1600,00 0,09 11,96
50 0,360 2500,00 0,13 18,00
60 0,449 3600,00 0,20 26,94
70 0,548 4900,00 0,30 38,36
90 0,660 8100,00 0,44 59,40
110 0,822 12100,00 0,68 90,42
Data Kurva Baku Terbutalin Sulfat dalam Larutan Dapar Fosfat Isotonis pH 6.8 Pengujian III
Konsentrasi
(ppm) Absorbansi X² Y² XY
1,01 0,009 1,02 0,00 0,01 5,04 0,045 25,40 0,00 0,23 10,08 0,079 101,61 0,01 0,80 20,16 0,159 406,43 0,03 3,21 30,24 0,240 914,46 0,06 7,26 40,32 0,281 1625,70 0,08 11,33 50,40 0,355 2540,16 0,13 17,89 60,48 0,470 3657,83 0,22 28,43 70,56 0,532 4978,71 0,28 37,54 90,72 0,645 8230,12 0,42 58,51
110,88 0,835 12294,37 0,70 92,58
34775,81 1,91 257,78
SSc = ⅀ Yc – [(⅀Xyc) / ⅀Xc]
= 5,66 – [766,21 / 103502,16]
= 5,65
SSp = SS1 + SS2 + SS3
= 1,93 + 1,83 + 1,91
= 5,66
Fhitung = (SSc – SSp / k – 1) / (SSp/ 27)
= (5,66 – 5,66 / 3 – 1) / (5,66 / 30)
= 0,04
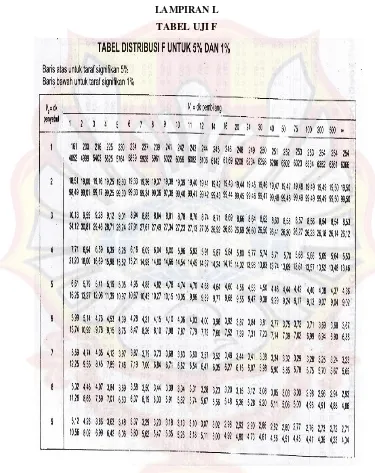
Fhitung < Ftabel 0,05 (2;30) = 3,32
⅀X² ⅀Y² ⅀XY N SSi RDF
I 34226,00 1,93 257,09 11 1,93 10
II 34500,36 1,83 251,33 11 1,83 10
III 34775,81 1,91 257,78 11 1,91 10
2. Penentuan Kurva Baku
Hari No Konsentrasi
(ppm) Absorbansi Persamaan Garis
1
1 1,00 0,013 y = 0,0073 x + 0,0172
R² = 0,9978
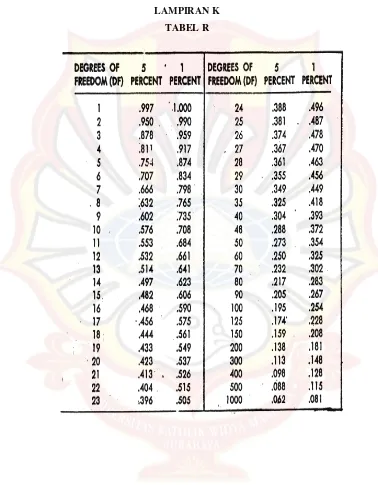
r hitung/ r tabel = 0,9989/0,576
a = 0,0172 b = 0,0073 r = 0,9989
2 5,00 0,060
3 10,00 0,095
4 20,00 0,170
5 30,00 0,245
6 40,00 0,299
7 50,00 0,360
8 60,00 0,449
9 70,00 0,548
10 90,00 0,660
11 110,00 0,822
2
1 1,00 0,016 y = 0,0071 x + 0,0135
R² = 0,9974
r hitung/ r tabel = 0,9987/0,576
a = 0,0135 b = 0,0071 r = 0,9987
2 5,02 0,071
3 10,04 0,082
4 20,08 0,148
5 30,12 0,230
6 40,16 0,292
7 50,20 0,345
8 60,24 0,457
9 70,28 0,519
10 90,36 0,645
11 110,44 0,805
3
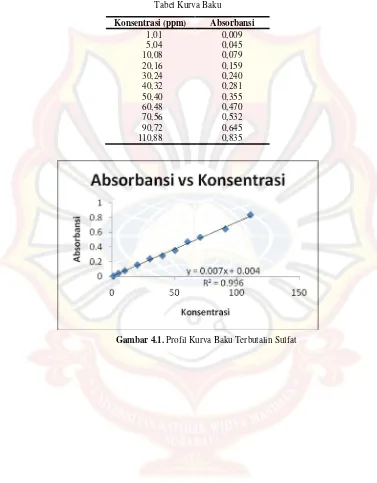
1 1,01 0,009 y = 0,0073 x + 0,0045
R² = 0,9965
r hitung/ r tabel = 0,9983/0,576
a = 0,0045 b = 0,0073 r = 0,9983
2 5,04 0,045
3 10,08 0,079
4 20,16 0,159
5 30,24 0,240
6 40,32 0,281
7 50,40 0,355
8 60,48 0,470
9 70,56 0,532
10 90,72 0,645
Tabel Kurva Baku
Konsentrasi (ppm) Absorbansi
1,01 0,009
5,04 0,045
10,08 0,079
20,16 0,159
30,24 0,240
40,32 0,281
50,40 0,355
60,48 0,470
70,56 0,532
90,72 0,645
110,88 0,835
3. Uji Akurasi
Replikasi % Absorbansi C (ppm)
C teoritis
(ppm)
% Perolehan
Kembali
1 80 0,296 40,20 40 100,50
100 0,361 50,10 50 100,20
120 0,440 60,20 60 100,33
2 80 0,289 40,15 40 100,38
100 0,365 50,20 50 100,40
120 0,454 60,50 60 100,83
3 80 0,299 40,25 40 100,63
100 0,370 50,50 50 101,00
120 0,448 60,40 60 100,67
X rata-rata±SD 100,55 ± 0,26
SD rel (%) 0,26
4. Uji Presisi
Replikasi % Absorbansi C (ppm)
C teoritis
(ppm)
% Perolehan Kembali
1 100 0,361 50,10 50 100,20
2 100 0,365 50,20 50 100,40
3 100 0,370 50,50 50 101,00
4 100 0,368 50,30 50 100,60
5 100 0,366 50,30 50 100,60
6 100 0,360 50,10 50 100,20
X rata-rata±SD 100,50 ± 0,30
LAMPIRAN B
HASIL UJI
ANOVA
PENETAPAN KADAR
TERBUTALIN SULFAT
Anova: Single Factor
SUMMARY
Groups Count Sum Average Variance
Column 1 3 300,8904 100,2968 0,325264
Column 2 3 301,4384 100,4795 0,394070
Column 3 3 301,3014 100,4338 0,419091
Column 4 3 301,1644 100,3881 1,057109
ANOVA Source of
Variation SS df MS F P-value F crit
Between
Groups 0,054732 3 0,018244 0,033238 0,991233 4,066181 Within
Groups 4,391068 8 0,548883
LAMPIRAN C
PERHITUNGAN UJI HOMOGENITAS FILM
BUCCOADHESIVE
TERBUTALIN SULFAT
1.
Hasil Uji Homogenitas Terbutalin Sulfat Formula -1
Replikasi Uji Absorbansi C (ppm) C (mg/luas film) X rata-rata ± SD SD rel (%) 1
1 0,743 101,16 0,95
0,95 ± 0,01 0,54
2 0,739 100,62 0,95
3 0,735 100,07 0,94
2
1 0,745 101,44 0,96
0,95 ± 0,01 0,82
2 0,733 99,79 0,94
3 0,738 100,48 0,95
3
1 0,737 100,34 0,95
0,95 ± 0,00 0,28
2 0,741 100,89 0,95
3 0,740 100,75 0,95
Keterangan : Luas film 5,3066 cm²
2.
Hasil Uji Homogenitas Terbutalin Sulfat Formula a
Replikasi Uji Absorbansi C (ppm) C (mg/luas film) X rata-rata ± SD SD rel (%) 1
1 0,744 101,30 0,95
0,95 ± 0,01 0,83
2 0,732 99,66 0,94
3 0,736 100,21 0,94
2
1 0,738 100,48 0,95
0,95 ± 0,00 0,28
2 0,742 101,03 0,95
3 0,741 100,89 0,95
3
1 0,735 100,07 0,94
0,95 ± 0,01 0,54
2 0,743 101,16 0,95
3 0,739 100,62 0,95
3.
Hasil Uji Homogenitas Terbutalin Sulfat Formula b
Replikasi Uji Absorbansi C (ppm) C (mg/luas film) X rata-rata ± SD SD rel (%) 1
1 0,736 100,21 0,94
0,95 ± 0,00 0,27
2 0,740 100,75 0,95
3 0,738 100,48 0,95
2
1 0,742 101,03 0,95
0,95 ± 0,01 0,62
2 0,737 100,34 0,95
3 0,733 99,79 0,94
3
1 0,744 101,30 0,95
0,95 ± 0,00 0,34
2 0,739 100,62 0,95
3 0,741 100,89 0,95
Keterangan : Luas film 5,3066 cm²
4.
Hasil Uji Homogenitas Terbutalin Sulfat Formula ab
Replikasi Uji Absorbansi C (ppm) C (mg/luas film) X rata-rata ± SD SD rel (%) 1
1 0,739 100,62 0,95
0,95 ± 0,01 0,69
2 0,743 101,16 0,95
3 0,733 99,79 0,94
2
1 0,740 100,75 0,95
0,95 ± 0,00 0,34
2 0,735 100,07 0,94
3 0,738 100,48 0,95
3
1 0,745 101,44 0,96
0,95 ± 0,01 0,67
2 0,736 100,21 0,94
3 0,737 100,34 0,95
LAMPIRAN D
PERHITUNGAN
ADHESION TIME
FILM
BUCCOADHESIVE
TERBUTALIN SULFAT
Formula
Replikasi
t (detik)
X rata-rata ± SD
-1
1
600
695,00 ± 90,42
2
780
3
705
a
1
1630
1527,33 ± 114,41
2
1548
3
1404
b
1
927
1038,00 ± 98,50
2
1072
3
1115
ab
1
1697
1584,67 ± 117,84
2
1462
LAMPIRAN E
PERHITUNGAN
SWELLING INDEX
FILM
BUCCOADHESIVE
TERBUTALIN SULFAT
Formula Replikasi
Xo
Xt
Swelling
Index
X rata-rata ±
SD
SD
rel
(%)
-1
1
0,045
0,087
0,95
0,95 ± 0,01
1,57
2
0,046
0,090
0,96
3
0,044
0,084
0,93
a
1
0,046
0,129
1,80
1,80 ± 0,01
0,63
2
0,047
0,132
1,78
3
0,050
0,139
1,81
b
1
0,048
0,106
1,22
1,24 ± 0,01
1,07
2
0,049
0,110
1,25
3
0,049
0,110
1,24
ab
1
0,047
0,136
1,91
1,91 ± 0,01
0,59
2
0,048
0,138
1,90
3
0,048
0,141
1,92
LAMPIRAN F
PERHITUNGAN UJI PELEPASAN FILM
BUCCOADHESIVE
TERBUTALIN SULFAT
1.
Hasil Uji Pelepasan Terbutalin Sulfat Formula -1
Replikasi t (jam) Absorbansi Cn' (ppm) Q (µg/cm²)
1
0,08 0,019 1,99 24,33
0,17 0,027 3,08 37,75
0,25 0,030 3,49 42,79
0,33 0,042 5,14 62,92
0,42 0,046 5,68 69,63
0,50 0,055 6,92 84,74
1,00 0,058 7,33 89,77
2,00 0,074 9,52 116,62
3,00 0,099 12,95 158,56
4,00 0,136 18,01 220,65
5,00 0,189 25,27 309,58
6,00 0,278 37,47 458,91
2
0,08 0,036 4,32 52,85
0,17 0,040 4,86 59,57
0,25 0,044 5,41 66,28
0,33 0,062 7,88 96,48
0,42 0,079 10,21 125,01
0,50 0,087 11,30 138,43
1,00 0,089 11,58 141,79
2,00 0,103 13,49 165,28
3,00 0,131 17,33 212,26
4,00 0,158 21,03 257,56
5,00 0,176 23,49 287,77
6,00 0,286 38,56 472,34
3
0,08 0,027 3,08 37,75
0,17 0,035 4,18 51,18
0,25 0,024 2,67 32,72
0,33 0,058 7,33 89,77
0,42 0,063 8,01 98,16
0,50 0,076 9,79 119,97
1,00 0,081 10,48 128,36
2,00 0,098 12,81 156,89
3,00 0,122 16,10 197,16
4,00 0,167 22,26 272,66
5,00 0,199 26,64 326,36
2.
Hasil Uji Pelepasan Terbutalin Sulfat Formula a
Replikasi t (jam) Absorbansi Cn' (ppm) Q (µg/cm²)
1
0,08 0,015 1,44 17,62
0,17 0,027 3,08 37,75
0,25 0,035 4,18 51,18
0,33 0,030 3,49 42,79
0,42 0,043 5,27 64,60
0,50 0,058 7,33 89,77
1,00 0,071 9,11 111,58
2,00 0,085 11,03 135,07
3,00 0,128 16,92 207,22
4,00 0,155 20,62 252,53
5,00 0,167 22,26 272,66
6,00 0,238 31,99 391,80
2
0,08 0,019 1,99 24,33
0,17 0,021 2,26 27,69
0,25 0,029 3,36 41,11
0,33 0,037 4,45 54,53
0,42 0,040 4,86 59,57
0,50 0,052 6,51 79,70
1,00 0,063 8,01 98,16
2,00 0,076 9,79 119,97
3,00 0,134 17,74 217,29
4,00 0,169 22,53 276,02
5,00 0,183 24,45 299,51
6,00 0,249 33,49 410,25
3
0,08 0,016 1,58 19,30
0,17 0,017 1,71 20,97
0,25 0,021 2,26 27,69
0,33 0,052 6,51 79,70
0,42 0,064 8,15 99,84
0,50 0,069 8,84 108,23
1,00 0,082 10,62 130,04
2,00 0,099 12,95 158,56
3,00 0,126 16,64 203,87
4,00 0,145 19,25 235,75
5,00 0,181 24,18 296,15
3.
Hasil Uji Pelepasan Terbutalin Sulfat Formula b
Replikasi t (jam) Absorbansi Cn' (ppm) Q (µg/cm²)
1
0,08 0,018 1,85 22,65
0,17 0,036 4,32 52,85
0,25 0,041 5,00 61,24
0,33 0,053 6,64 81,38
0,42 0,058 7,33 89,77
0,50 0,063 8,01 98,16
1,00 0,079 10,21 125,01
2,00 0,097 12,67 155,21
3,00 0,141 18,70 229,04
4,00 0,173 23,08 282,73
5,00 0,250 33,63 411,93
6,00 0,269 36,23 443,81
2
0,08 0,030 2,49 42,79
0,17 0,048 5,96 72,99
0,25 0,057 7,19 88,09
0,33 0,064 8,15 99,84
0,42 0,075 9,66 118,29
0,50 0,078 10,07 123,33
1,00 0,082 10,62 130,04
2,00 0,101 13,22 161,92
3,00 0,121 15,96 195,48
4,00 0,156 20,75 254,21
5,00 0,239 32,12 393,47
6,00 0,287 38,70 474,02
3
0,08 0,038 4,59 56,21
0,17 0,054 6,78 83,06
0,25 0,066 8,42 103,19
0,33 0,077 9,93 121,65
0,42 0,082 10,62 130,04
0,50 0,091 11,85 145,14
1,00 0,102 13,36 163,60
2,00 0,123 16,23 198,83
3,00 0,146 19,38 237,43
4,00 0,184 24,59 301,19
5,00 0,265 35,68 437,10
4.
Hasil Uji Pelepasan Terbutalin Sulfat Formula ab
Replikasi t (jam) Absorbansi Cn' (ppm) Q (µg/cm²)
1
0,08 0,014 1,30 15,94
0,17 0,022 2,40 29,36
0,25 0,032 3,77 46,14
0,33 0,039 4,73 57,89
0,42 0,045 5,55 67,96
0,50 0,068 8,70 106,55
1,00 0,082 10,62 130,04
2,00 0,105 13,77 168,63
3,00 0,121 15,96 195,48
4,00 0,147 19,52 239,11
5,00 0,173 23,08 282,73
6,00 0,229 30,75 376,70
2
0,08 0,017 1,71 20,97
0,17 0,033 3,90 47,82
0,25 0,035 4,18 51,18
0,33 0,053 6,64 81,38
0,42 0,055 6,92 84,74
0,50 0,061 7,74 94,80
1,00 0,070 8,97 109,90
2,00 0,099 12,95 158,56
3,00 0,118 15,55 190,45
4,00 0,134 17,74 217,29
5,00 0,185 24,73 302,87
6,00 0,219 29,38 359,92
3
0,08 0,034 4,04 49,50
0,17 0,041 5,00 61,24
0,25 0,046 5,68 69,63
0,33 0,062 7,88 96,48
0,42 0,067 8,56 104,87
0,50 0,076 9,79 119,97
1,00 0,193 12,12 148,50
2,00 0,121 15,96 195,48
3,00 0,139 18,42 225,68
4,00 0,156 20,75 254,21
5,00 0,201 26,92 329,71
Keterangan:
-1 : gelatin dan gliserin konsentrasi rendah
a : gelatin konsentrasi tinggi dan gliserin konsentrasi rendah
b : gelatin konsentrasi rendah dan gliserin konsentrasi tinggi
ab: gelatin dan gliserin konsentrasi tinggi
LAMPIRAN G
ANALISA FAKTORIAL DESAIN
ADHESION TIME
Use your mouse to right click on individual cells for definitions.
Response
3
adhesion time
ANOVA for selected factorial model
Analysis of variance table [Partial sum of squares - Type III] Sum of Mean F p-value Source Squares df Square Value Prob > F
Model 1,608E+006 3 5,359E+005 47,79 < 0,0001 significant A-Gelatin 1,426E+006 1 1,426E+006 127,19 < 0,0001
B-Gliserin 1,202E+005 1 1,202E+005 10,72 0,0113 AB 61204,08 1 61204,08 5,46 0,0477
Pure Error 89707,33 8 11213,42
Cor Total 1,697E+006 11
Values of "Prob > F" less than 0,0500 indicate model terms are significant.
In this case A, B, AB are significant model terms.
Values greater than 0,1000 indicate the model terms are not significant.
If there are many insignificant model terms (not counting those required to
support hierarchy),
model reduction may improve your model.
Final Equation in Terms of Coded Factors:
adhesion time
=
+1211,25
+344,75
* A
+100,08
* B
-71,42
* A * B
Final Equation in Terms of Actual Factors:
adhesion time
=
+1211,25000
+344,75000
* Gelatin
+100,08333
* Gliserin
LAMPIRAN H
ANALISA FAKTORIAL DESAIN
SWELLING INDEX
Use your mouse to right click on individual cells for definitions.
Response
2
swelling index
ANOVA for selected factorial model
Analysis of variance table [Partial sum of squares - Type III] Sum of Mean F p-value
Source Squares df Square Value Prob > F
Model 1,88 3 0,63 3872,16 < 0,0001 significant
A-Gelatin 1,74 1 1,74 10727,13 < 0,0001 B-Gliserin 0,12 1 0,12 742,79 < 0,0001 AB 0,024 1 0.024 146,55 < 0,0001
Pure Error 1,298E-003 8 1,623E-004
Cor Total 1,89 11
Values of "Prob > F" less than 0,0500 indicate model terms are significant.
In this case A, B, AB are significant model terms.
Values greater than 0,1000 indicate the model terms are not significant.
If there are many insignificant model terms (not counting those required to
support hierarchy),
model reduction may improve your model.
Final Equation in Terms of Coded Factors:
swelling index
=
+1,47
+0,38
* A
+0,10
* B
-0,045
* A * B
Final Equation in Terms of Actual Factors:
swelling index
=
+1,47164
+0,38086
* Gelatin
+0,10022
* Gliserin
LAMPIRAN I
ANALISA FAKTORIAL DESAIN UJI PELEPASAN
Use your mouse to right click on individual cells for definitions.
Response
4
pelepasan
ANOVA for selected factorial model
Analysis of variance table [Partial sum of squares - Type III] Sum of Mean F p-value Source Squares df Square Value Prob > F
Model 220,77 3 73,59 8,47 0,0073 significant
A-Gelatin 149,13 1 149,13 17,16 0,0032 B-Gliserin 2,56 1 2,56 0,29 0,6023 AB 69,09 1 69,09 7,95 0,0225
Pure Error 69,50 8 8,69
Cor Total 290,28 11
Values of "Prob > F" less than 0,0500 indicate model terms are significant.
In this case A, AB are significant model terms.
Values greater than 0,1000 indicate the model terms are not significant.
If there are many insignificant model terms (not counting those required to
support hierarchy),
model reduction may improve your model.
Final Equation in Terms of Coded Factors:
pelepasan
=
+57,80
-3,53
* A
-0,46
* B
-2,40
* A * B
Final Equation in Terms of Actual Factors:
pelepasan
=
+57,79892
-3,52525
* Gelatin
-0,46158
* Gliserin
LAMPIRAN J
LAMPIRAN K
LAMPIRAN L


