Volume 11 • Number 1 • 2015
Institute of APEC Collaborative Education (IACE)
Table of Contents
Research Article
Indonesian Students’ Multicultural Awareness in Homogeneously
and Heterogeneously Populated Schools and Multicultural
Education Policy
1
Dairabi Kamil, Amirul Mukminin
Correlates of Parental Attention and Criminal Behaviour
among Students of Borstal Institutions in Nigeria
17
Adesoji Oni, Manafa Fausta
Does Satellite Television Programing Satisfy
Ethiopian Secondary School Students?
27
SungWan Kim, Gebeyehu Bogale
Empowering Girls and Women for Educational
Opportunities in Nigeria: Policy Initiatives, Situation Analysis,
Challenges and the Way Forward
41
Ramoni Ayobami Alani
A Comparative Study of Instruments Used in the Quality
Assurance for Internationalization of Higher Education
57
JhongKyu Leeh
Field Report
The Acceleration of Students Mastery on Standard
Competence and Basic Competence by Utilizing BABE DENA
: The Simple Natural Substance and Used Material
79
Indonesian Students’ Multicultural Awareness in
Homogeneously and Heterogeneously Populated Schools
and Multicultural Education Policy
Dairabi Kamil*
Center for Research and Community Service Islamic State College of Kerinci, Indonesia.
Amirul Mukminin
Jambi University, Indonesia.
ABSTRACT
The purposes of this inquiry were to seek the multicultural awareness of students at
homogeneously and heterogeneously populated schools in the Municipality of Sungai Penuh, Jambi, Indonesia. Data were collected through administrating the adapted version of Multicultural Awareness Scale to 334 students from one homogeneously populated senior high school and one heterogeneously populated madrasah aliyah (Islamic senior high school). Data were analyzed by
using Rasch Analysis and tests of inferential statistics. The results of data analyses indicated that 1) the students had a relatively high multicultural awarness, 2)the examination on the map of item endorsabilty indicated that the students had high cultural awareness but low self-awareness,
3) the students at the heterogeneously populated madrasah aliyah had a higher multicultural awareness than their counterparts at the homogeneously populated senior high school, and 4) no statistically significant differences were found in the comparisons of the students’ awareness across the demographic variables across and within the same school. Policy implications and
suggestions for future research are also discussed.
Keywords : Multicultural Awareness, Indonesian Students, Multicultural Education.
Introduction
The urgency of implementing multicultural education in Indonesia has been
proposed by several scholars, such as Al-Arifin (2012), Mukharis (2011), Muslimin
(2012),and Tan (2006), who claim that the idea has been based on some major
intercultural conflicts in the country in the last two decades. Thus, it seems that there
is a commonly shared belief among multicultural education supporters in the country
that the root of the conflict is in the degradation of the people’s multicultural
awareness and competence. Hence, providing the education through curricular activities
in formal education may eventually solve the problems. The literature, furthermore,
proposes some foreign models of multicultural education to be adopted into Indonesian
contexts of education. However, it is important to note that the models have particular
historical backgrounds that are different from Indonesian contexts. Thus, they are not
necessarily compatible with settings in Indonesia. For example, themulticultural
education movement in the U.S. in 1960s and 1970s was influenced by cultural,
social, and historical backgrounds (Banks, 2002; Bennett, 2003; Blum, 1997; Nieto &
Bode, 2008) including inequalities in socio-economic and educational sectors. In
addition, other works on multicultural education (e.g. Gay, 2004; Gorski & Covert,
1996; Mwonga, 2005) suggest that the idea of multicultural education has gone
through some reconceptualization across time and contexts, suggesting that if Indonesia
is to embark onmulticultural education programs, it should first fully identify the
status and features of its own indigenous multiculturalism. Therefore, careful planning
and policies based on empirical research is of paramount importance. However, much
of the literature on multicultural education in Indonesia is discursive in nature. The
discussions of the issue are mostly theoretical and conceptual, particularly on
multicultural awareness as part of multicultural education. More importantly, very few
are informed by empirical research conducted in Indonesian contexts.
For multicultural awareness, as one of the essential elements of multicultural
competence, it is the first foundation to identify and develop towards a holistic
multicultural competence (Boutte, 1998; DuPraw&Axner, 1997; Sue, Arredondo,
&McDavis, 1992). Thus, poor multicultural awareness is likely to serve as an
antecedent to poor multicultural competence (Awang-Shuib, Sahari, & Ali, 2012;
Osman-Gani&Rockstuhl, 2009). However, as accounts on the history of multicultural
education has shown us (Blum, 1997; Gay, 2004; Gorski and Covert, 1996;
Mwonga, 2005), not all phenomena of cultural conflicts are necessarily to be
directly linked to the issue of multicultural awareness that multicultural education
should take a considerable portion of the curriculum and be uniformly implemented
across a system of education. Hence, mapping the multicultural awareness of the
However, the literature on multicultural education in Indonesia is still lacking
such information. Also, at the global level, research related to multicultural issues
is mostly conducted on teachers. Therefore, this study wasmeant to fill this gap by
mapping the multicultural awareness of students at a homogeneously and a
heterogeneously populated senior high school in Indonesia. Comparing the two
contexts is hypothesized based on a frame of thought that exposure to a culturally
heterogeneous environment would better improve one’s multicultural awareness than
to the homogeneous one.Specifically, this study was guided by the following
research questions:
(1) How is the multicultural awareness of the students in the two schools?
(2) Are there statistically significant differences in the students’ multicultural
awareness between the two schools?
(3) Are there statistically significant differences in the students’ multicultural
awareness across the demographic variables of gender, previous school location, and
grades?
Methods
Research Site and Participants
The respondents of this study were 334 conveniently selected students at one
homogeneously populated senior high school and one heterogeneously populated
madrasah aliyah(Islamic senior high school) in the Municipality of Sungai Penuh,
Jambi, Indonesia. The selection of these two schools matched to the main purpose
of the study, to seek the multicultural awareness of students at homogeneously and
heterogeneously populated schools. The students of the homogeneously populated
school were mostly from villages near the school and areas of the same sub-district
that share the same sub-dialect of Kerinci, customs, and traditions. While students
of the heterogeneously populated schools were from various villages and
sub-districts in the Municipality of Sungai Penuh and the Regency of Kerinci, and
of different sub-dialects, customs, and traditions. For the ethical consideration, the
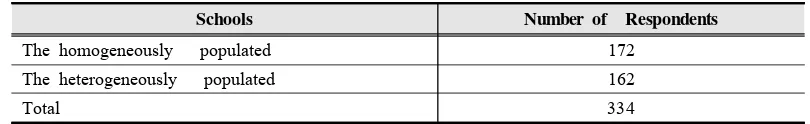
two schools’ names were kept anonymous in this report. The number of
Schools Number of Respondents
The homogeneously populated 172
The heterogeneously populated 162
Total 334
Table 1. Respondents of the Study
Data Collection Methods
Data were collected through administrating the Awang-Shuib, Sahari, and Ali’s
(2012) 12-item Multicultural Awareness Scale (MAS). The items of the scale were
initially adapted from the Henry’s (1995) 28-items Cultural Diversity Awareness
Inventory (CDAI) and from Goode, Dunne, and Bronheim’s (2006) 25-item “values
and attitude” subscale of Self-Assessment Checklist. The total number of items
from the two scales was 53. As the items were originally developed for measuring
multicultural awareness in western contexts and specific professional settings that
were different from theirs, i.e. Malaysian contexts, Awang-Shuib, Sahari, and Ali
(2012) conducted an expert judgment procedure to select items that would best suit
it. The process yielded 12 items, which were furthermore re-phrased to better tap
the intended research objectives. The scale measures two factors of multicultural
awareness, i.e. Self-Awareness (6 items) that assesses awareness on the cultural
differences from one’s perspectives,and Culture Awareness(6 items) that examines
awareness on socio-cultural differences such as on family, gender, age, religion, and
custom and beliefs. These items come with 5-level Likert type responses (Strongly
Agree, Agree, Uncertain, Disagree, and Strongly Disagree). They reported that the
results of the pilot study of the scale showed that the first factor accounted 28, 23
% of the variance with an eigenvalue of 2, 82 and a Cronbach alpha reliability
coefficient of 0, 78 while the second factor accounted 27, 46 % of the variance
with an eigenvalue of 2, 75 and a reliability coefficient of 0, 79.
As the original version of MAS is in English, for the purpose of the study, it
is translated into Indonesian with some minor wording adjustments. To evaluate its
suitability with the context and the purposes of the research, expert judgment of
MAS was also conducted, and the results supported the use of it in the current
study. However, further evaluation of the psychometric properties of the scale in
Data Analysis
The data were analyzed by using Rasch analysis and tests of inferential statistics
and the analysis was conducted in two stages. In the first stage, the psychometric
properties of the instruments and responses were evaluated for the validity and reliabilityof the study, while the second stage sought to answer the research
questions. Specifically, the adoption of Rasch analysis in this study is based on the
fact that it has the necessary features needed to successfully address the
quantitative research. First, it facilitates the conversion of the questionnaire’s
non-linear ordinal data into interval ones and measures them on a common linear logit scale (Wright, 2000). Second, the Rasch analysis is sensitive tothe
idiosyncrasies of persons and items. For example, itgives information about the
unique values of individual thresholds among categories in each item of polytomous
data (Bond & Fox, 2001). This way, a wider access will be available, is not only for better information about a person’s ability and item difficulty, but also for a
more precise and comprehensive identification of the nature of the persons and
items. Third, Rasch analysis allows evaluation even though respondents do not
answer every item. Fourth, it also simplifies thecommunication of results in the
form of graphical summaries of population and detailed individual profiles in a way that would be easily understood and interpreted by educators, policy makers and
the concerned public (Wright, 2000). Research also shows that Rasch analysis is
easy to apply in a wide variety of situations (Andrich, 1975; Connolly, Nachtman,
& Pritchett, 1971; Rentz&Bashaw, 1975; Wilmott&Fowles, 1974; Woodcock, 1974).
Findings
This section is devided into two subsections. The first subsection, as
mentiononed in the previous section, presents the evaluation of the pschometric
properties of the scale, while the second one will present the results of data
analysis that answer the research questions.
The Psychometric Properties of MAS
The evaluation of the psychometric properties of a scale addresses the issue of
validity and reliability of the data. As Rasch analysis necessitates validity and
unidimensionality of the measurement instrument and requires responses that fit the
these issues was conducted on the data from the 334 respondents. Bond and Fox
(2001) suggest two sets of general guidelines to help to assess the validity of a set
of measure. First, by assessing the extent to which all the items work together to
measure a single construct or variable. In Rasch Analysis this information is given
by two indices: Item polaritythat indicates the extent to which the items are
working in the same in direction on the construct being examined, and item fit
statistics that shows the extent to which the items are contributing in the same
meaningful/useful way to the construction of the construct. Second is by examining
item ordering, that isdone by examining the consistency between the empirical item
order and the theoretical or experimental basis for item development. Two indices
were used to evaluate this. First is the item reliability index, and, second istheitem
separation index. The item reliability index indicates the reproducibility of item
ordering, whereas item separation indexshows the extent to which the items are
separated to define a continuum of increasing intensity. The parts to come of this
subsection will display the item polarity, the item fit statistics, the item
reliabilityand item separation indexes, and unidimensionalityof the scale.
Information on the item polarity is given by values denoted by point measure
correlation(PTMEA CORR), which has a range of -1 to +1. The directionality of
the items is indicated by positive values. Table 2 presents the item polarity for all
the items. The table shows that all the items have positive point measure
correlation values, indicating that all the items are working in the same direction
on the construct being examined.
The contribution of the items to the construction of the construct is indicated by
values denoted by outfit mean-squares (OMS) and infitmean-squares (IMS). Items
that are productive for measurement would have an OMS and IMS of 0.5 to 1.5
(Linacre, 2006). Greater attention, however, should be paid to high values denoted
by the IMS for indicating misperformance of the items upon the people whom they
are targeted, hence, a greater threat to validity (Linacre, 2003a).Overall, the fit
statistics (see Table 2) shows that except for item 7, all the items have an IMS
that is within the range of 0.5 to 1.5. Arnadottir and Fisher (2008) suggest that
misfitting items with mean-squares outside the tolerable range degrade the
measurement and, thus, a serious threat to validity.
Therefore, for the rest of data analysis, item 7 was removed. Item Reliability
and Item Separation Indexesprovide information on the extent to which the items in
the scale are separated to define a continuum of increasing intensity. Table 3
presents the summary of the information after the deletion of item 7.
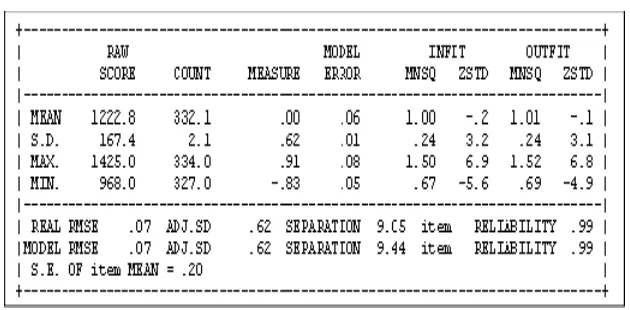
Table 3. Item Reliability and Item Separation Indexes
The reliability index of item difficulty estimate of .99 is almost perfect. This
indicates a high probability that the similar order of items would be produced if
the set of questionnaire wereadministered to other comparable samples. Item
Separation Index of 9.44 indicates that the items can be classified into almost 3
levels of endorsability. Unidimensionality in Rasch analysis refers to the extent to
which a measurement instrument measures a single attribute or dimension of the
examinees at a time (Bond & Fox, 2001). This is because a measurement will be
(2006) suggests that unidimensionality is always approximate. It is never perfect. In
Rasch analysis assessment of the dimensionality of a measurement instrument is
usually conducted through Principal Component Analysis (PCA). However, different
from common factor analysis that seeks to construct variables, PCA in Rasch
analysis is conducted on residuals and aims to explain variance (Linacre, 2006).
And if the result of the PCA suggests the presence of other dimensions in the
data, it is indicative, not definitive. To ensure that the presence of the misfits in
the data is random and does not indicate the existence of a second dimension (or
if it does, its size is not degrading the unidimensionality of the measurement), an
examination of dimensionality Map through Principal Component Analysis (PCA),
as detailed in the following section,was conducted.
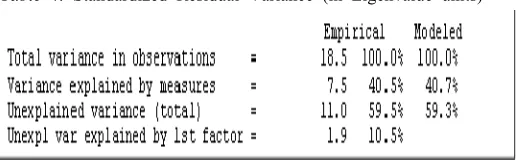
The results (Table 4) show that the largest factor extracted from the residuals is
1.9 units (10.5%), which means that it has a strength of almost 2 items- lower
than the strength of two items, the smallest amount that could be considered a
"dimension" (Linacre, 2006). This indicates the abesence of another dimension in
the scale.
Table 4. Standardized Residual Variance (in Eigenvalue units)
The Respondents’ Multicultural Awareness
The purposes of this quantitative inquiry were to seek the multicultural
awareness of students at homogeneously and heterogeneously populated schools and
to determine whether there are statistically significant differences on the awareness
across the demographic variables of gender, grade, and previous schooling
experience. The multicultural awareness of the respondents in the two schools is
Figure 1. Person Map: Homogeneously Populated School
Figure 2. Person Map: Heterogeneously Populated School
Both figures show that, overall, the respondents in the schools had a
considerably high multicultural awareness. This was indicated by the mean (M) of
the respondents’ agreement with the items that are higher than the mean (M) of
the items’ endorsability. Figure 1 shows that the mean of the respondents’
of the items’ endorsability. Similarly, figure 2 shows that the mean of the
respondents’ agreement in the heterogeneously populated school is exactly 1 logit
above that of the item endorsability.
<more>|<rare>
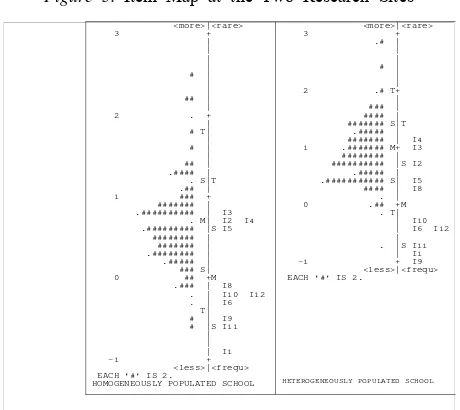
Figure 3. Item Map at the Two Research Sites
Additionally, item maps at the two research sites can be seen in the figure 3.
A closer examination of item maps shows a similar trend in the item endorsability
in the two schools. The items are partitioned in two clusters. One cluster is located
above the mean and the other one is located below the mean. An interesting fact
is that the cluster that is above the mean is dominated by the items from the
Self-Awareness factor of the scale, while the lower one is dominated by items
from the Culture Awareness factor of the scale. These seem to indicate that the
respondents have higher culture awareness than self-awareness.
Furthermore, Figure 3 also shows that in the homogeneously populated school,
item 3 (I am comfortable in settings with people who exhibit cultural values
different from my own) is the least endorsable one, and item 1 (I believe my
culture to be different from the others around me) is the most endorsable one. In
addition, the first three of the least endorsable items in the both contexts of this
item 3 assess the respondents’ preference and comfort to work with and to be with
people of other cultures while item 4 deals with the use of local language.
Inferential Statistics Comparisons of the Respondents’ Multicultural Awareness
Tests of non-parametric statistics were conducted to compare the multicultural
awareness of the respondents at the two schools for statistically significant
differences in general and across the demographic variables of gender, previous
school location, and grades, both between schools and within the same school. This
was because the data were not normally distributed. Mann-Whitney-U test indicates
a significant difference in the multicultural awareness between the homogeneously
and heterogeneously populated schools with Mean Rank=14, 02 and 18, 12
respectively,U= 10753.500, Z=-3.614, p=.000. This indicates the respondents in the
heterogeneously populated school have a higher multicultural awareness than their
counterparts in the homogeneously populated school. However, comparison across
the demographic variable of gender did not show any significant difference between
the male (n=156) and female (n=154) respondents, U=11411.500, Z=-.763,p=445.In
addition, in this study the respondents were also categorized based on their previous
school locations. Distinction was made between those with “home” (n=224) and
“away” (n=76) schooling experience. This is based on a hypothesized logical basis
that those who have “away” schooling experience might have moreexposureto other
cultures and therefore would have better multicultural awareness. Comparison of the
multicultural awareness between the respondents of the two categories, however, did
not indicate any significant difference, U=7682.000, Z=-1.274, p=.203.
Within the same school, comparisons for significant differences using
Mann-Whitney-U test were conducted across the demographic variables of gender,
grade, and previous school locations. In the homogeneously populated school, no
significant differences were found across the three variables, U=2405.000, Z=-1.279,
p=.201 for gender, U=2405.000, Z=-1.279, p=201 for grade, and U=1215.500,
Z=-.77, p=.938 for previous school locations.Similarly, no significant differences
were observed in the respondents of the heterogeneously populated school across
the three variables, U=3259.500, Z=-.071, p=.944 for gender, U=1690,Z=-1.829,
p=.067 for grade, and U=2699.500, Z=8477.500, p=.389 for previous school
Discussion
The purposes of this quantitative inquiry were to seek the multicultural
awareness of students at homogeneously and heterogeneously populated schools and
to determine whether there are statistically significant differences in theawareness
across the demographic variables of gender, grade, and previous schooling
experience through administrating the adapted version of Multicultural Awareness
Scale to 334 students from one homogeneously populated senior high school and
one heterogeneously populated madrasah aliyah(Islamic senior high school) in
Jambi, Indonesia.The findings of the study revealed that although the multicultural
awareness of the respondents at the two schools was relatively high, the
observation of the endorsability map of the scale’s items indicated that they scored
low on items assessing the self-awareness dimension of the scale. The findings
suggested that, in other words, the respondents at the two schools had high cultural
awareness but low self-awareness. In particular, the respondents showed low
agreement with items that address their preference and comfort to work with and
to be with people from other cultures and the use of local language. Similar
phenomenon was also observed by Koyama, Plash, and Davis (2012) in their study
of Cross-Cultural Multicultural Self-Awareness among K-12 in-service school
teachers in the U.S. They found that more than half of the respondents felt
uncomfortable to work with students who had different values from their own.
Another major finding of this study revealed the statistically significant
difference in the respondents’ multicultural awareness across the two schools was
that overall respondents at the heterogeneously populated school showed higher
awareness than their counterpart at the homogeneously populated school. Within the
scope of the study, this finding seems to confirm the frame of thought mentioned
in the introductory part of this report, that exposure to a culturally heterogeneous
environment would better improve one’s multicultural awareness than to a
homogeneous one. The current study also identified no significant differences in the
respondents’ multicultural awareness across the demographic variables of gender,
school, grade, and previous school locations. These findings are in line partly with
Collins (2009) who studied “Cultural Diversity Awareness of Elementary School
awareness of the teachers, he found that the teachers scored highest in the general
cultural awareness domain of the inventory. He also found no significant difference
in his respondents’ cultural diversity awareness across the variables of race, gender,
level of education, years teaching experience, and exposure to or experience with
multicultural education training. However, as the current study is preliminary in
nature and limited in scope, at this stage of study, such concordance is not to lead
to any justification and conclusion regarding the partial similarity as the respondents
of the current study and those of Collins’ study were different in terms of cultural,
social, and economic characteristics.
However, our findings should take into account some limitations. Firstly,
participants may not be representative of all Indonesian senior high students. There
may be differences between themulticultural awareness of the Indonesian senior
high school students who live in rural, remote, and urban places, as in Indonesia
every culture and island has its own characteristics. Therefore,generalizingthe
findings to other Indonesian students is cautioned. Future research may include a
larger sample of Indonesian senior high school students from different areas and
characteristics, which may provide different findings on Indonesian students’
multicultural awareness. Secondly, in terms of data collection methods, this study
was limited to the use of the adapted version of Multicultural Awareness Scale
(MAS),future research could investigate the perspectives of Indonesian students’
multicultural awareness through in-depth interviews and observation. Third, the
current study is preliminary in nature. Yet, regarding the findings of this study, as
long as the researchers are concerned, it maps the gap between the respondents’
self-awareness and their cultural awareness that has not been drawn before in
Indonesian context. Other investigators may replicate and extend our study to a
larger sample of Indonesian senior high school students across diverse schools and
cultures. Further research with a larger coverage is needed to map other areas that
were not covered and fully explored in this study, such as the extent to which
students’ ethnicity, ethnic majority and minority status are related to their
Conclusions and Multicultural Education Policy
Schools are intended to develop and provide students with understanding, values,
perspectives, attitudes, knowledge, skills, and behaviors needed to participate “within
their ethnic cultures, within the mainstream cultures, and within and across other
ethnic cultures” (Banks, 2002, p. 40). Therefore, developing students’ cultural
awareness means helping them to recognize and to be aware of the variety of
ideas and practices found around the world and “some recognition of how one’s
own thoughts and behaviors might be perceived by members of differing nations
and ethnic groups” (Bennett, 2003, p. 305). Overall, the findings of this study,
although preliminary in nature and limited in scope, contribute to fill the gap on
the literature on multicultural education in Indonesia.
Also, the findings of this study shed light on our understanding of how
multicultural awareness of students in a homogeneously and a heterogeneously
populated schools looks like at local levels in Indonesian contexts. One of the
important findings in our study is that the multicultural awareness of the
respondents in the heterogeneously populated school is significantly higher than that
of the respondents in the homogeneously populated school. This suggests that, to
some extent, the multicultural awareness of the respondents of this study were not
uniform. This evidences that policymakers, teachers, educational leaders at national,
local, and school levels should take into account that uniform multicultural
education programs for all contexts and settings are not recommended as
multicultural issues and status might be different from one context to another, and
change from time to time.
Additionally, the findings suggest that developing and designing multicultural
education curriculum and programs should be research based and school-based
syllabus development should be conceptualized as a collaborative action among a
number of related parties. The findings of this study should become inputs for
school leaders and teachers who are interested in changing their school to be more
aware through multicultural education programs or policies so that they have
intercultural competences that will help them to interpret intentional communications
(languages), some unconscious signs, and customs or traditions that are not similar
References
Al Arifin, A. H. (2012). Implementasi pendidikan multikultural dalam praksis pendidikan di Indonesia. Jurnal Pembanguan Pendidikan, 1(1), 72-82.
Andrich, D. (1975). The rasch multiplicative binomial model: Applications to attitude data. Department of Education, University of Western Australia: Measurement and Statistics Laboratory.
Arnadottir, G. & Fisher, A.G. (2008). Rasch analysis of the ADL scale of the A-ONE. The American Journal of Occupational Therapy, 62, 51-60.
Awang-Shuib, A.R., Sahari S.H., & Ali, A. J. (2012).Multicultural awareness and urban communities: Validating a multicultural awareness scale. Journal of ASIAN Behavioural Studies, 2 (6), 50–62. Banks, J. A. (2002). An introduction to multicultural education. Boston: Pearson and AB Longman. Bennett, C. I. (2003). Comprehensive multicultural education: Theory and practice. Boston: Pearson
and AB Longman.
Blum, L. (1997). Multicultural education as values education. Cambridge, MA: Harvard Project. Bond, T. G., & Fox, C. M. (2001). Applying the rasch model. Fundamental measurement in the
human sciences. Mahwah, NJ: Lawrence Erlbaum and Associates.
Boutte, G. (1999). Multicultural education: Raising consciousness. Atlanta: Wadsworth.
Collins, S.E. (2009).Cultural diversity awareness of elementary school teachers in Georgia classrooms (Doctoral Dissertasion). Available: http://digitalcommons.georgiasouthern.edu/ cgi/viewcontent.cgi? article= 1220&context=etd
Connolly, A. J., Nachtman, W., & Pritchett, E. M. (1971).CirclePines,Minn.:AmericanGuidanceService. DuPraw, M.E. and Axner, M. (1997). Working on common cross-cultural communication challenges.
Toward a more perfect union in an age of diversity.Available: http:// www.pbs.org/ampu/ crosscult/html.
Gay, G. (2004). Curriculum theory and multicultural education. In J.A. Banks & C.A.M.Banks (Eds.), Handbook of research on multicultural education (2nd ed., pp. 30-49). San Francisco: Jossey-Bass. Goode, T. D, Dunne, M.C., &Bronheim, S. M. (2006). The evidence base for cultural and linguistic
competency. Available: http:// www.commonwealthfund.org/publications/ publications_ how.htm? doc_ id=413821
Gorski, P., & Covert, B. (1996) Defining of multicultural education.Available: http://curry.edschool. virginia.edu/go/multicultural/initial.html.
Guttman, L. (1950). The basis for scalogram analysis. In S. A. Stouffer, Louis Guttman, Edward A. Suchman, (Eds.), Measurement and prediction (pp. 60–90). Princeton, NJ: Princeton University Press. Henry, G. B. (1995).Determining the reliability and validity of the cultural diversity awareness
inventory (CDAI) (Doctoral Dissertasion). Available: http://proquest.umi.com/pqd web/?did= 741212581&Fmt=7&clientId=27905&RQT=309&VName=PQD
Linacre, J. M. (2003a). Size vs. significance: Standardized chi-square fit statistics. Rasch Measurement Transactions, 17, 918.
Linacre, J.M. (2006). Winsteps:RaschMeasurementComputerProgram.Version3.60,Winsteps.com, Chicago. Mukharis. (2011). Nilai-nilai pendidikan karakter dalampelajaran al-quran dan al-hadist. Yogyakarta:
Program Pascasarjana UIN SunanKalijaga.
Muslimin. (2012, Desember).Pendidikan multikultural sebagai perekat budayanusantara: Menuju indonesia yang lebihbaik. Paper pada Seminar Internasional Multikultural dan Globalisasi, FIB UI, Indonesia. Mwonga, C. (2005). Multicultural education: New path toward democracy. Upper Saddle River, NJ:
Merrill.
Nieto, S. and Bode, P. (2008). Affirming diversity: The socio-political context of multicultural education, 5thEdition.Boston:PearsonandABLongman.
Osman-Gani, A., &Rockstuhl, T. (2009). Cross-cultural training, expatriate self-efficacy, and adjustments to overseas assignments: An empirical investigation of managersin Asia. International Journal of Intercultural Relations, 33, 277-290.
Rentz, R. R. &Bashaw, W. L. (1975).Athens,Georgia:EducationalResourceLaboratory.
Sue, D. W., Arredondo, P., &McDavis, R. J. (1992). Multicultural counseling competencies and standards: A call to the profession. Journal of Counseling and Development, 70, 477-486. Tan, S. (2006). Pendidikan multikulturalisme : Solusi ancaman disintegrasi bangsa. Jurnal
Antropologi Sosial Budaya, 2 (1), 32-34.
Wilmott, A., &Fowles, D. (1974). AtlanticHighlands,N.J.NFERPublishingCo.,Ltd.
Woodcock, R.W. (1974).Woodcock Reading Mastery Tests. Circle Pines, Minnesota: American Guidance Service.
Wright, B D. (2000). Rasch analysis for surveys .Popular Measurement61.
Author
Dairabi Kamil
Faculty member and research manager at Center for Research and Community Service at Islamic State College of Kerinci, Indonesia.
He holds a PhD in curriculum and instruction from the Institute of Education, International Islamic University Malaysia and an MS in TESOL from Monash University, Australia.
Email: [email protected]
Amirul Mukminin
Faculty member at Faculty of Education, Jambi University, Indonesia.
He holds a PhD from Florida State University, USA in Educational Leadership and Policy Studies and MS in educational sciences from Groningen University, the Netherlands. He received a Fulbright scholarship to pursue his PhD and an Erasmus Mundus postdoctoral researcher, University of Groningen, the Netherlands.
Correlates of Parental Attention and Criminal Behaviour
among Students of Borstal Institutions in Nigeria
Adesoji Oni*
Department of Educational Foundations, University of Lagos, Nigeria
Manafa Fausta
Department of Educational Foundations, University of Lagos, Nigeria
Abstract
The study investigated the relationship between parental attention, educational experience and criminal behaviour of students in Borstal Institutions. The purpose was to improve the quality of parent-child relationships and reduce juvenile criminality in Nigeria. The study adopted a
descriptive correlation type survey. The target population consisted of 1,394 juvenile offenders who were housed at the Borstal Institutions. The sample comprised of 450 participants who were randomly selected using a balloting (hat and draw) method of simple random sampling. Two researcher-constructed instruments were used in the study, namely: a “Criminal Behaviour
Questionnaire (CBQ)” and a “Parental Attention & Educational Experience Questionnaire (PAEEQ)”. Data was analysed using the Pearson Product Moment Correlation statistical method. The findings revealed that a significant relationship existed between parental attention and
criminal behaviour; and between educational experience and criminal behaviour of students in Borstal Institutions.Itwas concluded that adequate parental love, warmth, care, attention are imperative for effective parenting and child rearing.
Keywords : Parental attention, educational experience, juvenile offenders, criminal behaviour, and Borstal Institutions
Introduction
In recent times, and the world over, there has been an outcry on the increase
in the rate of misbehaviour and crime. There is a general concern on the increase
in young persons’ involvement in activities that violate moral and legal norms of
the society. The increased rate of criminal behaviour, such as theft, murder, arson,
examination malpractice, kidnapping, rape and armed robbery, among youth is
alarming. It can be observed, that the world is ravaged by various violent crimes
and other atrocities committed by young people. Nigeria is not an exception to this
ugly development among youths.
Dambazau (2011) asserted that the trend of the Almajiri system, particularly in the
North and the Alaye or “Area Boys” in the South-West of Nigeria, are all indicators
of a breakdown of community norms and value systems. The problem of criminal
behaviour or juvenile delinquency among youth in our society is a major national
concern and an important subject for academic study. This falls under the purview of
Sociology of Deviance. Giddens (2001) claimed that Sociology of Deviance is
interested in issues such as delinquency, crime management, community and
institutionalized programmes designed for management of delinquency among others.
The focus of this study therefore is on parental attention and educational
experience as correlates of criminal behaviours among students of Borstal
Institutions in Nigeria. Cases of crime committed by youths are worrisome. There
have been frequent terrorist attacks, particularly in the Northern part of Nigeria.
Bazza (2013) reported on a terrorist group called ‘’Boko Haram,’’ some of its
memebers are young persons who have embarked on wanton destruction of lives
and property. The group has also broadened its target to include bombing public
places, setting fire on schools and kidnapping of students. Questions have been
asked about this upsurge in youth engagement in crime. Particularly, questions have
been asked about what went wrong in the process of child upbringing that may
have given rise tot he development of negative behaviours in the youths.
Inadequacies in parental attention and possibly negative experiences in child’s
educational could have had an impact on his/her upbringing. No doubt, the family
is a primary unit in which children learn the values and attitudes that guide their
actions throughout their lives (Siegel & Welsh, 2005). Some parents go through
economic stress due to their poor educational backgrounds and the lack of
well-paying jobs. These indigent families find themselves in an impoverished
condition, which invariably could affect their children who are likely to be
deprived of their needs.
Makinde (2004) believed that every child is entitled to be raised in a loving, safe
and socially. Some parents have almost neglected the responsibility of attending to the
welfare and emotional needs of their children, which may lead to insubordination,
deviant behaviour and the involvement of the juvenile in criminal acts.
Apart from parental attention, the educational experience of a child could also impact
his/her behavioural formation. Educational experience is an important aspect of a child’s
upbringing, as used in this study it refers to all forms of conventional academic training
that children receive in a conventional school environment. It would also be perceived to
mean all opportunities for educational advancement that a child is exposed to in the course
of his/her upbringing. It is assumed that when training such as this is deficient, the child
may acquire antisocial behaviour. As pointed out by Frederick & Roon (2000), juveniles
who are not adequately educated are more likely to engage in anti-social behaviours than
those that are adequately trained. An educated child is exposed to the norms of the
society, which instills in him/her a high moral standard essential for the sustenance of the
state. The moral and intellectual exposure derived from formal, informal and non-formal
education is likely to deter the child from any behaviour that will cause the child to be
seen as irresponsible. A child’s education is supposed to be the responsibility of the
parents and the state. An investment in the education of a child could help prevent the
child from living a life of crime and other anti-social behaviour. However, there are legal
complexities in the process of determining criminal behaviours in a child.
Section 30 of the Criminal Code (schedule of the Criminal Code Act Cap C.38
Law of the Federation of Nigeria 2010) and section 50 of the Penal Code Law No.18
of 1959 provide that a child under the age of seven does not have criminal
responsibility. From seven to twelve years, a child can only be found responsible if it
can be proved that he/she has a capacity to know that the act or omission should not
have been carried out. Above the age of twelve, the person is deemed as fully
responsible for the act or omission. Though the enactment of this law is meant to
protect the child in the dispensation of justice, it does not indicate that a child cannot
display criminal behavior (Law of the Federation of Nigeria, 2010). Notwithstanding,
juveniles who are in conflict with the law are believed to have ‘right of treatment’.
The need for social rehabilitation for young offenders accounts for the
establishment of Borstal Institutions that today serve as behavioural correctional
institutions for boys (minors) who violate state laws. The term Borstal means
prison for young offenders between the ages of 16 and 21 (Ogundipe, 2011).
established to use education as an instrument of behavioural change or modification
and secondly, to achieve a deviant free society (Haralambos&Holborn, 2008).
Thus, rather than condemn the juvenile delinquents, they are referred through legal
proceedings for treatment (Conklin, 2007).
There are three Borstal Institutions in Nigeria, located in Kaduna in Kaduna
State, Abeokuta in Ogun State and Ilorin in Kwara State (Ogundipe, 2011). The
main philosophy behind the establishment of Borstal Institutions is that children
who are offenders can be reformed and prevented from getting involved in serious
crimes if given a chance to change and not co-habit with hardened criminals. The
idea is that if young offenders are housed in the same prison with adult criminals,
they tend to learn more crime and become worse (Conklin, 2007). As such,
students of Borstal Institutions are often exposed to a series of educational, skill
acquisition and counselling programmes. They are expected to get reformed and
desist from the life of crime. The effectiveness of such exposure therefore cannot
be ascertained unless there is a concerted research effort to determine the
relationship among socio-parental variables such as parental attention, educational
experience and criminal behaviour among students of Borstal Institutions, hence this
study. Towards this end, two hypotheses were generated for the study, namely:
1. There is no significant relationship between parental attention and criminal behaviour of students in Borstal Institutions.
2. There is no significant relationship between educational experience and criminal behaviour of students in Borstal Institutions.
Methodology
The descriptive research design was adopted using specifically the correlation type.
According to Upadhya and Singh (2008), correlation study is concerned with studying
the relationship between two or more variables for the purpose of making predictions
about relationships. As far as this investigation is concerned, correlational design is
used to find out the degree of relationship between parental attention patterns and
educational experiences and their general influence on the criminal indulgences of
students in Borstal Institutions in the country. There was no conscious manipulation
of the variables since the interaction among them has been completed.
All juvenile offenders who are staying and residing in the Borstal Institutions
population for the study. There were 1,394 juvenile offenders housed at the Borstal
Institutions. The sample consisted of 1,044 juvenile offenders housed in Borstal
Institutions in Kaduna and Abeokuta. Out of this number, 240 and 210 participants
were randomly selected respectively. Thus, a total of 450 participants were randomly
selected using balloting (hat and draw) method of simple random sampling
for the study. Two research instruments were used in the study, namely: a “Criminal
Behaviour Questionnaire (CBQ)” and a “Parental Attention & Educational Experience
Questionnaire (PAEEQ)” (Fausta, 2014). The “Criminal Behaviour Questionnaire (CBQ)” is
a 20-item self-developed Likert format with four grade responses ranging from Strongly
Agree (SA) to Strongly Disagree (SD). Respondents were instructed to tick (Ö) the key in
front of each item to indicate the extent of their agreement or disagreement with each
statement. This instrument has two sections. Section “A” contained items eliciting
respondents’ biographical data such as length of stay of students in Borstal Institutions,
reformation tools (academic and vocational) and level of education. The section ‘B’
consisted of 20-items developed to elicit information about the intensity of respondents’
criminal behaviour. Strongly Agree (SA), Agree (A), Disagree (D), Strongly Disagree (SD).
The second research instrument, “Parental Attention & Educational Experience
Questionnaire (PAEEQ)”, is a 30-item questionnaire developed to access the level
of parental care and parents’ responsibilities to their children. It consists of two
Parts – Parts One and Two. Part One measured the Bio-data of the respondents
including Borstal Institution, level of education, types of reformation tools, and
length of stay. Part Two consisted of two Sections A and B. Section A of this
questionnaire consisted of 20 items which measured educational experience, such as
the pattern of their access to educational programmes, facilities and guidance as
may be presented formally or informally in and out of school environment. Further,
Section B consisted of 10-items which measured the pattern of respondents’ access
to educational programmes, facilities and guidance as may be presented formally or
informally in and out of the school environment. The purpose of the instrument
was to assess information on respondents’ experience on attention received from
their parents or guardians. The responses to these items were also ranked on a
four-point scale.
Content validity of the two instruments was achieved through submitting items to
Measurement and Evaluation, and Sociology of Education experts for vetting and
of the instruments. Thereafter, a pilot study was done to establish how reliable the
instruments are. This involved the double administration (with a two-week interval)
of the instruments on thirty (30) participants, who were randomly selected from
Ilorin Borstal Institution, as one of the Borstal Institutions not involved in the main
study. Ilorin Borstal Institution in Kwara State was used for the pilot study because
of the State’s strategic location as a gateway between the Northern and the
Southern parts of Nigeria. A Pearson Product Moment Correlation statistical method
was used for data analysis, yielding a test-retest reliability coefficient of 0.80 and
0.78 for the instruments, indicating a high internal consistency.
Consequently, the instruments were accepted as being stable over time hence
their usage in this study. The hard copies of the questionnaires were administered
on the respondents by the researcher with the assistance of the research assistants
who were recruited for the purpose of this study. They are prison officials, social
workers and community health officers, employed by the government in each of
the Borstal institutions. Each has spent 5 years as a prison official. However for
the purpose of this study, they were trained at their different locations on the
purpose and logistics of this study. Also, adequate time was provided for
respondents to respond to all the items. By this method, the 450 questionnaires
administered were returned correctly filled and used for analysis. The data obtained
for this study to test the hypotheses were analysed with the use of the Pearson
product moment correlation statistical method using the updated SPSS version 17.0.
All hypotheses were tested at 0.05 level of significance.
Results
Hypothesis one: There is no significant relationship between parental attention
and criminal behaviour of students in Borstal Institutions. The hypothesis was tested
using Pearson Product Moment Correlation. The results of the analysis are
presented in Table 1.
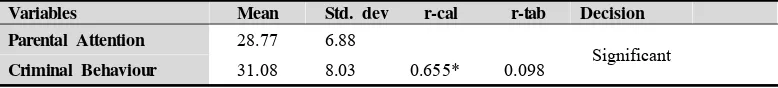
Variables Mean Std. dev r-cal r-tab Decision Parental Attention 28.77 6.88
Significant
Criminal Behaviour 31.08 8.03 0.655* 0.098
Table 1: Relationship between Parental Attention and Criminal Behaviour of Students
Table 2 shows that the mean and standard deviation scores of parental attention
were 28.77 and 6.88, and the mean and standard deviation scores of criminal
behaviour of Borstal students were 31.08 and 8.03 respectively. This relationship
between parental attention and criminal behaviour was however statistically
significant (r = 0.655, df = 448, p = < 0.05) based on the Pearson Product
Moment Correlation Analysis. The null hypothesis was rejected, which implies that
there was a statistically significant relationship between Parental Attention and
Criminal Behaviour of students in Borstal Institutions in Nigeria. This relationship
was positive at 0.05 level of significance.
Hypothesis Two: There is no significant relationship between educational
experience and criminal behaviour of students in Borstal Institutions. The hypothesis
was tested using Pearson Product Moment Correlation. The results of the analysis
are presented in Table 2.
Variables Mean Std. dev r-cal r-tab Decision Educational Experience 30.65 15.92
0.340* 0.098 Significant
Criminal Behaviour 31.08 8.03
Table 2: Relationship between Educational Experience and Criminal Behaviour of Students
*Significant, p<0.05
Table 2 shows that the mean and standard deviation scores of educational
experience are 30.65 and 15.92, and the mean and standard deviation scores of
criminal behaviour of Borstal students are 31.08 and 8.03 respectively. The
relationship between educational experience and criminal behaviour is statistically
significant (r = 0.340, df = 448, p= < 0.05). Therefore the null hypothesis is
rejected, which implies that there is a statistically significant relationship between
educational experience and criminal behaviour of Borstal students in Nigeria
institutions. This relationship is linear and positive at 0.05 level of significance.
Discussion
The findings obtained in the study shows that parental attention is significantly
shown love, care and affection will likely not produce adolescents who develop
criminal behaviour. This study confirmed the findings of Henrich, Brookmeyer and
Shahar (2005) that young people who reported feeling a stronger connection with
their parents were less likely to commit violent offences with a weapon. Similarly
Herrenkohl, Hill, Chung, Guo, Abott and Hawkins (2003) found that young people
who exhibited less violent behaviour were more likely to hold stronger attachment
to their parents. Chapple and Hope (2003) further found that parental attachment
lowered the likelihood of intimate violence in their sampled students. Also, the
finding supports the conception in this study of the role that parental attention can
play in insulating young people from criminal activity. It is very clear that parents
have a world of influence over their children and basically mold and shape their
children into adults. Parents need to be more supportive and responsive to their
children. Parents need to pay more attention to the affairs of their children so as
to reduce the rate of delinquency in their children.
However, this result contradicts Brannigan, Gemmell, Pevalin and Wade (2002)
who respectively posited that positive parental contact and parental support were
not found to affect childhood misconduct. Such findings refute the notion that
parental attention necessarily impacts youth aggression.
The finding for hypothesis two revealed that a significant relationship existed
between educational experience and criminal behaviour of students of Borstal
Institution. This is an indicator that school experience can predict criminal
behaviour. The reason is not farfetched, because boys with negative school
experience could become dropouts, this could lead them to become street boys or
touts. This result confirmed the findings of Sprott (2004) who postulated that
young people who behaved violently often come from classrooms that provided
little emotional support to the students. Students who were in classrooms
characterized as having stronger supportive and social interactions at the ages of 10
and 11 were less likely to behave violently at the age of 12 and 13. Further,
Sprott (2004) speculated whether school support plays a significant role in deterring
future violent offending resulting from inadequate bonding in other aspects of the
child’s life. This research found that strong attachment to school was associated
with less violent offending. As a result, they concluded that the important effect of
The findings highlighted the potential role that parents and schools can play in
preventing violent offending amongst young people. Similar conclusions were found
by Resnick, Ireland and Borowsky (2004). This finding is also in line with
Banyard and Quatey (2006), who were of the view that school attachment, amongst
other social control factors, protected young people from violent behaviour.
Conclusion and Recommendations
On the basis of the findings for this study, it is concluded that there existed a
significant interaction between parental attention, educational experience, and
indulgence in criminal behavior of students in Borstal Institutions in Nigeria.
Hence, the following recommendations are proffered for effective institutionalizations
of juvenile offenders in Nigerian Borstal Institutions, namely: counseling
psychologists should be deployed to secondary schools for early identification of
personal social issue among students. This will go a long way in reducing cases of
delinquency in students. Parents (especially mothers) must set aside sufficient time
to stay with children at home. Adequate monitoring, control, supervision,
irrespective of the gender, school location and age are paramount factors in positive
and effective child rearing. Adequate parental love, warmth, care, attention are
factors for effective parenting.
References
Banyard, G. & Quartey, K. A. (2006). Youth’s family bonding, violence risk, and school performance: Ecological correlates of self-reported perpetration. Journal of Interpersonal
Violence, 21 (10), 1314 – 1332.
Brannigan, A., Gemmell, W., Pevalin, D., & Wade, T. (2002). Self-control and social control in childhood misconduct and aggression: The role of family structure, hyperactivity, and hostile parenting. Canadian Journal of Criminology, 44 (2), 119 – 142.
Bazza, M.B. (2013). Boko haram terrorism . Lagos: Atrik Ventures Limited.
Chapple, C. L. & Hope, T. L. (2003).An analysis of the self-control and criminal versatility of gang and dating violence offenders. Violence and Victims, 18 (2), 143 – 162.
Conklin, J. E. (2007). Criminology. Boston: Pearson
Dambazau, A. B. (2011). Criminology and criminal justice, Kaduna: Nigerian Defence Academy Press. Fausta, M. (2014). Socio-educational correlates of criminal behavious among students of Borstal
Fredrick, W. S & Roon, N. K. (2000) Relationship between education and juvenile delinquency among juvenile in selected states of Nigeria. .journal of Association of Nigerian Social Workers 4 (2), 84-97.
Giddens, A. (2001). Sociology. New York: Polity Press.
Haralambos, M. & Holborn, R. M. (2008).Sociology: Themes and perspective. New York: Oxford University Press.
Henrich, C. C., Brookmeyer, K. A. & Shahar, G. (2005). Weapon violence in adolescence: Parent and school connectedness and protective factors Journal of Adolescent Health, 37 (4), 306 –
312.
Herrenkohl , T. I., Hill, K. G., Chung,I., Guo, J., Abott, R., & Hawkins, J.D. (2003). Prospective factors against serious violent behavior in adolescence: A prospective Study of Aggressive
Children. Social Work, 27 (3), 179 – 191.
Law of the Federation of Nigeria (2010). Criminal Code Act cap c. 38
Makinde, B. O. (2004). Know your personality and social development. Lagos Wealthsmith Books
Ogundipe O. A. (2011). Management of juvenile delinquency in Nigeria. Paper presented at the International conference on special needs offenders held in Nairobi, Kenya
Resnick, M. D., Ireland, M., &Borowsky I. (2004). Youth violence perpetration: What protects?
What predicts? Findings from the national longitudinal study of adolescent health Journal of Adolescent Health, 35(5), 1-10.
Siegel, L. J., & Welsh, B. (2005).Juvenile delinquency: USA: Thomson Wadsworth, Belmont. Sprott, J. B. (2004). The development of early delinquency: Can classroom and school climates make a
difference? Canadian Journal of Criminology and Criminal Justice, 46(5), 553 – 572.
Does satellite television programing satisfy ethiopian
secondary school students?
SungWan Kim
Center for Educational ICT, Ministry of Education Addis Ababa, Ethiopia
Gebeyehu Bogale*
Center for Educational ICT, Ministry of Education Addis Ababa, Ethiopia
ABSTRACT
The Ethiopian development plans have dealt with the education sector as a key strategic pillar. There have been a lot of educational efforts. In particular, to cope with a lack of qualified teachers, lack of good teaching models, and remote rural regions separated from
educational benefits, the Ethiopian Ministry of Education has made efforts to utilize educational media, such as satellite TV programing, to improve the quality of secondary education for last decade. However, there was lack of national investigation in the aspect of systemic evaluation to measure the effectiveness of the satellite TV programing. This study aims to investigate the
actual practice and effectiveness of the satellite TV programing in Ethiopian secondary schools. To achieve the goal, one questionnaire was developed based on the CIPP model. Two secondary schools were selected and 228 students (Grade 9-12) participated in the survey. Data collected
from them were utilized for descriptive & frequencies analysis, chi-square test, and multiple regression analysis. The results indicated that Ethiopian students utilizing satellite TV programing scored highly in the evaluation areas of context, input, process, and product of the program. It was also found that learning demand, learning content, and class management were factors
affecting the satisfaction in the satellite TV programing. These findings suggested that satellite TV programing could play an important role in improving the quality of Ethiopian secondary education. As a conclusion, several educational and administrative strategies to improve the TV
program were recommended.
Keywords : Educational ICT, Satellite TV Program, Secondary Education, Ethiopia.
Introduction
Located in the Horn of Africa, Ethiopia has made a lot of efforts toward
bettering the national economy, especially poverty eradication. The main national
development plans are as followings (MoFED, 2013); Agricultural-Development-Led
Industrialization (ADLI)(2002), Sustainable Development and Poverty Reduction
Program (SDPRP) (2002/03-2004/05), Plan for Accelerated and Sustained
Development to End (PASDEP) (2005/06-2009/10), Growth and Transformation Plan
(GTP) (2010/11-2014/15). Through the PASDEP, Ethiopian economic growth
reached average 11 percent per annum and mobile telecom network capacity
increased 0.5M users (2005/06) to 25M users (2009/10). The number of telecom
customers grew from 0.56M users (2004/05) to 6.5M users (2009/10). CDMA
wireless network covered 90 percent of Ethiopia and 10,000km of fiber optic cable
and a National Network Operation Center was established. And GTP aims to
eradicate poverty and to reach the level of a middle-income economy as of
2020-2023. These plans are aligned with Millennium Development Goals (MDGs).
The Ethiopian development plans have dealt with the education sector as a key
strategic pillar. For example, GTP has goals to achieve in general education area;
Scaling up educational quality by building communities’ sense of ownership of
educational quality by initiating integrated community mobilization, at all levels,
using every media, digitalized (plasma based) secondary education, more Alternative
Basic Education Centers. For supporting those plans in the educational sector,
several national educational plans have been implemented; Education & Training
Policy (ETP) (1994), General Education Quality Improvement Package (GEQIP)
Ⅰ&Ⅱ, Education Sector Development Program (ESDP) Ⅰ(1997/98-2001/02),
Ⅱ(2002/03-2004/05), Ⅲ(2005/06-2009/10), Ⅳ(2010/11-2014/15).
Due to these educational plans, the system of Ethiopian education, which
consists of preschool, primary education, secondary education, TVET, and higher
education, has sharply developed. In particular, a lot of educational indicators of
general education (primary & secondary education) have been on the increase. Net
Enrollment Ratio (NER) of primary education (Grade 1 to 8) rapidly increased
from 24.9% in 1996/07 to 85.9% in 2012/13 (Grade 1-4: 95.5%; Grade 5-8:
Abstract, 2013). Afar has the lowest achievement (41.5%) compared with other
regions (Gambella: 98%, Addis Ababa: 69.4%). In case of secondary education,
NER (2012/13) falls sharply (Grade 9-10: 19.4%, Grade 11-12: 5.3%). This may be
due to delayed graduation from primary school, examination barriers and financial
barriers. And enrollment of children with special educational needs (blind,
physically & intellectually disabled, deaf, etc.) was 6,551. A five year
(2008/09-2012/13) trend of Pupil-Teacher Ratio (PTR) for grades 9-12 shows that
PTR has been continually reduced from 41 to 28.7. But still there is regional
differences in PTR (Somali : 47.4%; Benishangul Gumuz: 19.9%).
In contrast with primary education, the percentage of qualified teachers is higher
in secondary education. Nationally, of all the secondary teachers, 91.5% are qualified
for their level of secondary teaching. There is, however, considerable variation by
region in the percentage of qualified teachers (Tigray: 96.2%; Afar: 20.8%).
Even though there have been a lot of educational efforts made, many problems
have been discovered in the Ethiopian educational sector. To cope with a lack of
qualified teachers, lack of good teaching models, and remote rural regions separated
from educational benefits, Ethiopian Ministry of Education has made efforts in
utilizing educational media such as satellite TV programing for improving the
quality of secondary education.
However, up to now, there was a lack of national investigation and more
systemic evaluation for measuring the effectiveness of satellite TV programing.
Accordingly, this study aims to investigate the actual practice and effectiveness of
satellite TV programs in Ethiopian secondary schools. Research problems are as
follows:
. What is the present status of satellite television programing in Ethiopia?
. What are the factors which are influential in students’ satisfaction in satellite
TV programing?
Challenges of Existing Satellite Television Program and New
Opportunity
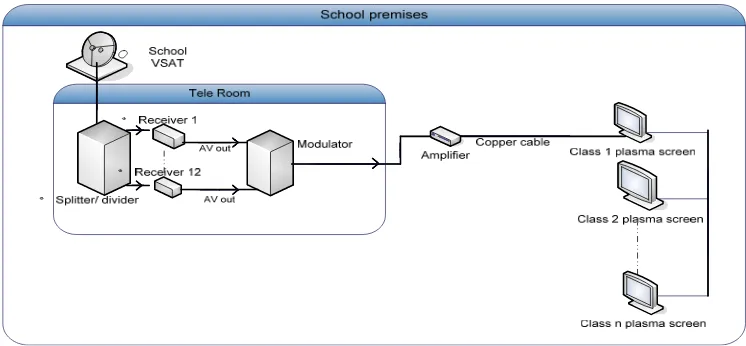
The Ethiopian government launched satellite TV programing as part of the
national SchoolNet Initiative in 2004, which is a nationwide network of Ethiopia’s
secondary schools. Today, the Center for Education ICT (CEICT), an ICT-leading
broadcasts 2978 television programs of 10 subjects (English, mathematics,
chemistry, biology, physics, geography, civics, economics, technical drawing, and
general business) for grade 9-12. This program is broadcasted via satellite and
secondary students in class watch the programs on plasma televisions for 20
minutes or so out of the 40 minutes class ([Figure 1]).
As of 2014, there are about 2000 secondary schools, including preparatory
schools (Grade 11 & 12), of which 1278 schools are well equipped to receive the
television broadcast from the center, however only 69 % (893 secondary schools)
among the 1278 secondary schools are properly utilizing the satellite TV
programing. Even though satellite TV programing has contributed to improving the
quality of the secondary education in Ethiopia, there are several main constraints in
the program. First, the basic problem is a lack of electricity. There are many cases
where each school is not equipped with generators for the frequent blackouts.
Second, there is a lack of maintenance and accessories for the Plasma TVs and
VSAT apparatus installed in the schools. Third, there is still a lack of proper
collaboration among CEICT, Ethio Telecom, regional educational bureaus and
schools. And the critical problem is that the TV programing is delivered one way,
not considering the teacher-student and student-student interaction. In addition, there
is a limitation in satisfying a variety of special education needs such as cognitive
& physical disability, although the program provides the service of sign language
for students with a hearing disability.
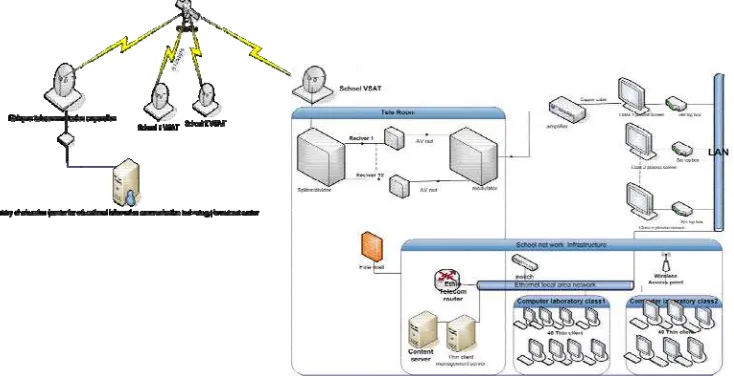
The Ethiopian Ministry of Education continues to take efforts for overcoming these shortcomings in secondary education ([Figure 2]).
Figure 2. Future Structure of Satellite TV Program in Ethiopian Secondary Education
As one strategy, the ministry has launched an initiative to build a Local Area
Network (LAN) in the first phase for 120 secondary schools. Each school computer
laboratory will be equipped with a minimum of 80 thin client computers throughout
the country. The ministry already carried out the pilot test for its effectiveness.
Currently the ministry is designing another e-learning project under the General
Education Quality Improvement ProgramⅡ (GEQUIP Ⅱ), which is supported by the World Bank. As a part of the efforts to enhance the quality of general
education, especially individual, self-directed, and self-paced learning environments
through ICT, the MOE and CEICT has designed a program targeting 300
secondary schools nationwide. This program hopes to enhance the existing in-class
video learning service, establish a computer laboratory-based learning experience
managed through a private cloud service, and expand the reach of online-based
out-of-class learning using mobile devices. An extension to this program will
include the participation of twelve secondary schools in innovative programs to
explore the use of mobile-based technologies for strengthening the quality of
Method Participants
Participants
This study aims to investigate the actual practice and effectiveness of satellite
TV programing in Ethiopian secondary schools. To achieve the goal, two secondary
schools, including preparatory schools, were selected. A school is located in the
urban area of Addis Ababa City and B school is located in the rural area of
Oromia state. 228 students (Grade 9-12) from two regions participated in the
survey.
Number (%)
Location Urban 114 (50)
Rural 114 (50)
Gender Male 122 (53.5)
Female 106 (46.5)
Grade
Grade 9 40 (21.1)
Grade10 71 (31.1)
Grade11 75 (32.9)
Grade12 34 (14.9)
Total 228 (100)
Table 1. Participants’ Information
Instrumentation
To investigate the actual practice and effectiveness of satellite TV programing in
Ethiopia, a questionnaire was developed. It was based on the CIPP (Context, Input,
Process, and Product) model, which was designed by Stufflebeam (1985). Based on
Figure 3 below, 23 items were developed (See Appendix). They are validated
through reviews by 3 program experts from the Center for Educational ICT