Doctoral Dissertation Summary
Academic Year 2019
The development and application of
metabologenomic analysis for the evaluation of
intestinal environment
Graduate School of Media and Governance
Keio University
Abstract
Intestinal microbiota and their synthetized-metabolites are strongly associated with host physiology. Advances in DNA sequencing and mass spectrometry have enabled accumulation of large amounts of data on the interactions among microbiota, metabolites, and the host. However, there is no well-developed strategy to analyze these datasets. This study aimed to develop an original analytical strategy, metabologenomics, that involves integrated analysis of capillary electrophoresis time-of-flight mass spectrometry (CE-TOFMS)-based metabolome data and high-throughput-sequencing-based microbiome data to evaluate perturbations in environmental factors, such as diet, which influence the intestinal environment. First, the fecal metabolome profiles obtained using eight methods differing in fraction, homogenization solvent, extraction solvent, and the requirement of bacterial cell disruption were compared for comparison using CE-TOFMS-based metabolome analysis. The results suggested that metabolomic profiles could differ based on the extraction method, thereby highlighting the importance of selecting a method suitable for the specific analysis. Second, we conducted a metabologenomic analysis of the metabolome and microbiome data. This analysis revealed that feces of mice fed an American diet, that formulated to match the average daily human nutritional intake in the United State,
contained higher levels of butyrate and higher relative abundances of butyrate producers, such as Oscillospira
and Ruminococcus, compared with those of the control diet-fed mice. Additionally, the predicted gene
abundance of butyryl CoA:acetate CoA transferase positively correlated with butyrate levels. Finally, human intestinal microbiome and metabolome profiles under three dietary conditions were investigated to evaluate the robustness of the human intestinal environment in response to daily dietary fluctuations. The results suggested that intestinal metabolome and microbiome profiles are different for each individual and are not affected by daily dietary fluctuations in most individuals. Thus, our metabologenomic approach can be utilized to evaluate the intestinal environment and gain insights into complex microbial ecosystems.
Keywords: intestinal microbiota; metabolome; metabologenomics; diet; multi-omics analysis
Chapter 1
Introduction
Intestinal microbiota, which consists of a large number of bacteria, archaea, viruses, and fungi, inhabit the gastrointestinal tracts of animals, including humans [1]. These microbial communities have been shown to contribute to food digestion, nutrient absorption, and development of the host immune system. Previous studies have reported that disruption of the microbial structure and/or host-microbial interactions, known as "dysbiosis", could be a risk factor for several diseases, including colon cancer [2, 3], hepatic cancer [4], obesity [5-7], diabetes[8-10], atherosclerosis [11-13], immune system disorders [14, 15], and brain function disorders [16-20].
On the other hand, recent studies have found that intestinal microbiota produces a range of
low-molecular-weight metabolites such as
short-chain fatty acids (SCFAs) [21, 22],
trimethylamine [12], indole metabolites (e.g., indole
propionate, indole-3-acetaldehyde) [23, 24],
vitamins [25, 26], polyamines [27, 28], and secondary bile acids [29]. These molecules play direct and/or indirect roles in maintaining good health and suppressing various diseases.
Intestinal microbiota-derived metabolites are as important as the composition of intestinal microbiota; characterization of these metabolites is required to understand the relationship between the
intestinal ecosystem and human health.
Developments in DNA sequencing and mass spectrometry technologies have allowed researchers to obtain data that enhance our understanding of the interactions among the microbiota, metabolites, and host. However, the strategies used for multi-omics measurement from the same samples and analysis of these datasets are not well-developed. Therefore, this thesis was conducted to develop an analytical method for evaluating the intestinal environment based on both high-throughput-sequencing-based
microbiome and capillary electrophoresis
time-of-flight mass spectrometry
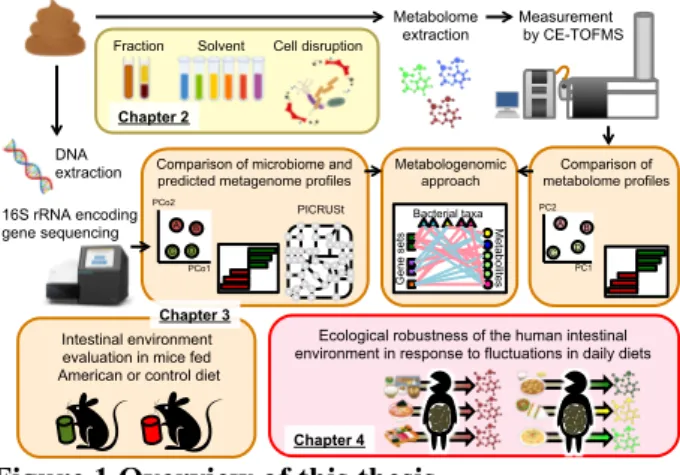
(CE-TOFMS)-based metabolome analyses [30, 31], and to apply the method for examining the effects of diet on the murine and human intestinal environment (Figure 1).
1
Figure 1 Overview of this thesis
In Chapter 2, CE-TOFMS-based fecal metabolite profiles obtained using 8 methods differing in fraction methods, homogenization solvents, extraction solvents, and requirement for bacterial cell disruption were compared to determine the impact of varying extraction methods on the fecal metabolite profiles (yellow shading). In Chapter 3, a novel metabologenomic analysis method, which
integrates CE-TOFMS-based metabolome and
high-throughput-sequencing-based microbiome analyses, was developed and applied to compare the intestinal environment of C57BL/6J mice fed an American diet and mice fed a control rodent diet (orange shading). In Chapter 4, this method was applied to investigate the robustness of the human intestinal environment in response to daily dietary fluctuations under 3 different dietary phases (pink shading).
Chapter 2
Comparison of extraction methods for
analyzing fecal metabolites
It has been reported that intestinal microbiota produces a range of low-molecular-weight metabolites play direct and/or indirect roles in maintaining good health and development of various diseases. Thus, microbiome-produced metabolites impact the human phenotype and regulate host metabolism, and the importance of investigating intestinal metabolites has gained attention. In previous studies, metabolome analysis of intestinal and/or fecal samples was conducted mainly using nuclear magnetic resonance (NMR) [32-39], gas
chromatography-mass spectrometry (GC-MS)
[40-44], and/or liquid chromatography-mass
spectrometry (LC-MS) [45-50]. In comparison with
previous technologies, capillary
electrophoresis-mass spectrometry (CE-MS) is a suitable technique for measuring polar and ionic low weight metabolites because these metabolites can be separated by CE according to their ionic mobilities [30, 31]. Therefore CE-MS is useful as a complementary tool for measuring ionic metabolites that cannot be easily analyzed by GC-MS or LC-MS [51]. Thus, CE-TOFMS based-metabolome analysis
may improve the understanding of intestinal metabolome profiles.
However, methods for preparing fecal samples for CE-TOFMS-based metabolome analysis have not been standardized because a few studies have utilized this method for fecal metabolome analysis. Therefore, in this study, CE-TOFMS-based fecal metabolite profiles obtained from 8 methods
using different fractions (i.e., supernatant,
precipitate, and whole sample), homogenization
solvents (i.e., 0.1 × PBS and methanol), extraction
solvents (i.e., 0.1 × PBS, Methanol: 0.1 × PBS (1:1
(v/v)) (50% methanol), and
methanol:chloroform:water (5:5:2 (v/v/v)) (MCW)), and requirement of bacterial cell disruption were compared to determine the impact of varying extraction methods on fecal metabolite profiles (Figure 2.1). Additionally, fecal metabolome profiles spiked with standard metabolites were investigated to compare the recovery rate of the standard metabolites in each metabolite extraction method.
Figure 2.1 Schematic representation of
experimental design
The workflow of the 8 extraction methods is shown in the figure. The same color indicates the same condition in each step.
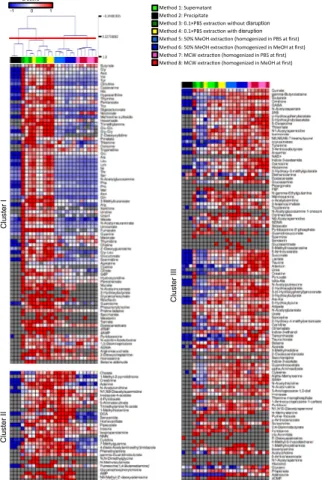
A total of 220 fecal metabolites were detected by CE-TOFMS. Statistical analysis of these metabolome profiles indicated that metabolites 2, 8, and 51 were significantly changed depending on the method of cell disruption, homogenization solvent, and extraction solvent, respectively (detailed data not shown in this summary). The z-scores of all detected metabolites are shown in the heatmap and overall fecal metabolome profiles were compared by Hierarchical clustering analysis (HCA) and K-means clustering (Figure 2.2). The heatmap showed that the amounts of global metabolites were Solvent
Fraction Cell disruption
Chapter 2
PCo1 PCo2
A B
C D
Comparison of microbiome and predicted metagenome profiles
Metabolome
extraction Measurement by CE-TOFMS
DNA extraction 16S rRNA encoding gene sequencing PC1 PC2 A B C D Comparison of metabolome profiles Chapter 3 Intestinal environment evaluation in mice fed American or control diet
Chapter 4 Me ta bo lite s Bacterial taxa G en e se ts Metabologenomic approach PICRUSt
Ecological robustness of the human intestinal environment in response to fluctuations in daily diets
H uma n fe ca l sa mp le s Homoge-nization In 0.1×PBS In 100% methanol Fraction Super-natant Precipi-tate Whole sample Cell disruption Without disruption With disruption Without disruption With disruption Condition Name Method 5 Method 7 Method 6 Method 1 Method 3 Method 2 Method 4 Method 8 Solvent 0.1×PBS Methanol: water (1:1) 0.1×PBS Methanol: 0.1×PBS (1:1) Methanol:chloroform: 0.1×PBS (5:5:2) Me ta bo lo me p ro fil in g by C E-T O F MS In 0.1×PBS In 100% methanol
low when they were extracted from the precipitate. In contrast, metabolites extracted from the supernatant and whole fecal sample using the same solvent were clustered together. These results suggest that the fecal metabolites were mainly present outside of the cells, as supported by the result that only 2 metabolites significantly differed with or without cell disruption. The metabolome extracts obtained from 3 different extraction
solvents including 0.1 × PBS, 50% methanol, and
MCW were also compared by HCA. The profiles clearly differed depending on the presence or absence of organic solvents used for extraction. Form the results of statistical analysis and HCA, it was suggested that the extraction solvent greatly influences the results as compared to other factors involved in the process of fecal metabolome profiling.
Figure 2.2 Overview of fecal metabolome profiles obtained by using 8 extraction methods
Heatmap showing the z-scores of quantified metabolites using a blue-red scheme. Gray indicates the concentrations of metabolites below the detection limit. Extraction methods are shown on the top colored bar on the heatmap. Samples were clustered by HCA based on Pearson correction coefficients. Fecal metabolites were categorized into 3 groups by K-means analysis. PBS; phosphate-buffered saline, MeOH; methanol, MCW; methanol/chloroform/water.
In conclusion, our results suggest that the metabolome profile can be altered by varying the extraction method. This study provides valuable basic information for fecal CE-TOFMS-based metabolome profiling.
Chapter 3
A metabologenomic approach reveals
changes in the intestinal environment
of mice fed on American diet
As described in Chapter 1, previous studies have
indicated that intestinal microbiota-derived
metabolites are as important as the composition of intestinal microbiota; characterization of these metabolites is needed to fully understand the relationship between the intestinal ecosystem and human health. A multi-omics approach combining the metabolome and microbiome analysis could be a valuable tool for understanding the entire intestinal ecosystem, including the relationships among microbiota, metabolites, and host. To gain new insight and knowledge from omics data, the data analysis process is highly important. However, analytical pipelines for multi-omics dataset are not well developed. Therefore, it is necessary to combine existing methods, or develop original
methods to comprehensively analyze the
relationships between the intestinal microbiome and metabolome.
First, to obtain novel information regarding the whole intestinal microbial ecosystem, we designed an original approach, Metabologenomics, for analysis of the multi-omics dataset. This system consists of separate analyses of the intestinal metabolome and microbiome, as well as an integrated analysis of the combined intestinal metabolome and microbiome datasets. An overview of the study design is depicted in Figure 3.1. For this first example of the use of our metabologenomic approach, we obtained fecal samples were obtained from male C57BL/6J mice fed control diet or
American diet (AD) (control diet: n = 6, AD: n = 5),
that formulated to match the average daily human nutritional intake in the United State, from weaning at 8, 12, 24, 36, and 52 weeks. These specimens were used for the extraction of metabolites and DNA.
For the metabolome approach, amounts and/or relative abundances of metabolites could be measured comprehensively using mass spectrometry and/or NMR. In the present study, CE-TOFMS was used to obtain the metabolome dataset. To clarify the differences in metabolites between the control and AD groups, principal component analysis (PCA), discriminant analysis, and statistical analysis were used. Additionally, Metabolite Set Enrichment
C lu st er II C lu st er III C lu st er I -1 0 1 Z-score Method 1: Supernatant Method 2: Precipitate
Method 3: 0.1×PBS extrac:on without disruption Method 4: 0.1×PBS extrac:on with disruption Method 5: 50% MeOH extrac:on (homogenized in PBS at first) Method 6: 50% MeOH extrac:on (homogenized in MeOH at first) Method 7: MCW extrac:on (homogenized in PBS at first) Method 8: MCW extrac:on (homogenized in MeOH at first)
3
Analysis (MSEA) [52] was used to evaluate pathways that differed between the two dietary groups.
For microbiome analysis, V1–V2 regions of 16S rRNA-encoding genes were sequenced by MiSeq (Illumina). Sequence reads that passed the quality filters were clustered into Operational Taxonomic Units (OTUs) based on a cut-off of 97% similarity and assigned to the taxonomy using Quantitative Insights into Microbial Ecology (QIIME) [53]. To clarify the differences in microbiota components between the control and AD groups, UniFrac principal coordinate analysis (PCoA), discriminant analysis, and statistical analysis were used. Furthermore, to consider not only the microbiome structure but also the microbiome function, we utilized Phylogenetic Investigation of Communities by Reconstruction of Unobserved States (PICRUSt) [54] to predict the metagenome profiles based on 16S rRNA gene sequence data. To demonstrate the relationships between the intestinal metabolome and microbiome, Procrustes analyses were used to visualize and compare the two datasets. We conducted correlation analyses to obtain detailed information about relationships among the metabolome, microbiome, and predicted metagenome profiles. To simplify the complex interactions between metabolites and microbes, hierarchical clustering of autocorrelation maps was used to identify clusters that share the same patterns of changes, and hundreds of significant correlations were visualized in a network graph.
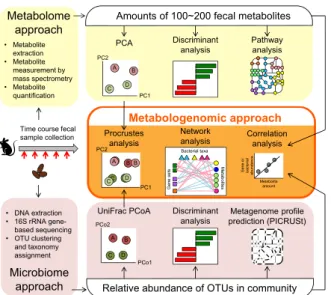
Figure 3.1 Overview of metabologenomic analysis workflow
Steps used for evaluation of metabolome profiles are summarized in the top row (yellow shading). This process starts with measurement of the amount of fecal metabolites to obtain profiles for the 100–200 metabolites. These metabolome profiles then are compared using
Principal Component Analysis (PCA), discriminant analysis, and pathway analysis. Steps used for evaluation of microbiome profiles are summarized in the bottom row (pink shading). This process starts with the sequencing of the community’s 16S rRNA-encoding genes to clarify the relative abundance of operational taxonomic units (OTUs). Microbial memberships and structures are compared using UniFrac principal coordinate analysis (PCoA) and discriminant analysis. Additionally,
Phylogenetic Investigation of Communities by
Reconstruction of Unobserved States (PICRUSt) is used
to predict metagenomic profiles. Steps for
metabologenomic analysis are summarized in the central part of the figure (middle row; orange shading). The PCoA and/or PCA plots are used for Procrustes analyses. The relative abundances of microbial taxonomy and/or metagenome profiles and amounts of metabolites then are used for correlation analysis and network analysis.
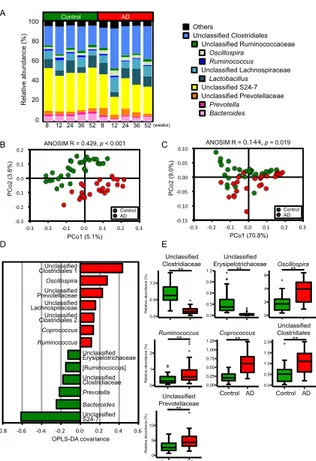
A total of 184 fecal metabolites were detected by CE-TOFMS. These metabolites corresponded to various pathways, including the metabolism of carbohydrates, energy, lipids, and amino acids (Figure 3.2A). Of these 184 fecal metabolites, 84 metabolites were significantly different between the control and AD groups, as assessed by the
Mann-Whitney U test. Of these 84 metabolites, 74
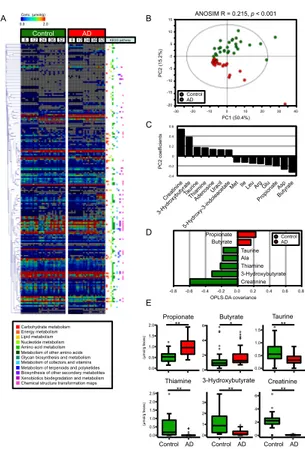
showed decreased levels in the AD group. To evaluate pathways that are involved in the 84 metabolites with significantly changed, MSEA was conducted. MSEA calculates whether a specific pathway is over-represented by chance within an arbitrary list of metabolites. MSEA showed that metabolites related to methionine metabolism were significantly changed between the control and AD groups (Table 3.1). To investigate whether metabolites contributed to the differences between the control and AD groups, multivariate analyses were conducted. PCA plots and analysis of similarities (ANOSIM) showed that the fecal metabolome profiles clustered into 2 groups depending on host diet (Figure 3.2B). However, the Euclidean distances were not significantly different based on host age or individual variability. According to the PC2 coefficients of the PCA, the amounts of butyrate, propionate, and amino acids such as Asp, Glu, Arg, Leu, Ile, and Met were
higher, and the amounts of creatinine,
3-hydroxybutyrate, taurine, thiamine, and
nucleosides were lower, in the AD group (Figure 3.2C). Additionally, orthogonal partial least squares discriminate analysis (OPLS-DA) showed results similar to those of PCA. According to the OPLS-DA covariance scores, higher amounts of butyrate and propionate, and lower concentrations of creatinine, 3-hydroxybutyrate, thiamine, Ala, and taurine in AD contributed to the separation of the two groups (Figure 3.2D). The metabolites for which the
Int. J. Mol. Sci.2018,19, 4079 4 of 21
Microbiome approach Metabolome
approach
UniFrac PCoA Discriminant
analysis Metagenome profile prediction (PICRUSt) Procrustes analysis Correlation analysis PCo1 PCo2 A B C D C A B B C D PC1 PC2 Network analysis Gen e or bacte ri al abu nda nce Metabolite amount
Amounts of 100~200 fecal metabolites
PCA
Relative abundance of OTUs in community
Pathway analysis PC1 PC2 A B C D • DNA extraction • 16S rRNA gene-based sequencing • OTU clustering and taxonomy assignment • Metabolite extraction • Metabolite measurement by mass spectrometry • Metabolite quantification Discriminant analysis Metabologenomic approach Bacter ia l tax on M eta bolite s Bacterial taxa Gen e sets
Time course fecal sample collection
Figure 1.Overview of metabologenomic analysis workflow. Steps used for evaluation of metabolome profiles are summarized in the top row (yellow shading). This process starts with measurement of the amount of fecal metabolites to obtain profiles for the 100–200 metabolites. These metabolome profiles then are compared using Principal Component Analysis (PCA), discriminant analysis, and pathway analysis. Steps used for evaluation of microbiome profiles are summarized in the bottom row (pink shading). This process starts with the sequencing of the community’s 16S rRNA-encoding genes to clarify the relative abundance of operational taxonomic units (OTUs). Microbial memberships and structures are compared using UniFrac principal coordinate analysis (PCoA) and discriminant analysis. Additionally, Phylogenetic Investigation of Communities by Reconstruction of Unobserved States (PICRUSt) is used to predict metagenomic profiles. Steps for metabologenomic analysis are summarized in the central part of the figure (middle row; orange shading). The PCoA and/or PCA plots are used for Procrustes analyses. The relative abundances of microbial taxonomy and/or metagenome profiles and amounts of metabolites then are used for correlation analysis and network analysis. 2.2. AD Consumption Alters Intestinal Metabolome Profiles
Fecal samples were obtained from male C57BL/6J mice fed control diet or AD (control diet:n= 6,
AD:n= 5) from weaning at 8, 12, 24, 36, and 52 weeks (Figure S2A). Previous studies have reported
that consumption of Western diets or food containing high concentrations of fat and/or carbohydrate
can lead to intestinal microbial imbalance and induce diseases like colon cancer [2,3], hepatic cancer [4],
obesity [5–7], diabetes [8–10], and atherosclerosis [11–13].
In this study, we used a laboratory chow formulated to match the daily human nutritional content
absolute amount values exceeded the threshold in both PC2 coefficients and OPLS-DA covariances are shown in the box plots in Figure 3.2E.
Figure 3.2 AD consumption alters intestinal metabolome profiles in mouse
(A) Heatmap showing the concentrations of quantified metabolites using a rainbow scheme. Gray indicates the concentrations of metabolites that fell below the detection limit. Kyoto Encyclopedia of Genes and Genomes (KEGG) pathways that each metabolite belongs to are shown to the right of the heatmap. Labels at the top of the panel indicate dietary group and mouse age (in weeks); (B) PCA of the intestinal metabolome profiles normalized by Pareto and analysis of similarity (ANOSIM). The ellipse denotes the 95% significance limit of the model, as defined by Hotelling’s t-test; (C) Bar graph showing PC2 values for metabolites that had |PC2 coefficients| > 0.11 in loading of PCA; (D) Bar graph showing OPLS-DA covariance values for metabolites that had |OPLS-DA covariance| > 0.16 based on OPLS-DA of metabolome profiles of control and AD mice. The model resulted in one predictive and one orthogonal four components with the cross-validated predictive ability Q2 (cum) = 0.863 and the total explained variance R2X (cum) = 0.791; (E) Box plots indicating fecal amounts of metabolites that had |PC2 coefficient values| > 0.11 in PCA, |OPLS-DA covariance values| > 0.16 in OPLS-DA, and false discovery rate (FDR) < 0.05 based on Mann–
Whitney U test and Benjamini-Hochberg correction when
comparing between the control and AD groups.
Significant differences are indicated by * FDR < 0.05, ** FDR < 0.01.
Table 3.2 Metabolic pathways significantly changed in AD compared to control as assessed by MSEA
1 Total numbers of metabolites that corresponded in each
pathway. 2 Observed numbers of metabolites that derived
from given dataset in each pathway. 3 Expected observed
numbers of metabolites that are calculated by given dataset in each pathway. 4 Hits/expect.
To evaluate the impact of AD consumption on
intestinal microbial composition, 16S
rRNA-encoding genes were sequenced by MiSeq. A total of 880,770 reads of filter-passed 16S rRNA gene sequences were clustered into 1666 OTUs based on a minimum similarity of 97%. Genus-level microbial structures are shown as a bar graph in Figure 3.3A. Of 106 genera, 15 differed significantly in abundance between the control and AD groups. Unweighted and weighted UniFrac principal coordinate analyses (PCoAs) and ANOSIM were conducted to compare the microbial membership and structure. The results of UniFrac PCoA and ANOSIM indicated the separation between control and AD in both unweighted and weighted analyses (Figure 3.3B,C). The distances between samples within the same dietary group were significantly shorter than the distances between different dietary groups, based on both unweighted and weighted UniFrac distances. However, there was no significant difference in the distances between samples within the same age and of different ages, and samples within the same subject and of different subjects. These results indicated that dietary condition has a bigger impact on intestinal microbial membership and structure than host age and individual variability. To identify the bacterial taxa that may contribute to this separation, OPLS-DA was performed [55-57]. The bacterial taxa that contribute to the separation are shown in Figure 3.3D. Additionally, as another method of discriminant analysis, we also conducted LEfSe analysis [58]. LEfSe results showed that 39 taxa contributed to the separation between the control and AD groups. The taxa that were present at higher proportions in the AD group were distributed across a wide range of taxa that included the Bacteroidetes, 0.0 0.5 1.0 1.5 2.0 Propionate ** (µ mo l/g fe ce s) Propionate -0.4 -0.2 0 0.2 0.4 0.6 0.0 0.5 1.0 1.5 2.0 2.5 Thiamine** Control AD (µ mo l/g fe ce s) Thiamine 0 2 4 6 Butyrate * Butyrate 0 2 4 6 Creatinine 0 1 2 3 3-Hydroxybutyrate 0.0 0.5 1.0 1.5 Taurine 15 10 5 0 -5 -10 -15 -20 -30 -20 -10 0 10 20 30 40 PC 2 (1 5. 2% ) PC1 (50.4%) Control AD PC 2 co ef fici en ts C E B -0.8 -0.6 -0.4 -0.2 0.0 0.2 0.4 0.6 0.8 Propionate Butyrate Taurine Ala Thiamine 3-Hydroxybutyrate Creatinine OPLS-DA covariance D Control AD Carbohydrate metabolism Energy metabolism Lipid metabolism Nucleotide metabolism Amino acid metabolism Metabolism of other amino acids Glycan biosynthesis and metabolism Metabolism of cofactors and vitamins Metabolism of terpenoids and polyketides Biosynthesis of other secondary metabolites Xenobiotics biodegradation and metabolism
Chemical structure transformation maps 3-Hydroxybutyrate
A 8 12 24 36 52Control 8 12 24 36 52AD 0.0 2.0 Conc. (µmol/g) KEGG pathway ** ** ** Control AD Control AD Creatinine Taurine ANOSIM R = 0.215, p < 0.001
Pathway Total 1 Hits 2 Expect 3 Fold
Change 4 p Value Hit Metabolites
Methionine
Metabolism 43 11 3.44 3.20 <0.001
AMP, Adenosine, N,N-Dimethylglycine, Choline, Gly,
Ser, Met, Homoserine, Sarcosine, Putrescine, Methionine sulfoxide Glycine and
Serine Metabolism
59 11 4.72 2.33 0.005 AMP, Creatine, N,N-Dimethylglycine, Gly, Ala, Thr, Ser, Sarcosine, O-Phosphoserine, Met, ADP Purine
Metabolism 74 11 5.93 1.85 0.028
Adenine, AMP, Adenosine, Gly, Guanine, Guanosine, Hypoxanthine, Xanthine, dAMP, ADP-ribose, ADP Thiamine
Metabolism 9 3 0.72 4.16 0.029 AMP, Thiamine, ADP
Alanine
5
Firmicutes, and Proteobacteria; in contrast, the taxa that were present at higher proportions in the control group were only belonging to Firmicutes. The relative abundance of the taxa which the absolute amount values exceeded the threshold in both PC2 coefficients and OPLS-DA covariances are shown in the box plots in Figure 3.3E. These results indicated that microbial memberships and structure differed between the control and AD groups; however, there were no significant differences in alpha diversity scores between the microbiota present in the two dietary groups. Furthermore, to investigate the functions of the microbial community, predicted metagenome profiles were generated by PICRUSt based on the observed 16S rRNA gene sequences. PICRUSt showed that several Kyoto Encyclopedia of Genes and Genomes (KEGG) pathways were significantly different between the control and AD groups, although the overall compositions were similar.
Figure 3.3 AD consumption alters intestinal microbiome profiles
(A) Bar graph showing the relative abundance of top 10 most-abundant genera (average abundance in all samples >1%) in control and AD mice; (B) Unweighted and (C) weighted UniFrac PCoA and ANOSIM comparing the intestinal microbiome profiles of control and AD mice; (D) Bar graph showing bacterial genera that had |OPLS-DA covariance| > 0.11 based on OPLS-DA of the microbiome profiles of control and AD mice. The model
resulted in one predictive and one orthogonal four components with the cross-validated predictive ability Q2 (cum) = 0.832 and the total explained variance R2X (cum) = 0.918; (E) Box plots indicating relative abundance of genera that have |LDA score| > 2.0, |OPLS-DA covariance| > 0.11 in OPLS-DA, and FDR <
0.05 based on Mann–Whitney U test and
Benjamini-Hochberg correction between the control and AD groups. Significant differences are indicated by * FDR < 0.05, ** FDR < 0.01.
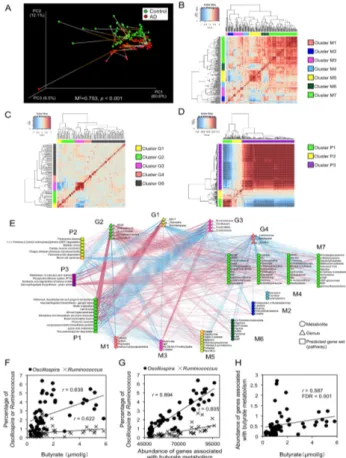
To clarify the relationship between intestinal metabolome and microbiome profiles in the control and AD groups, Procrustes analysis combining PCA of the metabolome profiles and weighted UniFrac PCoA of the microbiome profiles were conducted to co-visualize the data. Procrustes analyses revealed that plots of both the metabolome and microbiome separated into 2 groups depending on dietary conditions (Figure 3.4A). This result suggested that both metabolome and microbiome profiles are affected by dietary components, consistent with the results shown in Figures 3.2B and 3C. Additionally, Procrustes analyses showed the similarity between the metabolome and microbiome plots, suggesting that there were some associations between intestinal microbial structure and metabolome profile.
We next performed correlation and network analysis to comprehensively understand the crosstalk between microbes and metabolites. To simplify the complex relationships among intestinal microbiome abundance, gene sets, and metabolites, autocorrelation maps and hierarchical clustering analysis (HCA) were used to construct clusters that had the same patterns of changes. The metabolites, genera, and gene sets were clustered into 7 (cluster M1–M7), 5 (cluster G1–G5), and 3 (cluster P1–P3) clusters, respectively (Figure 3.4B–D).
To obtain more detailed information about the entire interactions between each bacterial taxon, gene set, and metabolite, especially those that differed significantly between the control and AD groups, Spearman's rank correlation coefficients were calculated, and significantly correlated pairs (FDR < 0.05) were plotted in the form of a network graph (Figure 3.4E). The genera belonging to cluster G2 tended to show positive correlation with clusters P1, M2, M4, M5, M6, and M7 (containing parameters that were more abundant in control mice), and to show negative correlations with clusters M1, M3, and P3. Similar correlation patterns were observed for the genera in cluster G1 and clusters P1 and P3, however there were a few positive correlations with metabolites. Clusters G3 and G4 consisted predominantly of taxa that were present at higher proportions in the AD group, and
these clusters typically exhibited positive
correlations with metabolites of cluster M1, and 0 2 4 6 G68 -0.8 -0.6 -0.4 -0.2 0.0 0.2 0.4 0.6 Unclassified Clostridiales 1 Oscillospira Unclassified Prevotellaceae Unclassified Lachnospiraceae Unclassified Clostridiales 2 Coprococcus Ruminococcus Unclassified Erysipelotrichaceae [Ruminococcus] Unclassified Clostridiaceae Prevotella Bacteroides Unclassified S24-7 0.0 0.5 1.0 1.5 2.0 G47 0 1 2 G69 0 5 10 G19 0.0 0.5 1.0 G51 0.0 0.3 0.6 0.9 1.2 G76 B C -0.15 -0.10 -0.05 0.00 0.05 0.10 -0.3 -0.2 -0.1 0.0 0.1 0.2 0.3 PCo1 (70.8%) PC o2 (9 .0 % ) Control AD D PCo1 (5.1%) PC o2 (3 .6 % ) -0.3 -0.2 -0.1 0.0 0.1 0.2 -0.3 -0.2 -0.1 0.0 0.1 0.2 0.3 Control AD Unclassified Clostridiaceae Unclassified Erysipelotrichaceae Unclassified Clostridiales Oscillospira Ruminococcus Unclassified Prevotellaceae ** ** ** ** ** ** Control AD Control AD E R el at ive a bu nd an ce (% ) R el at ive a bu nd an ce (% ) R el at ive a bu nd an ce (% ) 0.00 0.25 0.50 0.75 1.00 1.25 G59 A Bacteroides Prevotella Unclassified Prevotellaceae Unclassified S24-7 Lactobacillus Unclassified LachnospiraceaeRuminococcus Unclassified Ruminococcaceae Oscillospira Unclassified Clostridiales Others Coprococcus ** Control AD 8 12 24 36 52(weeks) Control AD R el at ive a bu nd an ce (% ) 100 80 60 40 20 0 8 12 24 36 52 OPLS-DA covariance ANOSIM R = 0.429, p < 0.001 ANOSIM R = 0.144, p = 0.019
negative correlations with metabolites of clusters M2, M5, and M6. However, clusters G3 and P3 showed positive correlations with M3; in contrast, cluster G4 showed negative correlations with M4 and M7.
Figure 3.3 Metabologenomic approach reveals the interactions among abundances of microbial genus, predicted gene set, and metabolite concentration
(A) Procrustes analysis combining PCA of intestinal metabolome profiles (end of white line) and weighted UniFrac PCoA of microbiome profiles (end of orange line). The fit of Procrustes transformation over the first
three dimensions is reported as the M2 value;
Autocorrelation maps of (B) metabolites, (C) bacterial genera, and (D) predicted bacterial gene sets (KEGG pathway) based on Spearman’s rank correlation coefficients. Red and blue indicate positive and negative correlation, respectively. Hierarchical clustering based on Euclidean distance was used to separate each metabolite/genus/gene set into clusters shown as side bars (to the right of the respective panels); (E) Bacterial genera, predicted gene sets, and metabolites that differed significantly between control and AD were assessed by network analysis. The pairs that yielded significant correlation between each bacterial genus, predicted gene set, and metabolites based on Spearman’s rank correlation coefficients (FDR < 0.05) are portrayed in this network graph. Node shapes denote the type of dataset (circle,
metabolites; triangle, genera; square, predicted gene set). Green and red outline colors of nodes denote significantly higher abundance in control or AD group, respectively. Inside color of nodes indicate the clusters defined in Figure 4B-D. Pink and light blue lines denote positive
and negative correlation, respectively. Positive
correlations (F) between relative abundances of
Oscillospira/Ruminococcus and butyrate amount (r =
0.638, FDR < 0.001 for Oscillospira; r = 0.622, FDR <
0.001 for Ruminococcus), (G) between relative
abundance of Oscillospira/Ruminococcus, and abundance
of genes associated with butyrate metabolism (r = 0.894,
FDR < 0.001 for Oscillospira; r = 0.805, FDR < 0.001 for
Ruminococcus), and (H) between abundance of genes
associated with butyrate metabolism and butyrate concentration (r = 0.587, FDR < 0.001).
While a large number of potential pairs yielded significant correlations, we focused on the relationships between the microbiome and butyrate, a metabolite that is known to be produced by intestinal microbiota [59]. In the present work, the amount of butyrate showed significant positive correlation with the relative abundances of bacteria
belonging to the genus Oscillospira and
Ruminococcus (Figure 3.4F). Additionally, the result
of PICRUSt showed that predicted abundances of genes associated with butyrate metabolism correlated significantly with the proportion of
Oscillospira and Ruminococcus, and with fecal
butyrate concentration (Figure 3.4G,H). Moreover, there was significant positive correlation between amount of butyrate and predicted gene abundance of butyryl CoA:acetate CoA transferase that converts between butyryl-CoA and butyrate. It has been reported that some bacterial genera belonging to the
Clostridiales, including Oscillospira, produce
butyrate from dietary fiber [60], suggesting that our
metabologenomic approach could be used for the detection of the possible interactions between intestinal microbiota and metabolites.
Taken together, these results suggested that our metabologenomic approach has the potential to
screen the intestinal microbiota-metabolites
interactions based on analyses of metabolome, microbiome, and metagenome datasets. For the future studies, we could integrate a shotgun metagenome dataset from intestinal microbiome instead of predicted metagenome profiles from 16S rRNA-encoding gene sequences. Moreover, it is better to be conducted transcriptome and/or proteome analysis to prove the microbiome activity. Additionally, for metabolome datasets, other technologies such as liquid chromatography and/or gas chromatography mass spectrometry could be utilized as a complementary tool to obtain in-depth profiles of metabolites that are known to be associated with the function of gut microbiota such
7
as lipids, bile acids, and sugars. Our original integrated approach has the potential to be expanded by including other powerful analytical techniques to yield more detailed and comprehensive information about the intestinal environment. Therefore, the metabologenomic approach is expected to provide new insights into the function of the intestinal microbiota, especially for the investigation of the effects of small alterations in the intestinal environment. The detailed information about this
Chapter is available in published paper [61].
Chapter 4
Ecological robustness of human
intestinal environment in response to
fluctuations in daily diets
With the expansion of intestinal microbiome research, studies have revealed that microbes and their resulting metabolic alterations (>600 microbial metabolites) are related to multiple diseases (>35), dietary interventions, exposure to metals, and/or antibiotic treatment [62]. Using this accumulated knowledge, studies of the health state of the gut microbiome and/or host phenotyping based on intestinal environment factors such as microbiome and/or metabolome profiles have gained increased attention. For example, the intestinal microbiome is an important factor in the development of inflammatory bowel disease and colorectal cancer. Recent studies showed that the relative abundance of several specific bacterial species could modulate the efficacy of immune checkpoint inhibitors [63-65]. Other previous studies showed that human gut microbiome profiles are associated with the area of residence [66-70] and long-term dietary pattern [71, 72]; and that metagenomic features based on the intestinal microbiome could be used for identification of the owners of intestinal microbial community, because the >80% of individuals of 50 subjects could still be uniquely identified up to a year later based on their metagenomic features of intestinal microbiome [73].
Additionally, gut microbiome-derived
metabolites such as deoxycholate (DCA),
trimethylamine (TMA), trimethylamine N-oxide
(TMAO), and 4-ethylphenylsulfate are associated with development of hepatic cancer [4], atherosclerosis [11-13], and neurodevelopmental disorders [16], respectively. Therefore, fecal metabolome profiles are thought to be useful for reflecting the intermediate phenotype promoting microbial effects on the host [74]. Previous studies have been conducted to investigate the differences in fecal metabolome profiles between people living in different areas and with different lifestyles [68, 70], and between those of healthy subjects and
patients [39]. The results suggested that the fecal metabolome profiles are altered by environmental factors such as dietary habits, residence, and health state. However, in these studies, only one time point of sample was examined, and the number of studies reporting inter- and intra-individual differences of fecal metabolome profiles in healthy baseline conditions was quite limited.
Therefore, this study was conducted to investigate the robustness of the human intestinal environment including metabolome profiles in response to daily dietary fluctuations. A total of 206 fecal samples were obtained from 30 healthy Japanese subjects under 3 different dietary phases. According to the comparison of Euclidian distance between each metabolome profiles and UniFrac distance between each microbiome profiles, the distances between samples from the same individuals were significantly less than those from other individuals. Additionally, there were no significant intra-individual changes across the phases in microbiome profiles of all subjects, and in metabolome profiles of 6 out of 7 subjects. The
α-diversity of microbiome profile of the subject
whose intestinal metabolome profiles were significantly changed across the phases was the lowest in these 7 subjects. These results indicated that human intestinal metabolome and microbiome profiles are unique in individuals and are robust against daily dietary fluctuation in many cases.
Chapter 5
Concluding remarks
Intestinal microbiota are a complex community that inhabits the gastrointestinal tract of animals. They are strongly associated with host physiology and have received increased attention as a new target for the prevention and/or treatment of various diseases. Because the development mechanisms of some diseases involve metabolites produced by the intestinal microbiome, studies on metabolites present in the intestine are important for determining the microbiome structure.
Recent advances in high-throughput
molecular biology techniques, including
high-throughput DNA sequencing and mass spectrometry, coupled with advancements in the field of computer science, have caused a large shift in systems biology and in intestinal microbiology. The advancements in technology have enabled scientists to conduct large-scale data-driven studies to provide novel insights into processes such as those described in Chapter 1. Additionally, this has created numerous research problems to be solved, such as how to obtain a dataset and analyze the obtained data.
develop an analytical method for evaluating the
intestinal environment based on both
high-throughput-sequencing-based microbiome and
capillary electrophoresis time-of-flight mass
spectrometry (CE-TOFMS)-based metabolome
analyses. We compared extraction methods for fecal metabolome analysis based on CE-TOFMS. Next, we developed a computational analytical strategy for metabologenomics involving integrated analysis of
mass spectrometry-based metabolome and
high-throughput-sequencing-based microbiome data. Using this method, the effects of diet on the murine and human intestinal environment were investigated.
Firstly, in Chapter 2, the
CE-TOFMS-based fecal metabolite profiles
obtained from 8 different extraction methods, which differed in fraction, homogenization and extraction solvents, and requirement of bacterial cell disruption, were compared to investigate the effects of different extraction methods on fecal metabolite profiles. Statistical analysis of these metabolome profiles indicated that metabolites 2, 8, and 51 were significantly changed depending on the method of cell disruption, homogenization solvent, and extraction solvent, respectively. Our results suggested that the metabolome profile is altered depending on the extraction methods, and thus selecting an extraction method suitable for an application is a major factor in the metabolome analysis of fecal samples. A part of the results described in Chapter 2 was published [75], which was then re-examined under additional extraction conditions in this study. During recent years, studies on fecal metabolome analysis have increased; however, when I began the fecal metabolome analysis in 2010, only a few studies were conducted in this field. The CE-TOFMS-based fecal metabolome approach has been described in a recent review article [76]; although this approach is considered as the choice for fecal metabolome analysis, to the best of my knowledge, this is the first study to compare the effects of extraction method on CE-TOFMS-based fecal metabolome [75].
In Chapter 3, we present the
metabologenomic analysis developed, which is a method for integration analysis of fecal metabolome profiles and intestinal microbiome profiles [61]. 16S rRNA-encoding gene-sequencing data are frequently used for predicting the intestinal microbiome structure, such as the type and level of microbes. Metagenomic analysis based on whole genome sequencing data is advantageous for determining the microbial structure and the gene abundance of the microbiome. Determining the type of enzymes present in microbes requires expensive sequencing and computational analysis methods to compare 16S
rRNA amplicon sequences. Phylogenetic
Investigation of Communities by Reconstruction of Unobserved States (PICRUSt) is a useful tool for predicting the metagenomic dataset from amplicon sequencing of the 16S rRNA-encoding gene dataset. PICRUSt predictions showing a Spearman's correlation coefficient of more than 0.8 with metagenome sample abundances across all body sites were investigated in the Human Microbiome Project [54]. However, the metagenomic dataset does not reveal how enzymes in the microbiota function in the intestine. To determine the activities of enzymes derived from microbiota, transcriptomic
and/or proteomic approaches are needed.
Furthermore, after determining the microbial composition and gene expression datasets and/or abundance of enzymes, a metabolome analysis is required to investigate the factors that directly modulate host physiology. Intestinal metabolome profiles reflect the total condition affected by intestinal microbiome activity, host digestion, and absorption, as well as the components of diet consumed by a host. The results described in Chapter 4 suggest that fecal metabolome profiles reflect the resulting metabolome conditions that are modulated by intestinal microbiota and/or the host rather than directly derived from food residues, as the fecal metabolome profiles of healthy human tend to differ among individuals even when they consumed the same meals. Additionally, the metabolites that were expected to be directly affected by host dietary conditions accounted for less than 25% of the total detected metabolites. It is expected that utilizing germ-free and/or gnotobiotic animals will help distinguish between the effects of the host and intestinal microbiota on the fecal metabolome.
Our metabologenomic approach indicated that the feces obtained from mice that were fed an American diet (AD) contained higher amounts of butyrate and propionate and higher relative
abundance of Oscillospira and Ruminococcus than
those in mice that were fed a control diet. The amount of butyrate was positively correlated with the abundance of these bacterial genera. Furthermore, the integrated analysis of the metabolome and predicted metagenomic data from PICRUSt indicated that the predicted gene abundance of butyryl CoA:acetate CoA transferase, which facilitates the conversion of butyryl-CoA and butyrate, was positively correlated with the fecal butyrate amount.
In Chapter 4, we present the
metabologenomics approach applied to determine the effects of daily diets on human fecal metabolome and intestinal microbiome profiles to validate the robustness of each profile. The results suggested that the human intestinal metabolome and microbiome profiles were unique in individuals and
9
robust against daily dietary fluctuations in most subjects. The stability of intestinal metabolome profiles was verified in individuals and predicted to be associated with the diversity of the intestinal microbial community. Our findings emphasize that not only human intestinal microbiome profiles, but also fecal metabolome profiles have unique features, which may contribute to the evaluation of health status and in-depth understanding of intestinal ecosystems.
Metabologenomic approach is an
integrated analysis that combines microbiome and metabolome analyses. These two methods correspond to the upper and bottom layers of a series of steps involved in multi-omics analysis from genomics to metabolomics. Although how a microbiome works and which organisms are involved in the production and utilization of metabolites are still unclear, a metabologenomic approach can reveal the intestinal conditions and organisms that are likely associated with the production and/or utilization of metabolites. Thus, the metabologenomic approach is a relatively rapid and easy method for evaluating the intestinal environment. This method may be useful for evaluating the host condition and diagnosing diseases, possibly via health monitoring systems, including devices that have access to the internet, in the future. Additionally, this analytical strategy can be expanded by utilizing other omics-analysis
including metagenome analysis, other
mass-spectrometry-based metabolome analysis, transcriptome analysis, and proteome analysis to clarify the black box mechanisms underlying host-microbiome crosstalk.
Finally, the analytical approach
combining microbiome and metabolome analyses developed in this study can facilitate further analyses of the microbiome in the intestinal and other environments. I hope that the data described here can become a cornerstone in the field of intestinal microbiome studies via multi-omics analysis to enhance our understanding of the intestinal environment.
References
1. Sekirov I, Russell SL, Antunes LC, et al. (2010) Gut
microbiota in health and disease. Physiological
reviews 90(3):859-904.
2. Arthur JC, Perez-Chanona E, Muhlbauer M, et al.
(2012) Intestinal inflammation targets
cancer-inducing activity of the microbiota. Science 338(6103):120-123.
3. Belcheva A, Irrazabal T, Robertson SJ, et al. (2014)
Gut microbial metabolism drives transformation of
msh2-deficient colon epithelial cells. Cell
158(2):288-299.
4. Yoshimoto S, Loo TM, Atarashi K, et al. (2013) Obesity-induced gut microbial metabolite promotes liver cancer through senescence secretome. Nature
499(7456):97-101.
5. Kau AL, Ahern PP, Griffin NW, et al. (2011)
Human nutrition, the gut microbiome and the
immune system. Nature 474(7351):327-336.
6. Ridaura VK, Faith JJ, Rey FE, et al. (2013) Gut microbiota from twins discordant for obesity
modulate metabolism in mice. Science
341(6150):1241214.
7. Schulz MD, Atay C, Heringer J, et al. (2014)
High-fat-diet-mediated dysbiosis promotes intestinal
carcinogenesis independently of obesity. Nature
514(7523):508-512.
8. Qin J, Li Y, Cai Z, et al. (2012) A
metagenome-wide association study of gut
microbiota in type 2 diabetes. Nature
490(7418):55-60.
9. Le Chatelier E, Nielsen T, Qin J, et al. (2013) Richness of human gut microbiome correlates with
metabolic markers. Nature 500(7464):541-546.
10. Forslund K, Hildebrand F, Nielsen T, et al. (2015) Disentangling type 2 diabetes and metformin treatment signatures in the human gut microbiota.
Nature 528(7581):262-266.
11. Koeth RA, Wang Z, Levison BS, et al. (2013)
Intestinal microbiota metabolism of l-carnitine, a nutrient in red meat, promotes atherosclerosis.
Nature medicine 19(5):576-585.
12. Wang Z, Klipfell E, Bennett BJ, et al. (2011) Gut flora metabolism of phosphatidylcholine promotes cardiovascular disease. Nature 472(7341):57-63.
13. Wang Z, Roberts AB, Buffa JA, et al. (2015)
Non-lethal inhibition of gut microbial
trimethylamine production for the treatment of atherosclerosis. Cell 163(7):1585-1595.
14. Cahenzli J, Koller Y, Wyss M, et al. (2013)
Intestinal microbial diversity during early-life colonization shapes long-term ige levels. Cell host
& microbe 14(5):559-570.
15. Thorburn AN, McKenzie CI, Shen S, et al. (2015) Evidence that asthma is a developmental origin disease influenced by maternal diet and bacterial
metabolites. Nature communications 6:7320.
16. Hsiao EY, McBride SW, Hsien S, et al. (2013) Microbiota modulate behavioral and physiological abnormalities associated with neurodevelopmental disorders. Cell 155(7):1451-1463.
17. Kadowaki A, Miyake S, Saga R, et al. (2016) Gut environment-induced intraepithelial autoreactive CD4(+) T cells suppress central nervous system
autoimmunity via LAG-3. Nature communications
7:11639.
18. Buffington SA, Di Prisco GV, Auchtung TA, et al.
(2016) Microbial reconstitution reverses maternal diet-induced social and synaptic deficits in offspring.
Cell 165(7):1762-1775.
19. Sampson TR, Debelius JW, Thron T, et al. (2016) Gut microbiota regulate motor deficits and neuroinflammation in a model of Parkinson's disease. Cell 167(6):1469-1480.e1412.
20. Olson CA, Vuong HE, Yano JM, et al. (2018) The
gut microbiota mediates the anti-seizure effects of the ketogenic diet. Cell 173(7):1728-1741.e1713.
21. den Besten G, van Eunen K, Groen AK, et al.
(2013) The role of short-chain fatty acids in the interplay between diet, gut microbiota, and host
energy metabolism. Journal of lipid research
54(9):2325-2340.
22. Flint HJ, Scott KP, Louis P, et al. (2012) The role of the gut microbiota in nutrition and health. Nature
reviews. Gastroenterology & hepatology 9(10):577-589.
23. Alexeev EE, Lanis JM, Kao DJ, et al. (2018)
Microbiota-derived indole metabolites promote human and murine intestinal homeostasis through
regulation of interleukin-10 receptor. The American
Journal of Pathology 188(5):1183-1194.
24. Rothhammer V, Mascanfroni ID, Bunse L, et al.
(2016) Type I interferons and microbial metabolites of tryptophan modulate astrocyte activity and central nervous system inflammation via the aryl
hydrocarbon receptor. Nature medicine
22(6):586-597.
25. LeBlanc JG, Milani C, de Giori GS, et al. (2013) Bacteria as vitamin suppliers to their host: A gut
microbiota perspective. Current opinion in
biotechnology 24(2):160-168.
26. LeBlanc JG, Chain F, Martin R, et al. (2017) Beneficial effects on host energy metabolism of short-chain fatty acids and vitamins produced by commensal and probiotic bacteria. Microbial cell
factories 16(1):79.
27. Di Martino ML, Campilongo R, Casalino M, et al.
(2013) Polyamines: Emerging players in
bacteria-host interactions. International journal of
medical microbiology : IJMM 303(8):484-491.
28. Kibe R, Kurihara S, Sakai Y, et al. (2014)
Upregulation of colonic luminal polyamines produced by intestinal microbiota delays senescence in mice. Scientific reports 4:4548.
29. Wahlstrom A, Sayin SI, Marschall HU, et al. (2016)
Intestinal crosstalk between bile acids and
microbiota and its impact on host metabolism. Cell
metabolism 24(1):41-50.
30. Soga T, Baran R, Suematsu M, et al. (2006)
Differential metabolomics reveals ophthalmic acid as an oxidative stress biomarker indicating hepatic glutathione consumption. The Journal of biological
chemistry 281(24):16768-16776.
31. Soga T, Ohashi Y, Ueno Y, et al. (2003)
Quantitative metabolome analysis using capillary
electrophoresis mass spectrometry. Journal of
proteome research 2(5):488-494.
32. Wang X, Wang J, Rao B, et al. (2017) Gut flora profiling and fecal metabolite composition of colorectal cancer patients and healthy individuals.
Experimental and therapeutic medicine
13(6):2848-2854.
33. Raman M, Ahmed I, Gillevet PM, et al. (2013) Fecal microbiome and volatile organic compound metabolome in obese humans with nonalcoholic fatty liver disease. Clinical gastroenterology and
hepatology 11(7):868-875.e861-863.
34. Bjerrum JT, Wang Y, Hao F, et al. (2015)
Metabonomics of human fecal extracts characterize ulcerative colitis, crohn's disease and healthy
individuals. Metabolomics 11:122-133.
35. Hong YS, Hong KS, Park MH, et al. (2011)
Metabonomic understanding of probiotic effects in humans with irritable bowel syndrome. Journal of
clinical gastroenterology 45(5):415-425.
36. Bezabeh T, Somorjai R, Dolenko B, et al. (2009) Detecting colorectal cancer by 1H magnetic resonance spectroscopy of fecal extracts. NMR in
biomedicine 22(6):593-600.
37. Monleon D, Morales JM, Barrasa A, et al. (2009) Metabolite profiling of fecal water extracts from
human colorectal cancer. NMR in biomedicine
22(3):342-348.
38. Marchesi JR, Holmes E, Khan F, et al. (2007) Rapid
and noninvasive metabonomic characterization of
inflammatory bowel disease. Journal of proteome
research 6(2):546-551.
39. Le Gall G, Noor SO, Ridgway K, et al. (2011) Metabolomics of fecal extracts detects altered metabolic activity of gut microbiota in ulcerative colitis and irritable bowel syndrome. Journal of
proteome research 10(9):4208-4218.
40. De Preter V, Van Staeyen G, Esser D, et al. (2009)
Development of a screening method to determine the pattern of fermentation metabolites in faecal
samples using on-line purge-and-trap gas
chromatographic-mass spectrometric analysis.
Journal of chromatography. A 1216(9):1476-1483.
41. Weir TL, Manter DK, Sheflin AM, et al. (2013) Stool microbiome and metabolome differences between colorectal cancer patients and healthy adults. PloS one 8(8):e70803.
42. Phua LC, Chue XP, Koh PK, et al. (2014)
Non-invasive fecal metabonomic detection of
colorectal cancer. Cancer biology & therapy
15(4):389-397.
43. Brown DG, Rao S, Weir TL, et al. (2016)
Metabolomics and metabolic pathway networks from human colorectal cancers, adjacent mucosa, and stool. Cancer & metabolism 4:11.
44. Sinha R, Ahn J, Sampson JN, et al. (2016) Fecal microbiota, fecal metabolome, and colorectal cancer interrelations. PloS one 11(3):e0152126.
45. Frankel AE, Coughlin LA, Kim J, et al. (2017) Metagenomic shotgun sequencing and unbiased metabolomic profiling identify specific human gut microbiota and metabolites associated with immune checkpoint therapy efficacy in melanoma patients.
Neoplasia 19(10):848-855.
46. Cao H, Huang H, Xu W, et al. (2011) Fecal
metabolome profiling of liver cirrhosis and
hepatocellular carcinoma patients by ultra
performance liquid chromatography-mass
spectrometry. Analytica chimica acta
691(1-2):68-75.
47. Huang HJ, Zhang AY, Cao HC, et al. (2013)
Metabolomic analyses of faeces reveals
malabsorption in cirrhotic patients. Digestive and
liver disease 45(8):677-682.
48. Weingarden AR, Chen C, Bobr A, et al. (2014) Microbiota transplantation restores normal fecal bile acid composition in recurrent clostridium difficile
infection. American journal of physiology.
Gastrointestinal and liver physiology
306(4):G310-319.
49. Kolho KL, Pessia A, Jaakkola T, et al. (2017) Faecal and serum metabolomics in paediatric inflammatory bowel disease. Journal of Crohn's &
colitis 11(3):321-334.
50. Jacobs JP, Goudarzi M, Singh N, et al. (2016) A disease-associated microbial and metabolomics state in relatives of pediatric inflammatory bowel disease patients. Cellular and molecular gastroenterology
and hepatology 2(6):750-766.
51. Monton MR & Soga T (2007) Metabolome analysis by capillary electrophoresis-mass spectrometry.
Journal of chromatography. A 1168(1-2):237-246;
discussion 236.
52. Xia J, Psychogios N, Young N, et al. (2009)
MetaboAnalyst: A web server for metabolomic data analysis and interpretation. Nucleic acids research 37(Web Server issue):W652-660.
11
53. Caporaso JG, Kuczynski J, Stombaugh J, et al.
(2010) QIIME allows analysis of high-throughput
community sequencing data. Nature methods
7(5):335-336.
54. Langille MG, Zaneveld J, Caporaso JG, et al. (2013)
Predictive functional profiling of microbial communities using 16S rRNA marker gene
sequences. Nature biotechnology 31(9):814-821.
55. Bylesjö M, Rantalainen M, Cloarec O, et al. (2006)
Opls discriminant analysis: Combining the strengths
of PLS-DA and simca classification. Journal of
Chemometrics 20(8‐10):341-351.
56. Trygg J & Wold S (2002) Orthogonal projections to
latent structures (O-PLS). Journal of Chemometrics
16(3):119-128.
57. Trygg J (2002) O2-PLS for qualitative and quantitative analysis in multivariate calibration.
Journal of Chemometrics 16(6):283-293.
58. Segata N, Izard J, Waldron L, et al. (2011)
Metagenomic biomarker discovery and explanation.
Genome biology 12(6):R60.
59. Furusawa Y, Obata Y, Fukuda S, et al. (2013) Commensal microbe-derived butyrate induces the differentiation of colonic regulatory T cells. Nature 504(7480):446-450.
60. Gophna U, Konikoff T, & Nielsen HB (2017)
Oscillospira and related bacteria - from
metagenomic species to metabolic features.
Environmental microbiology 19(3):835-841.
61. Ishii C, Nakanishi Y, Murakami S, et al. (2018) A metabologenomic approach reveals changes in the intestinal environment of mice fed on American diet.
International journal of molecular sciences 19(12).
62. Lamichhane S, Sen P, Dickens AM, et al. (2018)
Gut metabolome meets microbiome: A
methodological perspective to understand the
relationship between host and microbe. Methods
149:3-12.
63. Matson V, Fessler J, Bao R, et al. (2018) The commensal microbiome is associated with anti-PD-1 efficacy in metastatic melanoma patients. Science 359(6371):104-108.
64. Gopalakrishnan V, Spencer CN, Nezi L, et al.
(2018) Gut microbiome modulates response to anti-pd-1 immunotherapy in melanoma patients.
Science 359(6371):97-103.
65. Routy B, Le Chatelier E, Derosa L, et al. (2018) Gut microbiome influences efficacy of PD-1-based
immunotherapy against epithelial tumors. Science
359(6371):91-97.
66. De Filippo C, Cavalieri D, Di Paola M, et al. (2010) Impact of diet in shaping gut microbiota revealed by a comparative study in children from europe and rural africa. Proceedings of the National Academy of Sciences of the United States of America 107(33):14691-14696.
67. Lin A, Bik EM, Costello EK, et al. (2013) Distinct
distal gut microbiome diversity and composition in healthy children from Bangladesh and the united states. PloS one 8(1):e53838.
68. Kisuse J, La-Ongkham O, Nakphaichit M, et al.
(2018) Urban diets linked to gut microbiome and metabolome alterations in children: A comparative
cross-sectional study in Thailand. Frontiers in
microbiology 9:1345.
69. Yatsunenko T, Rey FE, Manary MJ, et al. (2012) Human gut microbiome viewed across age and
geography. Nature 486(7402):222-227.
70. Turroni S, Fiori J, Rampelli S, et al. (2016) Fecal
metabolome of the Hadza hunter-gatherers: A
host-microbiome integrative view. Scientific reports
6:32826.
71. Wu GD, Chen J, Hoffmann C, et al. (2011) Linking
long-term dietary patterns with gut microbial enterotypes. Science 334(6052):105-108.
72. Claesson MJ, Jeffery IB, Conde S, et al. (2012) Gut
microbiota composition correlates with diet and health in the elderly. Nature 488(7410):178-184. 73. Franzosa EA, Huang K, Meadow JF, et al. (2015)
Identifying personal microbiomes using
metagenomic codes. Proceedings of the National
Academy of Sciences of the United States of America 112(22):E2930-2938.
74. Zierer J, Jackson MA, Kastenmuller G, et al. (2018)
The fecal metabolome as a functional readout of the
gut microbiome. Nature genetics 50(6):790-795.
75. Ishii C, Nakanishi Y, Tomita M, et al.(2015) The comparison of extraction methods for the analysis of
gut luminal metabolites. Keio SFC Jouranl
15(1):414-430.
76. Xu J, Zhang Q-F, Zheng J, et al. (2019) Mass spectrometry-based fecal metabolome analysis.