ISSN: 1927-5196 / E-ISSN:1927-520X/12 © 2012 Lifescience Global
Estimation of Body Weight and Body Surface Area in Swamp
Buffaloes using Visual Image Analysis
C. Buranakarl*
,1, J. Indramangala
2, K. Koobkaew
2, N. Sanghuayphrai
2, J. Sanpote
2, C.
Tanprasert
3, T. Phatrapornnant
3, W. Sukhumavasi
1and P. Nampimoon
11
Faculty of Veterinary Science, Chulalongkorn University, Bangkok, 10330, Thailand
2
Department of Livestock Development, Ministry of Agriculture and Cooperatives, Bangkok, 10400, Thailand
3
National Electronics and Computer Technology Center (NECTEC), National Science and Technology Development Agency (NSTDA), Ministry of Science and Technology, Patumthani, 12120, Thailand
Abstract: The three dimensional computerized visual image analysis was performed to evaluate the body weight (BW) and body surface area (BSA) in swamp buffaloes. Nineteen swamp buffaloes were measured the conformation by linear measurement compared to 3D body scanner at different points : body height (A), heart girth (B), shoulder width (C), iliac width (D), ischial tuberosity width (E), the length between shoulder and ileac wing (F, G), the length between ileal wing to ischial tuberosity (H, I) and the length between shoulder to ischial tuberosity (J1, J2). The significant correlation was found between these two methods. The 3D body scanner was then performed in 28 males and 39 females for BW and 68 males and 74 non-pregnant and 31 pregnant females for BSA estimation. The appropriate models to estimate BW in buffaloes were BW = - 1174.07 + 4.31 (B) + 7.75 (FG) (R2 = 0.76, P<0.001), BW (male) = -1265.99 + 4.94(B) + 14.41(D) (R2 = 0.81; P<0.001) and BW (female) = -563.66 + 7.94 (C) + 14.77 (E) (R2 = 0.86; P<0.001). For BSA, the appropriate equations were BSA = -4.31 + 0.034(A) + 0.036 (J1J2) (R2 = 0.82, P<0.001), BSA (male) = -4.01 + 0.032 (A) + 0.037 (J1J2) (R2 = 0.816, P<0.001) and BSA (female) = -3.50 + 0.013(A) + 0.012 (B) + 0.040 (E) + 0.015 (J1J2) (R2 = 0.916, P<0.001). In conclusion, the 3D body scanner can be used to estimate BW and BSA in buffaloes with different models among males and females.
Keywords: 3D body scanner, body weight, body surface area, swamp buffalo.
INTRODUCTION
Swamp buffaloes (Bubalus bubalis) is the indigenous species found in native Thai farmer household long times ago. The awareness of buffaloes number and conformation were raised since the population was declined from 6.4 millions in 1982 to 1.36 millions in 2008 [1] although they have still been used for cultivation by farmer in Thailand. Body weight (BW) is one of the most important parameters for breeding improvement while the body surface area (BSA) is commonly used in animal production research and in drug treatment. Due to difficulties in weighting or measuring the body surface area in large animals where the scale needs to be installed with time consuming and high cost, the linear and angular parameters measured by tape or ruler has been readily used instead. Recently, the morphologic parameters obtained by the 3D computerized imaging scanner have been used to evaluate live weight in Mediterranean buffaloes [2]. This device is superior since the morphological parameters can be obtained rapidly by photographic image and the measurement can be carried out at a distance. Moreover, the body
*Address corresponding to this author at the Faculty of Veterinary Science, Chulalongkorn University, Bangkok, 10330, Thailand; Tel: +662 2189747; Fax: +662 2189741; E-mail: [email protected]
surface area (BSA) can also be estimated. The objectives of this study were to calculate the appropriate equations to estimate the body weight and body surface using the morphological parameters obtained from 3D scanner in swamp buffaloes of both sexes.
MATERIALS AND METHODS
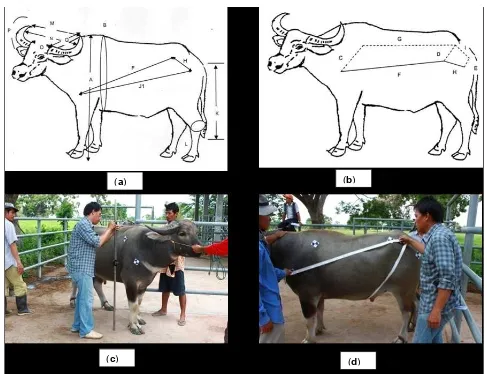
The study was performed in accordance with institutional guideline and conformed to the Faculty of Veterinary Science, Chulalongkorn University. In order to determine the accuracy of data obtained from 3D scanner compared with data from measurement manually with tape, ruler, and caliper, 19 buffaloes of both sexes in Surin province of Thailand were used. The information that need to compare were body height (A), heart girth (B), shoulder width (C), iliac width (D), ischial tuberosity width (E), the average length between left and right shoulder to ileal wing (FG), the average length between left and right ileac wing to ischial tuberosity (HI) and the average length between left and right shoulder to ischial tuberosity (J1J2) (Figure 1a-d).
68 males, 74 non-pregnant female and 31 pregnant buffaloes.
Measurement by 3D Body Scanner
The 3D scanning was carried out on each buffaloes using stereo camera (Figure 2a) technique. The 3D scanner (see Figure 2b) consisted of 16 black and white Fire wire cameras with a resolution of 640 x 480 pixels, 6 video projectors used for illuminating structured light on to the scanned object [3]. There were 4 personal computers (PCs) used in this system, one was a master PC that synchronized another 3 PCs, which controlling groups of cameras and video projectors. The scan volume of the 3D scanner was 100cm x 220cm x 160cm (width x length x height) and the accuracy of the scanner is less than 1 mm when the object is scanned at range in between 1 – 2 meters.
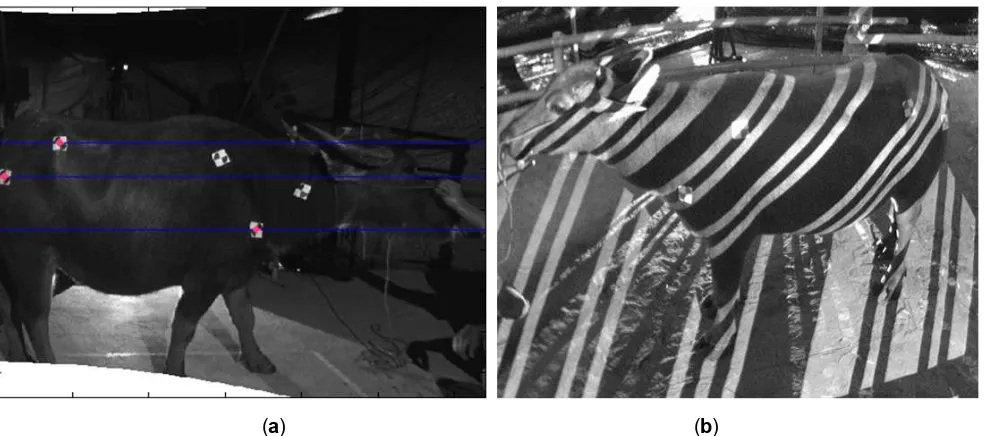
Before scanning, the eight adhesive paper markers were attached on the skin at the tip of shoulder, the top of scapular, the top of the ileac wing and the ischial
tuberosity on both left and right sides of the animals (Figure 3a). The marker was used as guidance for assisting the measurement done by computer software. In the scan process, after the animal was placed inside the dark cell and stood still, the structured light patterns were projected on the animal surface area (Figure 3b). The scanning duration took only about six seconds and there were 160 images taken. The data density of 3D model was about 80,000 – 150,000 points.
The captured images obtained by 3D body scanner were sent to the computer in order to reconstruct 3D data by using principle of triangulation [4]. The 3D data of each view was then rotated and translated, according to the location of each camera pairs in world coordinate, to its right position. The 3D model of swamp buffalo, in a form of point cloud, was then created as shown in Figure 4a.
The conformation of the scanned buffalo could directly measure from the cloud of points. Figure 4b
Figure 1: Linear parameters measuring on body surface of buffalo used for estimation of body weight and body surface area (a and b). The length of each parameter was measured by ruler (c) and tape (d) in comparison to 3D scanner.
(a) (b)
(a) (b)
Figure 2: A stereo camera with an VDO projector (a). The 3D scanner consisted of 16 cameras, 6 VDO projectors and 4 PCs (b).
(a) (b)
Figure 3: Markers were placed on the buffalo’s skin (a) and the structured light pattern was projected on a scanned buffalo (b).
(a) (b)
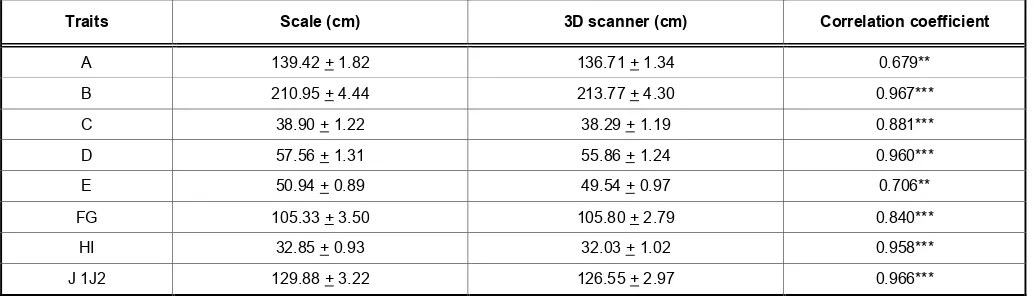
Table 1: The Parameters Obtained from Human Measurement Compared with 3D Scanner
Traits Scale (cm) 3D scanner (cm) Correlation coefficient
A 139.42 + 1.82 136.71 + 1.34 0.679**
Data are expressed as mean + SEM, **=P<0.01, ***=P<0.001, using Pearson correlation.
shows the measurement of the heart girth, height, and knee girth. The body surface area was obtained by summation of the number of the lattice points using 3D scanner as described earlier [5]. To estimate surface area, the body of buffalo model was vertically sliced from the tip of nose to the bottom, typically having 200 slices. If the circumference of each slice multiplied by slice thickness and then we summed the products of all slices, the body surface area was obtained. The surface area of legs was done in the same way as that of body but the slices were horizontal. However, the obtained surface area excluded horn and hoof.
Statistical Analysis
Data were expressed as mean + SEM. The morphological survey was compared to 3D body scanner reliability using Pearson correlation. The body weight and body surface area were estimated from the parameters obtained by 3D body scanner using simple and multiple regression analysis. The polynomial regression was performed to estimate weight compared with simple linear regression from each individual point. The statistical analysis was performed using SAS program and the significances were determined when P values was less than 0.05.
RESULTS
The mean + SEM of body parts (traits) measured by scale (ruler and tape) and 3D scanner in 19 buffaloes were shown in Table 1. The correlation of the two methods was highly significant (p< 0.01) in all traits.
Estimation of Body Weight in Swamp Buffaloes
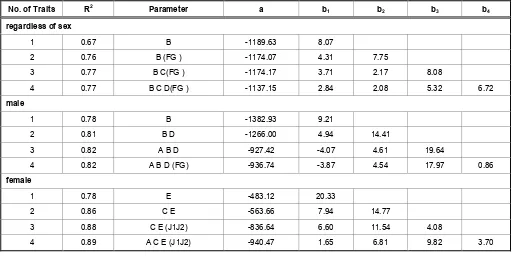
Estimations of body weight were performed using linear regression analysis in all buffaloes regardless of sex and is shown in Table 2. Regardless of sex (n =
67), body length (FG) in the single traits equation yielded the highest coefficient of determination (R2 = 0.68) while the equation including B or D gave lower R2 (0.67). However, the equation using B is recommended because B is easier to be determined and has less error than D and FG (Table 2). The regression analysis of 2 traits (B and FG and D and FG), 3 traits (BD and equation yielded the same level of R2 (0.81-0.82). The appropriate equation for weight estimation was recommended as BW (male) = -1265.99 + 4.94(B) + raised to 0.86 when the C was included in the two traits equation. However, incorporating of 3 and 4 traits yielded only small increase of R2 (0.88-0.89). Hence, the appropriate equation was BW (female) = -563.66 + 7.94 (C) + 14.77 (E).
for male buffaloes was BW (male) = 6640.49 + 103.146(B)-0.534(B2) + 0.000976 (B3), R2 = 0.82. In female, the ishiatic tuberosity width (E) is recommended to be used in for the weight estimation as BW (female) = 12208.252 - 728.582(E) + 14.587 (E2) - 0.0938 (E3), R2 =0.81.
Surface Area
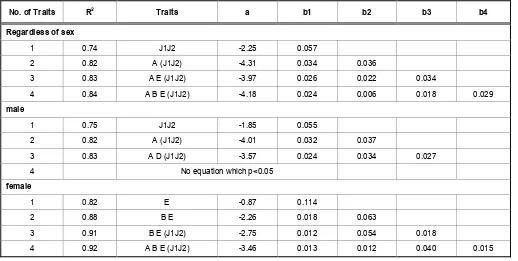
The coefficient of determination (R2) of body surface area (BSA) estimation in buffaloes regarding of sex, male and female buffaloes were shown in Table 4. With regardless of sex (n = 173), it was shown that the body length (J1J2) was highly correlated with surface area (R2 = 0.74). The higher R2 was found when the height (A) was included (R2 = 0.82). However, the slight increases in R2 were found when more traits were included in the equation. The appropriate formula for surface area prediction is BSA = -4.31 + 0.034(A) + 0.036(J1J2).
When surface area was considered in male buffaloes (n = 68), the same parameter J1J2 yielded the highest R2 of 0.75. Similar results were found when adding the height (A) into the equation. The appropriate equation is BSA (male) = -4.01 + 0.032(A) + 0.037(J1J2).
In female buffaloes (n = 105), the ileal width (E) in the single trait equation had highest R2 of 0.82. The heart girth (B), body length (J1J2) and the height (A) yield less R2. The R2 was increased when including heart girth (B) into the equation. When adding the body length (J1J2) and height (A) into the equation the R2 were increased to 0.91 and 0.92, respectively. Thus, the appropriate equation was BSA (female) = -3.46 + 0.013 (A) + 0.012 (B) + 0.040 (E) + 0.015 (J1J2).
DISCUSSION
Determination of the body weight using the important points of morphological interest has long
Table 2: Regression Analysis for Weight Estimation in Swamp Buffaloes
No. of Traits R2 Parameter a b1 b2 b3 b4
regardless of sex
1 0.67 B -1189.63 8.07
2 0.76 B (FG ) -1174.07 4.31 7.75
3 0.77 B C(FG ) -1174.17 3.71 2.17 8.08
4 0.77 B C D(FG ) -1137.15 2.84 2.08 5.32 6.72
male
1 0.78 B -1382.93 9.21
2 0.81 B D -1266.00 4.94 14.41
3 0.82 A B D -927.42 -4.07 4.61 19.64
4 0.82 A B D (FG) -936.74 -3.87 4.54 17.97 0.86
female
1 0.78 E -483.12 20.33
2 0.86 C E -563.66 7.94 14.77
3 0.88 C E (J1J2) -836.64 6.60 11.54 4.08
4 0.89 A C E (J1J2) -940.47 1.65 6.81 9.82 3.70
P<0.01.
Table 3: The Coefficient of Determination of Single Traits Polynomial Equation for Body Weight Estimation in Buffaloes
Traits A B C D E FG HI J1J2
all 0.42** 0.75** 0.28** 0.77** 0.59** 0.73** 0.40** 0.64**
male 0.36* 0.82** 0.20ns 0.86** 0.50** 0.80** 0.54** 0.67**
female 0.61** 0.62** 0.71** 0.66** 0.81** 0.58** 0.15ns 0.68**
*p<0.05 **p<0.01 ns
been performed. Weight can be estimated by creating formula using the geometric points obtained from body surface points measuring manually. For the later date, new technology has been used in order to yield the quick and accurate measurement of body weight using 3D body scanner and computerized visual image analysis software. The visual image analysis was introduced in Mediterranean buffaloes (Bubalus bubalis L.) to estimate live weight [6]. The image analysis method was also used to estimate weight in cow compared with weight estimated by body length in order to solve the problem of stress, danger and the difficulty to weight large animals on the scale [7]. Recently, visual image analysis was used to estimate live weight and body condition score in lactating Mediterranean buffaloes using linear parameters, angular parameters and three surface parameters [2].
By comparing between linear measurements using stick measured manually and the 3D scanner in 19 buffaloes showed the closed correlation. The differences between the two expressed as covariance were ranged between 0.45-2.95%. There was a high degree of accuracy and precision using 3D body scanner. Therefore, the linear measurements obtained from 3D body scanner were used to estimate the body weight and body surface area. The gold standard for weight measurement was digital scale.
In our study, the scanner was used as a tool for measuring many different points on body surface of buffaloes and data were used to estimate body weight. The correlation coefficients for a single parameter were 0.68, 0.67 and 0.67 by using body length till point of ischial wings, heart girth and girdle width, respectively. Previous studies by Chantalakhana et al. [8] demonstrated the highest correlation by using body height (0.82) while the heart girth was also correlated well (R2 = 0.74). Later study showed the heart girth was the crucial point for calculating body weight in different age of buffaloes such as R2 of 0.93 in buffaloes from weaning until 2 years old [9], 0.97, in swamp buffaloes from weaning to adult [10] and 0.97 in swamp buffaloes 2-4 years of age [11]. All four studies had higher R2 compared with our study since the number of buffaloes included in the study was higher.
It was noticed that by using the polynomial equation of the single parameter yield the results of R2 was higher than the simple linear regression on every parameters of male and female buffaloes. These results were similar to the study in swamp buffaloes by Jintana et al. [12]. Therefore, if body weight is estimated by using single parameter, polynomial equation may be more appropriated.
Although heart girth is the common points that earn a high and a significant correlation, our study showed
Table 4: Regression Analysis of Body Surface Area Estimation in Swamp Buffaloes
No. of Traits R2 Traits a b1 b2 b3 b4
Regardless of sex
1 0.74 J1J2 -2.25 0.057
2 0.82 A (J1J2) -4.31 0.034 0.036
3 0.83 A E (J1J2) -3.97 0.026 0.022 0.034
4 0.84 A B E (J1J2) -4.18 0.024 0.006 0.018 0.029
male
1 0.75 J1J2 -1.85 0.055
2 0.82 A (J1J2) -4.01 0.032 0.037
3 0.83 A D (J1J2) -3.57 0.024 0.034 0.027
4 No equation which p<0.05
female
1 0.82 E -0.87 0.114
2 0.88 B E -2.26 0.018 0.063
3 0.91 B E (J1J2) -2.75 0.012 0.054 0.018
4 0.92 A B E (J1J2) -3.46 0.013 0.012 0.040 0.015
that the R2 was increased up to 0.76 when body length was added into the estimation equation for buffaloes regardless of sexes. Therefore, two parameters may be more suitable to use regardless of sexes. Imwattana estimation. The ischial width was incorporated into every equation whether using single or multiple regression analysis. Thus, the weight predictor using the tape measured the heart girth and transformed to weight estimation that has been used in the field may not be accurate in female buffaloes.
Rather than the body weight, the body surface area has long been known to be beneficial in calculating the dose of medication especially in large animals. It has also been used in many scientific researches especially when the body functions are compared in different size of the animals. Many researches showed the high relationship between body surface area and the body weight. Study in human showed the high correlation between these parameters and best fit equations have been developed. One of the good equation belongs to Du Bois and Du Bois (1915)[14] which showed that the BSA = 71.84 x H.725 x W.425 and it has been widely used in human. Similar equations were adapted and used in many species such as in pig (BSA = 970 W0.633) [15] and in cat (BSA = 388.4 x W + 896.5) [16]. It was noticed that the equation may be varied depending on the species and the point of measurement. Since the BSA was difficult to obtained, the 3D body scanner was introduced to fit the problem. The BSA can be obtained by a summation of the number of the lattice points which is proportionate to the area of the planar object [5]. The BSA yielded by computer analysis was used in various conditions such as to measure and select for weight and morphological traits in live rabbits and carcasses [17]. The new technique using 3D anthropometrical computerized scanner and BSA integration software yielded the results of BSA with accuracy checking within 1.0% and created the better formula between BSA and weight in human (BSA = 71.3989 x H.7437 x W.4040) [18]. Moreover, their study showed that the equation is good for both genders. The BSA from photogrammetry was also related to body
weight in pig (BSA in cm2 = 734 x W in kg0.656) [19]. In our study, the prime determinants for body surface area estimation in both sexes were body length and height which is not surprising. However, BSA in female requires other points such as heart girth and the width between ischial tuberosities to yield higher accuracy. In conclusion, weighting of swamp buffaloes may not be practical in the paddle field. Simple measurement of geometric line upon the body surface can be used to estimate both body weight and body surface area. The models used were different among males and females.
ACKNOWLEDGEMENT
This work was supported by a grant from Ratchadaphiseksompot Endowment Fund,
Chulalongkorn University, Bangkok, Thailand.
REFERENCES
[1] Department of Livestock Development, PhyaThai Rd., Bangkok, Thailand, Annual report 2551. http://www.dld.go.th.
[2] Negretti P, Bianconi G, Bartocci S, Terramoccia S, Verna M. Determination of live weight and body condition score in lactating Mediteranean buffaloes by visual image analysis. Livest Sci 2008; 113: 1-7.
http://dx.doi.org/10.1016/j.livsci.2007.05.018
[3] Jain R, Kasturi R, Schunck BG. Eds. Machine Vision. MIT Press and McGraw-Hill Inc. 1995: pp. 301-4.
[4] Hartley R, Zisserman A. Eds. Multiple View Geometry in Computer Vision. 2nd Ed. Cambridge University Press 2003: pp. 310-3.
[5] Ziegel J, Kiderlen M. Estimation of surface area and surface area measure of three-dimentional sets from digitization. Image Vision Comput 2010; 28: 64-77.
http://dx.doi.org/10.1016/j.imavis.2009.04.013 Proceedings of the 9th International conference on computer systems and technologies 2008: V.8-1 till V.8-7.
[8] Chantalakhana C, Bunyavejchewin P, Faarungsarng S, Kamnerdpetch V. Estimates of heritability and relationship of body weight, gains and measurements of swamp buffalo. Annual Report. The Naional Buffaloes Research and Development Center Project. Bangkok, Thailand 1983.
[12] Jintana R, Suthikrai W, Hengtakulsin R, Sophon S, Usawang S, Kamonpatana M. Relationship between heart girth and body weight of weaned swamp buffalo and Murrha X swamp buffaloes calves. In: Enhancement of Reproductive Efficacy and Production of Livestock in Thailand, Chiangmai, Thailand 2006; pp. 1-7.
[13] Imwattana S, Vudhipanee P. Estimates of genetic parameters for growth and body measurements of swamp buffalo using animal model. Annual Report on Animal Production Research, Animal Breeding and Farm Management. Department of livestock development, Ministry of agriculture and cooperation 2001; pp.104-115.
[14] Du Bois D, Du Bois EF. The measurement of the surface area of man. In: Archives of Internal Medicine, Clinical Calorimetry. fifth paper 1915; pp. 868-81.
[15] Brody S, Comfort JE, Matthews JS. Further investigations on surface area with special reference to its significance in energy metabolism. Mo Aes Res Bull 1928; 115: 1-60.
[16] Vaughan JA, Adams T. Surface area of the cat. J Appl Physiol 1967; 22(5): 956-8.
[17] Negretti P, Bianconi G, Finzi A. Visual image analysis to estimate morphological and weight measurements in rabbits. World Rabbit Sci 2007b; 15: 37-41.
[18] Yu C-Y, Lin C-H, Yang Y-H. Human body surface area database and estimation formula. Burns 2010; 36: 616-29. http://dx.doi.org/10.1016/j.burns.2009.05.013
[19] Kelly KW, Curtis SE, Marzan GT, Karara, HM, Anderson CR. Body surface area of female swine. J Anim Sci 1973; 36: 927-30.
Received on 01-01-2012 Accepted on 08-02-2012 Published on 15-03-2012