Laboratory Work Guide
FUNDAMENTAL OF HHYSICS
Disusun Oleh :
Yusman Wiyatmo, M.Si.
JURUSAN PENDIDIKAN FISIKA
FAKULTAS MATEMATIKA DAN ILMU PENGETAHUAN ALAM
UNIVERSITAS NEGERI YOGYAKARTA
EXPERIMENT 1
MEASSUREMENT AND UNCERTAINTY
A. Objectives:
1. Measure mass of object and its uncertainty. 2. Meassure volume of object and its uncertainty 3. Determine density of mass and its uncertainty
B. Matterial/Apparatus
1. Cube of metal (object) 2. Meassuring glass 3. Mass Balancing
C. Procedure
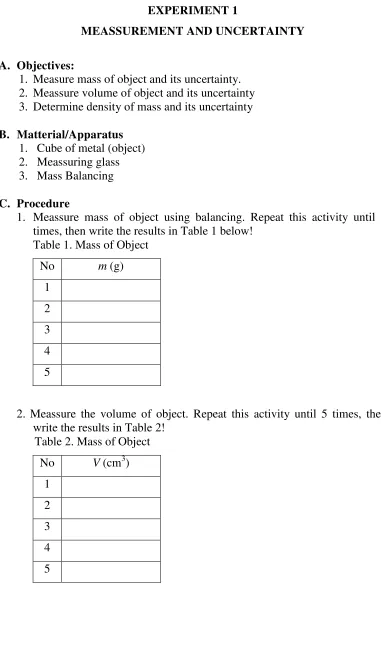
[image:2.612.135.516.69.719.2]1. Meassure mass of object using balancing. Repeat this activity until 5 times, then write the results in Table 1 below!
Table 1. Mass of Object
No m (g)
1 2 3 4 5
2. Meassure the volume of object. Repeat this activity until 5 times, then write the results in Table 2!
Table 2. Mass of Object No V (cm3)
D. Data Analysis
1.Table 3. Data Analysis of Mass
No m (g) mm (g)
1 2 3 4 5 ∑
The average mass:
... ... ... 5
mn m m
The uncertainty of mass:
... ... ... 5
m mn m m m
Result of mass object: m
mm
...2.Table 4. Data Analysis of Volume No V (cm3) V V (cm3
) 1 2 3 4 5 ∑
The average volume:
... ... ... 5
Vn V V
The uncertainty of mass:
... ... ... 5
V Vn V V V
Result of mass object: V
V V
...3.Determine the density
...
EXPERIMENT 2. CALORIMETER
A. Goal
Determine the specific heat capacity of substance ( Alluminium)
B. Equipment/Material
Calorimeter, thermometer, stirer, bunsen burner, tripot, electronics balance, alluminium, water, chemical glass.
C. Principle
Specific heat of Alluminium (c) can be determined using Black’s principle using equation:
T T m T T c m c m c a i w w k k ( ) (1)
Where: T: equilibrium temperatur
Ti: initial temperatur of calorimeter system (water and calorimeter)
Ta: initial temperatur of Alluminium
C. Procedur
4. Meassure the mass of calorimeter and stirer mk
5. Meassure the mass of Alluminium m
6. Poure water in calorimeter about 2/3 part of volume of the calorimeter 7. Meassure the mass of calorimeter and water
8. Determine the mass of water mw
9. Using chemical glass which is filled with water and alluminium, heat the chemical glass using bunsen burner until the water boiled.
10. Meassure the temperature of Alluminium Ta
11. Meassure the initial temperature of calorimeter system Ti
12. Put the alluminium in calorimeter
13. Stir the calorimeter system using stirer until the equilibrium temperature occured 14. Meassure the equilibrium temperature T
D.Data of Experiment
calorimeter thermometer
Stirer isolator
water Alluminium
Figure1. Calorimeter
E. Data Analysis
1. Determine the specific heat of alluminium using equation (1)!
T T
mT T c m c m c
a
i w
w k k
( )
c =
EXPERIMENT 3. SPEED OF SOUND IN AIR
A. Goal
Determine speed of sound in air based on resonance of sound in air coulumn
B. Material and Apparatus
1. Audio Frequency Generator (AFG) 2. Amplifier
3. Glass tube equiped by scales 4. Speaker
5. Water
C. Principle
Relation between velocity of wave (v), frequency (f), and wave length (λ) can be written:
f
v
(1)Relation between the length of air column and wave length of sound when resonance is occurred can be written:
k
4
)
1
n
2
(
L
n
(2)Where :
= wave length of sound (meter)
Ln = length of air column at n ressonance (meter)
n = n = 1,2,3,4,….. k = 0.3 x diameter of tube
D. Procedure
1. Switch on the amplifier and AFG
2. Adjust the AFG in certain frequency, meassure the frequency f
3. Move down ward the water level in tube until the first resonance is occurred, then meassure the length of air column L1
4. Move down ward the water level in tube until the second ressonance is occurred, then meassure the length of air column L2
E. Data of Experiment
No f (hertz) n =1 L1 (cm)
n =2 L2 (cm)
Speaker
Sumber
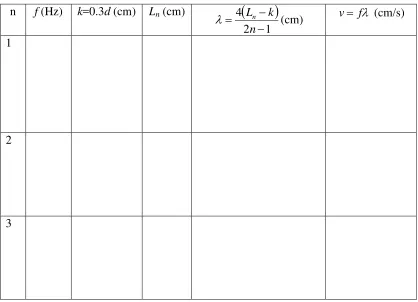
F. Data Analysis
Determine the speed of sound in air.
n f (Hz) k=0.3d (cm) Ln (cm)
1 2 4
n k Ln
(cm) v f (cm/s)
1
2
3
air
AFG AMPLIFIER
[image:7.612.111.529.412.714.2]RESERVOIR
EXPERIMENT 4. THERMOCOUPLE
A. Goal
Determine the Seebeck constant (s) of thermocouple
B. Equipment and material
1. Thermocouple 2. Thermometer 3. Voltmeter 4. Ice
5. Water
C.Principle
Relation between the hot junction temperature (Th), cold junction temperatur (Tc),
and the Seebeck potential (V) can be written:
Th Tc
S
V (1)
Where S = Seebeck Constant
D.Procedure
metal A metal B metal A
TT
1. Set the apparatus as shown in figure above. 2. Meassure the themperature of cold junction Tc
3. Meassure the themperature of hot junction Th
4. Meassure the Seebeck potential V using digital voltmeter 5. Increase themperature of hot junction using heater 6. Repeat step 2-5 until four times
E.Data of Experiment
No Tc (oC) Th (oC) V (volt) 1
2 3 4 5
Tc Th
F. Data Analysis
Make a graph the relation between Seebeck potential V and gradient of temperature
c h T
T T
V
T
The Seebeck constant S can be determined by compute the gradient of graph above.
......
EXPERIMENT 5. PARARELY PLATE CAPACITOR
A. Goal
Determine the electric permitivity of dielectric material
B. Equipment and material
1. Pararely plate capacitor 2. Capacitymeter
3. Connected cable 4. PVC plate
C.Principle
Relation between capacity of capacitor C and and the distance of both plates in pararely plate capacitor d can be written:
d A
C (1)
Where ԑ = electric permitivity of material, A = area of plate
D.Procedure
1. Set the apparatus as shown in figure above. 2. Meassure the distance between both plates d 3. Meassure the capacity of capacitor C
4. Repeat steps 2 until 3 four times in difference distance 5. Write data in table below
E.Data of Experiment
No d (mm) C (oC) C (µF) 1
2 3 4 5
A d
Capacitymeter
F. Data Analysis
Make a graph the relation between capacity of capacitor C and 1/d C
1/d
The electric permitivity of the dielectric material can be determined by compute the gradient of graph above.
Gradient:
... ... /1
d C m
Electric permitivity:
... ... ...
A m A m
EXPERIMENT 6. RESISTOR
A. Goal
Determine and meassure the ressistivity of resistor
B. Equipment and material
1. Resistor 2. Ohmeter
3. Connected cable
C.Principle
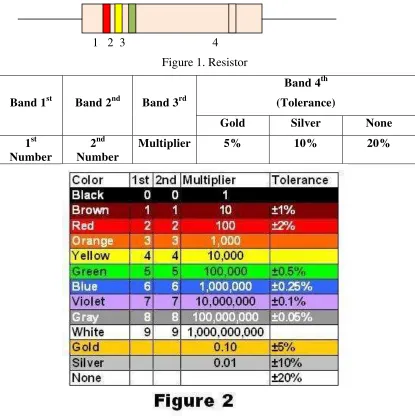
Resistivity of resistor can be determined by reading colour band as follows:
[image:12.612.112.527.291.709.2]1 2 3 4 Figure 1. Resistor
Band 1st Band 2nd Band 3rd
Band 4th
(Tolerance)
Gold Silver None
1st Number
2nd Number
D.Procedure
1. Set the apparatus as shown in figure above.
2. Determine the resistivity of resistor based on colour bands. 3. Meassure the the resistivity of resistor using Ohmmeter 4. Write data in table below
E.Data of Experiment
No Resistor R (ohm) Determined using
colour band
R (ohm) Meassured by
ohmeter
1 Resistor 1
2 Resistor 2
3 Resistor 3
F. Data Analysis
Compare the results of resistivity which determined by colour band and the resistivity which meassured by Ohmmeter!
No Meassured by colour band Meassured by ohmeter
R (ohm)
Note R (ohm) ΔR = tolerance x
R (ohm)
Result R ± ΔR
(ohm) 1
2 3
OHMMETER
EXPERIMENT 7. CRO
A. Goal
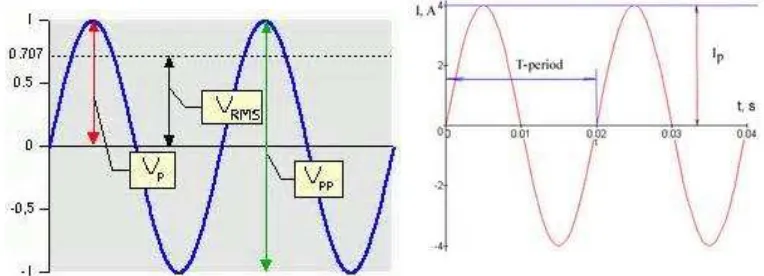
1. Meassure a peak to peak voltage Vpp .
2. Meassure frequency of sinusoidal wave
B. Equipment and material
1. CRO 2. AFG
3. AC Power Source 4. Connected cable
C.Principle
Vpp can be determined by reading the number of div and volt/div in screen of CRO.
div volt div
of number
Vpp /
[image:14.612.109.491.404.542.2]Frequency can be determined by reading the number of div and time/div in one wave length
D.Procedure
1. Set the apparatus as shown in figure above. 2. Determine the number of div from peak to peak. 3. Determine the chanel volt/div.
4. Determine the number of div in one wave length. 5. Determine the chanel of time/div
6. Write data in table below
7. Data of Experiment
Meassurement Vpp
No Number of div Volt/div Vpp (volt)
1 2 3
Meassurement frequency
No Number of div Time/div f (Hz)
1 2 3
8. Data Analysis
[image:15.612.193.422.88.239.2]Determine the Vpp and frequence of AC power source.
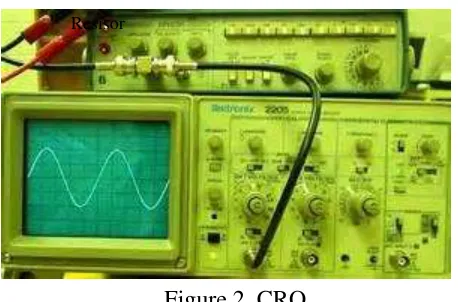
Figure 2. CRO