Full Terms & Conditions of access and use can be found at
http://www.tandfonline.com/action/journalInformation?journalCode=cbie20
Download by: [Universitas Maritim Raja Ali Haji] Date: 18 January 2016, At: 19:54
Bulletin of Indonesian Economic Studies
ISSN: 0007-4918 (Print) 1472-7234 (Online) Journal homepage: http://www.tandfonline.com/loi/cbie20
SURVEY OF RECENT DEVELOPMENTS
Tao Kong & Arief Ramayandi
To cite this article: Tao Kong & Arief Ramayandi (2008) SURVEY OF RECENT DEVELOPMENTS, Bulletin of Indonesian Economic Studies, 44:1, 7-32, DOI: 10.1080/00074910802001546 To link to this article: http://dx.doi.org/10.1080/00074910802001546
Published online: 16 Jul 2008.
Submit your article to this journal
Article views: 122
View related articles
ISSN 0007-4918 print/ISSN 1472-7234 online/08/010007-26 © 2008 Indonesia Project ANU DOI: 10.1080/00074910802001546
SURVEY OF RECENT DEVELOPMENTS
Tao Kong Arief Ramayandi
Australian National University Australian National University
and Padjadjaran University, Bandung
SUMMARY
Macroeconomic performance continued its steady improvement during 2007, with quite strong growth, moderate infl ation, a reasonably stable exchange
rate, and a strongly performing stock market. A promising sign has been rapid investment growth, although the global economic slow-down predicted for 2008 is likely to reduce Indonesia’s exports, and therefore its growth rate. Moreover, rapid increases in food and energy prices on world markets seem likely to require some tightening of monetary policy to keep infl ation in check.
The 2008 budget fi nalised in November assumed a world oil price of $60 per
barrel, even though the actual price was already closer to $90. By February it reached $100, and the government announced its intention to revise the budget further in light of this and of the likely impact of the coming global slow-down. While the impact of higher oil prices on the budget defi cit can readily be
accom-modated, the subsidy cost of holding domestic energy prices constant will be enormous. Under-spending on infrastructure continues to be a problem—partly because so much revenue is being pre-empted for subsidies, but also because funding allocations are not being fully spent, and because coordination between different government jurisdictions is lacking.
January 2008 saw the passing of former president Soeharto, whose 32 years in power dramatically reshaped the Indonesian economy. Despite the well-known human rights abuses and high level of corruption under his regime, the govern-ment observed a seven-day period of mourning, and there was a genuine display of grief on the part of many ordinary Indonesians.
There have been worrying developments in relation to two institutions estab-lished as part of Indonesia’s post-Soeharto democratisation, and in relation to the parliament (DPR) itself. The Business Competition Supervisory Commission’s decisions on the mobile phone industry appear likely to do further damage to for-eign investors’ perceptions of Indonesia, and to be harmful to consumers’ interests. The DPR’s appointment of fi ve new members of the Anti-Corruption Commission
(KPK) followed a closed-door selection process, the outcome of which suggested that the commission faces capture and subversion by other public sector institu-tions seeking to block anti-corruption efforts. Finally, a case brought by the KPK against offi cials of the central bank, including the current governor, has provided
strong evidence of the apparently widespread practice of government agencies bribing DPR members.
BIESApr08.indb 7
BIESApr08.indb 7 29/2/08 9:49:09 PM29/2/08 9:49:09 PM
MAJOR EVENTS
On the international front, Indonesia successfully hosted the enormous UN Frame-work Convention on Climate Change meeting in Bali during December. The event involved over 10,000 delegates and observers from 180 countries, and put Indo-nesia on the world centre stage for two weeks. There was some irony in the fact that Indonesia is the world’s third-largest contributor to the production of green-house gases owing to the vast scale of forest-clearing activity. A new international mechanism to encourage slowing deforestation was discussed, but at the core of the negotiations was the question of what commitments developing countries would make to limit greenhouse gas emissions in future, and the continued unwillingness of the USA to commit to emissions targets. With high drama in the effort to obtain consensus, the conference managed at the last minute to produce a ‘Bali Roadmap’ that set timetables and parameters for vital negotiations about the follow-up to the Kyoto Protocol, which expires in 2012. For Indonesia this was a success in terms of foreign policy. Both environment minister Rachmat Witoelar, as president of the conference, and Indonesia’s President Susilo Bambang Yudhoyono, who involved himself in the efforts to break the fi nal deadlock, can claim some credit.
Of far greater impact on the general populace, former President Soeharto passed away on 27 January 2008. Under his leadership from 1966 until 1998 Indonesia achieved sustained high rates of economic growth and a considerable reduction in poverty, and was transformed from the ‘prime economic under-performer’ in Southeast Asia into a ‘newly industrialising economy’ (Thee 2001). His New Order regime will also be remembered, however, for political repression, for widespread human rights abuses (especially in East Timor, Aceh and Papua) and for the exten-sive system of corruption over which he presided, all of which resulted in his being forced to resign when the economic crisis of the late 1990s robbed the regime of per-formance legitimacy. The fi nal notable item in his long list of strong actions against
those who dared openly to criticise him was to secure in August 2007 a Supreme Court reversal of earlier court decisions in favour of Time magazine, which Soeharto had sued for defamation. The Supreme Court ordered Time to pay $106 million in damages; a petition for a review of the ruling was lodged in February. Despite the many black marks against the former president’s name, the government declared a seven-day period of national mourning, and many observers were struck by the genuine display of grief on the part of ordinary Indonesians at his passing.
MACROECONOMIC DEVELOPMENTS
Macroeconomic performance in 2007 was sound. Output (GDP) growth contin-ued its steady upward trend through the third quarter, falling back a little in the fourth, and exactly achieving the 6.3% expansion assumed in the budget for 2007. Open unemployment has continued its gradual downward trend, from 10.5% in February 2006 to 9.1% in August 2007. Consumer prices rose by 6.6% in the calen-dar year, almost exactly the same rate as assumed in the budget, and only a little above the mid-point of the central bank’s target range (6 ± 1%). The exchange rate against the US dollar has been reasonably stable, with a 4.4% depreciation through 2007. The main stock market index showed a healthy return of more than 50% to investors over the year, notwithstanding a short-lived setback early in the second half: the Indonesian stock market was the third-best performer in the
BIESApr08.indb 8
BIESApr08.indb 8 29/2/08 9:49:09 PM29/2/08 9:49:09 PM
region (Trimegah Research 2008). All categories of bank lending have been grow-ing rapidly.
This solid performance was achieved despite recent turbulence in international
fi nancial markets in the second half of the year. In July 2007 the ‘sub-prime
lend-ing’ crisis in the US found many fi nancial institutions heavily exposed to high-risk
borrowers in the home mortgage market. This resulted in upward adjustments of interest rates in many countries, and it is widely expected that world economic growth will slow appreciably in 2008 as a consequence. The sudden upheaval in global fi nancial markets has been accompanied by rapid increases in oil and
food prices. These major external developments, and the way they are likely to be handled by policy makers, call into question the likelihood that the Indonesian economy will perform as well in 2008 as it did in 2007.
Economic growth
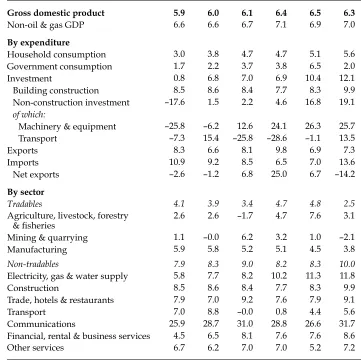
Year-on-year GDP growth continued to accelerate through the third quarter (Q3) of 2007, reaching 6.5%—a rate exceeded in only one quarter (Q4 2004) in the crisis period—before declining slightly to 6.3% in the fourth quarter. Non-oil and gas GDP continued to grow at a somewhat higher rate of around 7.0% for the last three quarters of 2007 (table 1). Household consumption absorbs almost two-thirds of GDP and, while still growing a little more slowly than the economy as a whole (at 5.6%), has continued to accelerate over the past six quarters, suggesting that indi-viduals are increasingly confi dent about future prospects. Likewise, the growth of
investment spending, while much more volatile, accelerated signifi cantly during
the last half of 2007, suggesting that this confi dence extends to the business sector.
The capacity for future growth depends, of course, on investment.
The pattern of investment spending has been changing somewhat recently. Although building construction growth accelerated noticeably in the second half of 2007, to reach 9.9% in Q4, the acceleration of non-construction investment was even more dramatic, with the growth rate moving from only 1.5% in December 2006 to over 19% a year later. This outcome was dominated by investment in machinery and equipment, which recorded extremely rapid growth in the last three quarters of 2007. A possible explanation for this is that businesses have tired of waiting for the government to reform the labour market laws, and have decided instead to substitute capital for labour in the production process. Invest-ment in transport turned around dramatically in the second half of 2007, from highly negative to quite strongly positive.
Both exports and imports have been growing a little more rapidly than the economy as a whole, but import growth almost doubled in the December quar-ter, causing net exports to contract after growing strongly during the fi rst three
quarters. Solid global demand and consequent price increases in the international market resulted in record high export values in 2007. Total merchandise exports in 2007 amounted to $114 billion, 13.1% higher than for the same period in 2006, with an even larger increase of 15.5% recorded for non-oil and gas items, to $92 billion (CEIC Asia Database).1 Meanwhile, imports of raw materials have also
been increasing at a rapid pace, as has the much smaller category of capital goods
1 In this journal, ‘$’ refers to the US dollar. The exchange rate at the end of January 2008 was Rp 9,291/$.
BIESApr08.indb 9
BIESApr08.indb 9 29/2/08 9:49:09 PM29/2/08 9:49:09 PM
imports; consumer goods imports have also been buoyant, refl ecting accelerating
growth in consumption overall (fi gure 1).
On the production side of the national income accounts, growth of the non-tradables sector remains consistently more rapid than that of the non-tradables sector, with the differential between them widening signifi cantly in the fourth quarter
of 2007 (table 1). Most of the sub-sectors within non-tradables have continued to experience robust growth, with communications the stand-out performer. Performance of the transport sub-sector was quite poor in 2007, however, con-sistent with a declining level of investment in the fi rst half; this, in turn, may
have refl ected insuffi cient spending by governments on transport infrastructure
(roads, ports, airports, railways and so on). Nevertheless, the growth rate in TABLE 1 Components of GDP growth
(2000 prices; % p.a. year on year)
Sep-06 Dec-06 Mar-07 Jun-07 Sep-07 Dec-07
Gross domestic product 5.9 6.0 6.1 6.4 6.5 6.3
Non-oil & gas GDP 6.6 6.6 6.7 7.1 6.9 7.0
By expenditure
Household consumption 3.0 3.8 4.7 4.7 5.1 5.6 Government consumption 1.7 2.2 3.7 3.8 6.5 2.0
Investment 0.8 6.8 7.0 6.9 10.4 12.1
Building construction 8.5 8.6 8.4 7.7 8.3 9.9 Non-construction investment –17.6 1.5 2.2 4.6 16.8 19.1 of which:
Machinery & equipment –25.8 –6.2 12.6 24.1 26.3 25.7 Transport –7.3 15.4 –25.8 –28.6 –1.1 13.5
Exports 8.3 6.6 8.1 9.8 6.9 7.3
Imports 10.9 9.2 8.5 6.5 7.0 13.6
Net exports –2.6 –1.2 6.8 25.0 6.7 –14.2
By sector
Tradables 4.1 3.9 3.4 4.7 4.8 2.5
Agriculture, livestock, forestry & fi sheries
2.6 2.6 –1.7 4.7 7.6 3.1
Mining & quarrying 1.1 –0.0 6.2 3.2 1.0 –2.1
Manufacturing 5.9 5.8 5.2 5.1 4.5 3.8
Non-tradables 7.9 8.3 9.0 8.2 8.3 10.0
Electricity, gas & water supply 5.8 7.7 8.2 10.2 11.3 11.8
Construction 8.5 8.6 8.4 7.7 8.3 9.9
Trade, hotels & restaurants 7.9 7.0 9.2 7.6 7.9 9.1
Transport 7.0 8.8 –0.0 0.8 4.4 5.6
Communications 25.9 28.7 31.0 28.8 26.6 31.7 Financial, rental & business services 4.5 6.5 8.1 7.6 7.6 8.6
Other services 6.7 6.2 7.0 7.0 5.2 7.2
Source: CEIC Asia Database.
BIESApr08.indb 10
BIESApr08.indb 10 29/2/08 9:49:10 PM29/2/08 9:49:10 PM
transport recovered to 5.6% by the end of the year, after a surprisingly large adjustment in the most recently issued national accounts data to the Septem-ber quarter growth rate of investment in transport: this was revised to –1.1% from the previously reported –7.5%.2 Within the tradables sector, growth has
been generally sluggish, with the exception of the September quarter growth in the rather volatile agriculture, livestock, forestry and fi sheries sub-sector.
Manufacturing growth rates declined steadily for the entire period shown in table 1, to just 3.8% in the December quarter of 2007; it will be interesting to see whether the recent rapid expansion of investment in machinery and equipment can arrest this decline.
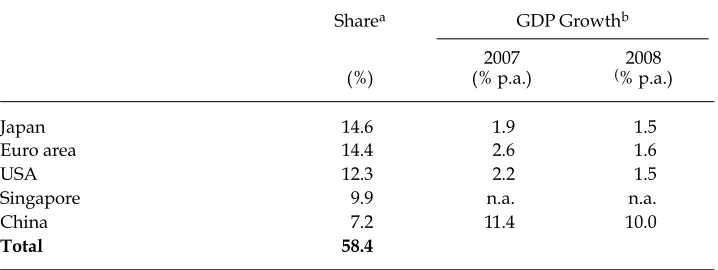
Despite this generally rosy economic growth picture, there is no room for complacency. The expected global economic slow-down is likely to hurt Indo-nesia’s growth performance through its negative impact on exports. In response to the sub-prime mortgage crisis, 2008 growth forecasts for countries and regions that are the main destinations for Indonesia’s non-oil and gas exports have been slashed; for example, the most recently available IMF World Economic Outlook Update (January 2008: IMF 2008) projects signifi cant reductions in output growth
in 2008 in the US, the euro area, Japan and elsewhere (table 2).
Aside from the external threats of a global economic slow-down and persist-ent uncertainty in fi nancial markets, Indonesia’s performance will continue to be
affected by problems of its own making—specifi cally, inadequate infrastructure
and rigidity in the labour market (Manning and Roesad 2006). The weakness of investment spending in the transport sector (until recently) and the sluggish
2 GDP data can be signifi cantly adjusted over time: the growth rate for investment in
ma-chinery and equipment was also revised upward by 2.8 percentage points in the September quarter.
FIGURE 1 Imports by Major Category ($ million)
Dec–060 Feb–07 Apr–07 Jun–07 Aug–07 Oct–07 Dec–07
1,000 2,000 3,000 4,000 5,000 6,000
0 500 1,000 1,500 2,000
Raw materials, lhs
Capital goods, rhs
Consumer goods, rhs
Source: CEIC Asia Database.
BIESApr08.indb 11
BIESApr08.indb 11 29/2/08 9:49:10 PM29/2/08 9:49:10 PM
growth of this sector have already been noted. Neglect of the infrastructure needed to control fl ooding, particularly in important commercial and industrial centres
such as Jakarta, was very clearly demonstrated when the capital was cut off from the main national airport, Cengkareng, after heavy rains at the end of January.
Fiscal policy
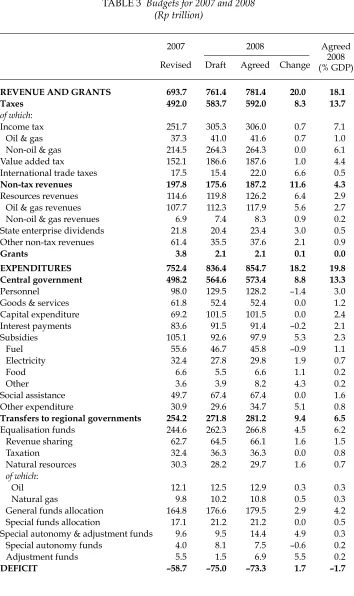
The budget for 2008 was enacted in early November 2007 (table 3). There were a number of relatively minor changes from the draft version submitted to the parliament in August, such that planned revenues increased by Rp 20 trillion and planned expenditures by Rp 18 trillion; the revised defi cit is only
negligi-bly smaller, at 1.7% of projected GDP. The main adjustments on the revenue side are a surprisingly large (proportionate) rise in international trade taxes, together with increases in oil and gas revenues and in dividends from state enterprises. On the expenditure side, there are large but unfortunately non-transparent rises in ‘Other subsidies’ and in ‘Other expenditure’, together with a range of increased transfers to regional governments, not least of which is an almost four-fold jump in ‘Adjustment funds’.
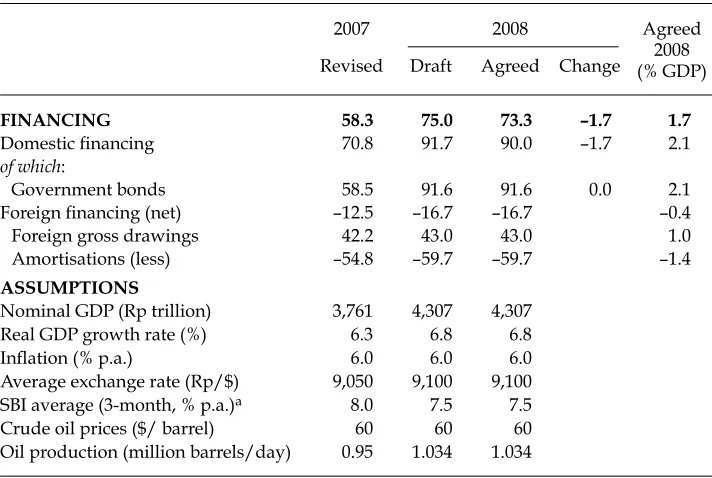
Of much greater importance than these changes is the absence of any change at all in one of the most important numbers in the entire document: the assumed world oil price, which remained at $60 per barrel. This fi gure is a little lower than
the actual average price in 2006 of $64.30 per barrel, signifi cantly less than the 2007
average of $71.10, and roughly a third less than the level of $87.60 at the end of that year. World oil prices were on a rapidly increasing trend in 2007, from $57 in Q1 to almost $88 in Q4 and, although they levelled off in January at $90.70, they exceeded $100 per barrel during part of February.3 There is little reason to believe they will
3 These data are world crude oil spot prices from World Bank, ‘Prospects for Develop-ment’ (Commodity Price Data), <http://web.worldbank.org/>.
TABLE 2 Indonesian Export Destinations: Export Shares and GDP Growth Rates
Sharea GDP Growthb
(%)
2007 (% p.a.)
2008
(% p.a.)
Japan 14.6 1.9 1.5
Euro area 14.4 2.6 1.6
USA 12.3 2.2 1.5
Singapore 9.9 n.a. n.a.
China 7.2 11.4 10.0
Total 58.4
aFor the period January–November 2007; non-oil and gas merchandise exports only.
b Growth rates are estimates for 2007 and projections for 2008.
Sources: Export shares: BPS (central statistics agency); growth rates: IMF (2008).
BIESApr08.indb 12
BIESApr08.indb 12 29/2/08 9:49:10 PM29/2/08 9:49:10 PM
average $60 per barrel for the whole of 2008. The government, particularly the Min-istry of Finance (MOF), risks being perceived as divorced from reality by making this assumption.
Yet this is clearly not the case. Indeed, the MOF has undertaken its own analysis of the impact on the budget of oil prices remaining near recent levels, and govern-ment ministers have discussed this analysis in public forums (e.g. Pangestu 2008). If the average oil price turns out to be, say, $100 per barrel in 2008, oil revenues (including income tax from oil and gas producers) are expected to increase by $13.7 billion, while expenditures on domestic fuel and electricity subsidies and additional transfers to regional governments are together expected to rise by $19.7 billion. The impact would be to increase the defi cit by about $6 billion—almost
doubling it, to about 3.0% of GDP. This increase would be large, but by no means catastrophic.
The MOF has put forward a list of nine anticipative policy measures in an attempt to assure observers of the government’s preparedness to cope with the impact of signifi cantly higher oil prices. Unfortunately the two documents
out-lining these measures (Abimanyu and Megantara 2007; Pangestu 2008) give few details, and appear to differ somewhat from each other. The discussion that fol-lows is therefore necessarily based to some extent on guesswork. The list includes both revenue-increasing and expenditure-reducing measures, and it is claimed that together they would almost exactly offset the impact of oil price increases on the budget defi cit, thus leaving it at 1.7–1.8% of GDP even if the oil price should
rise to $100 per barrel. This claim seems somewhat lacking in conviction, how-ever, because some of the items on the list are defi cit-fi nancing rather than defi
cit-reducing measures.
Defi cit-reducing measures
• Improving the effi ciency (and thus the profi tability) of Pertamina (the national
oil company) and PLN (the national electricity company), allowing an increase in dividends from the former (which accounts for about half the dividend income from all state-owned enterprises) and a decrease in subsidies to the latter
It goes without saying that this is a desirable objective, but if it is feasible, this begs the question of why the government would not move along these lines even if there were no change in the oil price. Note also that, hidden in the brief discussion of this item in Abimanyu and Megantara (2007) is the suggestion that Pertamina’s effi ciency could be improved by reducing the subsidy to consumption of fuels. Of
course it is profi tability rather than effi ciency that would be increased in this way,
but the interesting point is that these government offi cials appear here to be trying
to put the reduction of fuel subsidies back on the agenda for public discussion— albeit with a high degree of circumspection.
• Increasing/’optimising’ tax revenue and dividends from the state-owned enterprises (SOEs)
It is not clear how tax revenue from SOEs could be increased, since this depends on their profi ts, which depend on their business success, rather than being a
matter for government discretion. And although it would be possible to require them to pay higher dividends to their owner, this would simply shift the problem
BIESApr08.indb 13
BIESApr08.indb 13 29/2/08 9:49:11 PM29/2/08 9:49:11 PM
TABLE 3 Budgets for 2007 and 2008
REVENUE AND GRANTS 693.7 761.4 781.4 20.0 18.1
Taxes 492.0 583.7 592.0 8.3 13.7
of which:
Income tax 251.7 305.3 306.0 0.7 7.1
Oil & gas 37.3 41.0 41.6 0.7 1.0
Non-oil & gas 214.5 264.3 264.3 0.0 6.1
Value added tax 152.1 186.6 187.6 1.0 4.4
International trade taxes 17.5 15.4 22.0 6.6 0.5
Non-tax revenues 197.8 175.6 187.2 11.6 4.3
Resources revenues 114.6 119.8 126.2 6.4 2.9 Oil & gas revenues 107.7 112.3 117.9 5.6 2.7 Non-oil & gas revenues 6.9 7.4 8.3 0.9 0.2 State enterprise dividends 21.8 20.4 23.4 3.0 0.5 Other non-tax revenues 61.4 35.5 37.6 2.1 0.9
Grants 3.8 2.1 2.1 0.1 0.0
EXPENDITURES 752.4 836.4 854.7 18.2 19.8
Central government 498.2 564.6 573.4 8.8 13.3
Personnel 98.0 129.5 128.2 –1.4 3.0
Goods & services 61.8 52.4 52.4 0.0 1.2 Capital expenditure 69.2 101.5 101.5 0.0 2.4
Interest payments 83.6 91.5 91.4 –0.2 2.1
Subsidies 105.1 92.6 97.9 5.3 2.3
Fuel 55.6 46.7 45.8 –0.9 1.1
Electricity 32.4 27.8 29.8 1.9 0.7
Food 6.6 5.5 6.6 1.1 0.2
Other 3.6 3.9 8.2 4.3 0.2
Social assistance 49.7 67.4 67.4 0.0 1.6
Other expenditure 30.9 29.6 34.7 5.1 0.8
Transfers to regional governments 254.2 271.8 281.2 9.4 6.5
Equalisation funds 244.6 262.3 266.8 4.5 6.2
Revenue sharing 62.7 64.5 66.1 1.6 1.5
Taxation 32.4 36.3 36.3 0.0 0.8
Natural resources 30.3 28.2 29.7 1.6 0.7
of which:
Oil 12.1 12.5 12.9 0.3 0.3
Natural gas 9.8 10.2 10.8 0.5 0.3
General funds allocation 164.8 176.6 179.5 2.9 4.2 Special funds allocation 17.1 21.2 21.2 0.0 0.5 Special autonomy & adjustment funds 9.6 9.5 14.4 4.9 0.3 Special autonomy funds 4.0 8.1 7.5 –0.6 0.2
Adjustment funds 5.5 1.5 6.9 5.5 0.2
DEFICIT –58.7 –75.0 –73.3 1.7 –1.7
BIESApr08.indb 14
BIESApr08.indb 14 29/2/08 9:49:11 PM29/2/08 9:49:11 PM
elsewhere within the government sector—depriving the SOEs of cash resources that they might otherwise have used for investment.4
• Prioritisation of government expenditures; and • Use of unrealised expenditure in the budget
The government believes there is a potential for signifi cant cuts to some items in
its budgeted expenditures, but does not reveal what these might include; explicitly excluded, however, is any interruption to spending on poverty and infrastructure. In addition, there appears to be an expectation of continued spending shortfalls because of administrative bottlenecks of one kind or another, which obviously would reduce the realised defi cit.
• Modifi cation of energy policy with regard to production and subsidisation of
oil and gas and power
Expanded crude oil production would increase government revenue, but the budget already assumes an increased output of 1.034 million barrels per day (not-withstanding the fact that production has fallen short of budget assumptions for the last three years), so it is diffi cult to imagine any additional defi cit reduction
4 Changes in taxes and dividends paid by Pertamina as a result of higher oil prices are presumably already taken into account in the ministry’s analysis of the budgetary impact of the oil price.
TABLE 3 (continued) Budgets for 2007 and 2008 (Rp trillion)
2007 2008 Agreed
2008 (% GDP) Revised Draft Agreed Change
FINANCING 58.3 75.0 73.3 –1.7 1.7
Domestic fi nancing 70.8 91.7 90.0 –1.7 2.1
of which:
Government bonds 58.5 91.6 91.6 0.0 2.1
Foreign fi nancing (net) –12.5 –16.7 –16.7 –0.4
Foreign gross drawings 42.2 43.0 43.0 1.0 Amortisations (less) –54.8 –59.7 –59.7 –1.4
ASSUMPTIONS
Nominal GDP (Rp trillion) 3,761 4,307 4,307 Real GDP growth rate (%) 6.3 6.8 6.8
Infl ation (% p.a.) 6.0 6.0 6.0
Average exchange rate (Rp/$) 9,050 9,100 9,100 SBI average (3-month, % p.a.)a 8.0 7.5 7.5
Crude oil prices ($/ barrel) 60 60 60 Oil production (million barrels/day) 0.95 1.034 1.034
a SBI = Bank Indonesia Certifi cate.
Source: Ministry of Finance (2007).
BIESApr08.indb 15
BIESApr08.indb 15 29/2/08 9:49:11 PM29/2/08 9:49:11 PM
potential here. On the consumption side, Abimanyu and Megantara (2007) state that the success of the program to switch households away from (subsidised) ker-osene to natural gas is vital to cutting subsidies, but there is no indication of how this switch might be accelerated. Similarly, mention is made of bringing about a switch in the fuel mix used in electricity generation, but it is not clear how this would help to reduce the cost of producing electricity: presumably, producers are already using the least costly fuels available to them.
Defi cit-fi nancing measures
• Issue more government bonds to the general public; and • Issue bonds to regional governments in oil-producing areas
Both measures appear feasible. The rationale for the second measure is that regional governments in oil-producing areas receive a windfall share of any increase in the central government’s oil and gas revenues, which may leave them with excess liquidity. If most or all of the additional transfers to local ernments in oil-producing areas could be borrowed back by the central gov-ernment, this would suffi ce to cover a signifi cant proportion of the estimated
increase in the defi cit caused by an oil price increase to, say, $100 per barrel (see
table 4 in box 1).
BOX 1 MISSINGTHE BIG PICTURE: OIL PRICESAND ENERGY SUBSIDIES
To focus on the implications for the defi cit of potentially higher oil prices is almost
completely to ignore a key feature of the 2008 budget: the damage that is being done by holding domestic fuel and electricity prices constant regardless of huge increases in world energy prices. Indonesia’s oil and gas reserves are assets in the ground that have the potential to be transformed into valuable assets of lasting benefi t to current and
fu-ture generations—such as schools, hospitals, other infrastrucfu-ture and human capital.a
Instead, in the absence of policy adjustments, they are to continue to be plundered to
fi nance current consumption—with considerably larger benefi ts to the more wealthy
members of the community, whose direct and indirect consumption of energy is greater than that of the poor. It is diffi cult to judge why the parliament would accept—or,
in-deed, favour—the patently unrealistic oil price assumption in the budget. Clearly it has an important role to play in negotiating the details of the budget with the government of the day, but items that involve assumptions about the state of the world in the fi scal year
in question should not be matters for bargaining, since they do not involve questions of government policy. Requiring, or allowing, the government to assume an oil price of $60 will not make it so in reality; requiring it to make a more realistic assumption would force it to bring into the open the implication of its current policy of holding domestic energy prices constant. If the average oil price in 2008 is indeed close to $100 per barrel, the total cost of the implied subsidy is likely to be in the order of $26 billion (table 4). For its part, the government’s commitment to the ideals of democracy, one of which is a high level of transparency about its deployment of funds belonging to society, can hardly be said to be strong if it is prepared to sign off on a budget that deliberately under-estimates by perhaps $18 billion the cost of its policy of holding domestic energy prices constant.
a According to the Ministry of Finance (2007), combined spending by the ministries of education
and health accounts for 8.0% of the 2008 draft budget—less than the greatly under-estimated 8.9%
fi gure for energy subsidies based on the assumption of an oil price of $60 per barrel. (This sectoral
breakdown is not available for the agreed 2008 budget.)
BIESApr08.indb 16
BIESApr08.indb 16 29/2/08 9:49:12 PM29/2/08 9:49:12 PM
Miscellaneous measures
• Use of contingency funds in the budget
The purpose of having a contingency fund is to provide a cushion against unexpected and unfavourable future events. An average oil price much higher than $60 per barrel in 2008 can hardly be described as unexpected; in any case, using these funds would simply mean removing that cushion.
• Counter-cyclical fi scal policy measures
Counter-cyclical fi scal policy is running a defi cit in order to increase aggregate
demand and thus stimulate economic activity (or running a surplus in order to dampen it). Indeed, defi cits in the various budgets and revised budgets in recent
years have been increasing, precisely with this in mind.5 Here, the ministry is
argu-ing in favour of stimulatargu-ing aggregate demand by offerargu-ing income tax ‘facilities’ to encourage both investment and the listing of fi rms on the stock exchange, as well
as a number of customs duty incentives. Such measures obviously tend to increase
5 Having said that, this strategy has been somewhat counter-acted by the ‘under- spending’ problem discussed below.
BOX 1 (CONTINUED) MISSINGTHE BIG PICTURE: OIL PRICESAND ENERGY SUBSIDIES
TABLE 4 Estimated Impact of $100 per Barrel Oil on the Budget
Agreed 2008 Budget Add New Totals Rp trillion $ billiona $ billion $ billion
Oil & gas revenues 159.6 17.5 13.7b 31.2
Income tax, oil & gas 41.6 4.6
Natural resources revenues, oil & gas 117.9 13.0
Oil & gas expenditures & transfers 100.4 11.0 19.7b 30.7
Energy subsidies 75.6 8.3 17.6c 25.9
Fuel 45.8 5.0
Electricity 29.8 3.3
Oil & gas transfers to regional governments 24.8 2.7 2.1d 4.8
Income tax, oil & gas 1.2 0.1
Natural resources revenues
Oil 12.9 1.4
Natural gas 10.8 1.2
Defi cit –73.3 –8.1 –6.0b –14.1
a Rupiah values are converted to dollar values at the exchange rate of Rp 9,100/$ assumed in the budget.
b The additions to the approved budget are from a presentation by the Minister for Trade (Pangestu 2008), based on an analysis by the Ministry of Finance, for an assumed oil price of $100/barrel. c The additional value of energy subsidies is estimated as the addition to oil and gas expenditures and transfers less estimated additional oil and gas transfers to regional governments.
d The additional oil and gas transfers to regional governments are assumed to be proportional to the increase in the central government’s oil and gas revenue (78.1%).
Ross H. McLeod
BIESApr08.indb 17
BIESApr08.indb 17 29/2/08 9:49:12 PM29/2/08 9:49:12 PM
rather than decrease the defi cit, so it is hard to understand why they have been
dis-cussed in the context of the need to deal with an expected blow-out in the defi cit.
In summary, the oil price is likely to be much higher than assumed, and this will signifi cantly increase the budget defi cit in the absence of adjustments to other
expenditure and revenue items. None of the anticipative policy measures pro-posed seems likely to be able to achieve much in this regard, but the existence of ‘fat’ in the budget and the inability of the government to spend as much as it budgets for makes the problem less serious. In any case, it would not be diffi cult
to borrow by issuing additional government bonds to fi nance a larger defi cit. For
a discussion of the likely impact of higher oil prices on the magnitude of subsidies to energy consumption, see box 1.
In mid-February the government indicated that it would soon propose a further revision to its 2008 budget in order to refl ect the impact on the growth rate of the
probable slow-down in the world economy, and the likelihood of a much higher oil price. The growth assumption was likely to be brought down to 6.4%, and the oil price assumption increased to $83 per barrel (Nurhayati and Suharmoko 2008). At the same time, the assumed infl ation rate would be increased to 6.5%. Whether
a change in the oil price assumption will be accompanied by any change in energy subsidy policies remains unclear. Reducing fuel and electricity subsidies is a com-plex issue, of course, and fraught with political risk to the incumbent government. But we would argue that governments should always focus on the effi ciency of
budget spending allocations in promoting superior economic outcomes, rather than responding to populist or other pressures. It is important to avoid any nega-tive relationship between government spending and economic growth, as was evident in the pre-crisis period (Ramayandi 2003). Improved effi ciency in
allocat-ing budget spendallocat-ing to infrastructure and other capital goods, in particular, has to remain the core focus of the budget process.
Under-spending on infrastructure
That there was a signifi cant reduction in spending on infrastructure in the aftermath
of the 1990s crisis is readily explained by the fact that the government had injected a huge volume of its own bonds as new equity into the many banks that had failed. Interest payments on these bonds immediately began to consume a large propor-tion of available revenues, which in any case were depressed as a consequence of the deep recession that followed the crisis. More recently, however, the government has turned its back on the opportunity presented by signifi cant increases in the
world oil price to remedy this short-term forced neglect of infrastructure; it has cho-sen instead to bend to populist pressure to keep domestic fuel and electricity prices low through heavy subsidisation. But even infrastructure spending for which fund-ing is available in the budget has been hampered by administrative shortcomfund-ings, especially at local government level. And in other infrastructure projects where the government has tried to encourage private sector participation, this has been held back by similar administrative and other institutional failings, and by the apparent inability of the bureaucracy to formulate arrangements that would provide poten-tial investors with an attractive rate of return relative to the risks involved.
Infrastructure inadequacies constitute an important part of the poor investment climate overall, and impose a constraint on economic development (Lindblad and Thee 2007: 25; Narjoko and Jotzo 2007: 159). Less than two-thirds of Indonesians
BIESApr08.indb 18
BIESApr08.indb 18 29/2/08 9:49:12 PM29/2/08 9:49:12 PM
have access to electricity, and blackouts are frequent (JP, 11/2/2008). More than 100 million people lack access to safe drinking water, and contaminated water is the major cause of illness (USAID 2006). In 2004 only 58% of Indonesia’s 340,000 kilometres of roads were paved, and only around half were in good condition. Traffi c congestion continues to hamper the effi cient operation of large cities like
Jakarta, Bandung, Medan and Surabaya, and satellite towns like Bogor, Bekasi and Tangerang (World Bank 2008). City-wide fl ooding in Jakarta in early
Febru-ary claimed three lives and forced thousands to leave their homes (Antara News, 2/2/2008). The impact of torrential rain and high tides was compounded by ram-pant over-development and deforestation in the hinterland south of the city, and by rivers and drainage canals being clogged with garbage.
Current infrastructure defi ciencies can be attributed to three general factors:
inadequate budget allocations to infrastructure; under-spending of these alloca-tions; and a lack of coordination between jurisdictions. In relation to the fi rst factor,
recent overall budget allocations for infrastructure spending, at around 3% of GDP, have been far lower than the pre-crisis levels of approximately 5% (World Bank 2004: 11). If existing infrastructure assets are to be adequately maintained and their capacity increased, the fi nancing needs are substantial. For example, according
to World Bank (2004) estimates, annual investments of $2–3 billion are needed to meet even modest growth in electricity demand through to 2010; the roads sector could easily absorb $700–750 million more per year for maintenance, betterment and expansion; and $600 million per year is considered a conservative estimate of the spending needed to meet the United Nations Millennium Development Goals in relation to drinking water and sanitation. Raising Indonesia’s relatively low tele-communications density by one percentage point costs about $300 million.6
When the present government fi rst came to offi ce it had great hopes for
over-coming its lack of revenue to devote to new investment in infrastructure by encour-aging the involvement of the private sector through public–private partnerships (PPPs) (McLeod 2005: 144–6). However, the implementation of this strategy has been disappointingly slow. One of the reasons for this has been the administra-tive and political diffi culties involved in land acquisition. McLeod (2005: 146–7)
described a new regulation that had been introduced precisely to facilitate the resumption of private land for purposes such as the construction of public infra-structure. As is so often the case, however, the enactment of the new measure has not been suffi cient, on its own, to overcome the problem in question. Thus, for
example, the opening of the Cikunir toll road (part of the Jakarta Outer Ring Road) in September 2007 had been delayed for two years owing to land disputes with locals (Wongso 2008), despite the fact that the regulation clearly allows the gov-ernment to resume land for such purposes upon payment of fair compensation to its previous owners. More generally, problems with land acquisition are seriously jeopardising the construction of major toll roads. By November 2007, only 250 of the 12,000 hectares needed to construct the 40 toll roads currently planned had been acquired, and land acquisition had yet to be completed for a single toll road some three years after the 2005 infrastructure summit (Wongso 2008).
6 The lack of investment in fi xed-line capacity by PT Telkom, the state-owned
telecommu-nications company, is being offset by tremendous growth in mobile telecommutelecommu-nications, where there is a strong private sector presence.
BIESApr08.indb 19
BIESApr08.indb 19 29/2/08 9:49:13 PM29/2/08 9:49:13 PM
Aside from the problem of delay, the evident ability of owners to hold out for a higher level of compensation for resumption of their land creates an impor-tant risk for potential private sector investors. The government has responded by guaranteeing to cap the land acquisition cost to be borne by private investors at 110% of the estimated cost (Wongso 2008); that is, the government guarantees to pay the difference between the actual cost and 110% of the estimated cost.
The second factor contributing to infrastructure defi ciencies is limited
capac-ity at sub-national level to spend all the funds allocated to infrastructure. Since 2001, responsibility for the provision of infrastructure and public goods has been devolved in large part from the central government to local governments, but the latter still lack the technical capabilities to use the funds transferred to them for planning and implementing infrastructure projects. To some extent, they also have yet to embrace their new responsibilities as service providers. A consequence of this is that a signifi cant proportion of funds received from the central government
that could be used for infrastructure development have simply been deposited with the banking system, often to be invested by the banks in Bank Indonesia Certifi cates (SBIs), where they earn quite an attractive return. During the three
years to November 2007, sub-national governments’ bank deposits grew rapidly, from Rp 59 trillion to Rp 141 trillion (CEIC Asia Database); the latter amount is equivalent to over half of the total budgeted transfers from the central govern-ment to sub-national governgovern-ments in 2007 (table 3). It is clear that the collective capacity or desire of sub-national governments to spend is signifi cantly lower
than the funds available to them.
A third problem with certain types of infrastructure arises from the need for coordination between levels of government, and between different governments at the same level. For example, national highways are the responsibility of the central government, but they cross through provinces and districts, thus requir-ing coordination between these three levels of government. Even more diffi
-cult is the case of infrastructure related to water—irrigation, fl ood control, and
drinking water supply—all of which are very likely to involve the fl ow of water
across administrative borders. Despite the obvious need for it, examples of government cooperation in relation to infrastructure projects of this kind are few, and there seems to be a lack of commitment to promoting such cooperation and coordination. Much more thought will need to be given to creating appropriate incentives for cooperation than has hitherto been the case. For example, cities such as Jakarta and Bandung rely on adjacent jurisdictions for their water sup-plies, and are heavily affected by fl ooding after rain falls in adjacent jurisdictions,
but the latter have little or no incentive to supply water or to control rainfall run-off to the big cities downstream from them.
Financial markets and monetary policy The stock market and the foreign exchange market
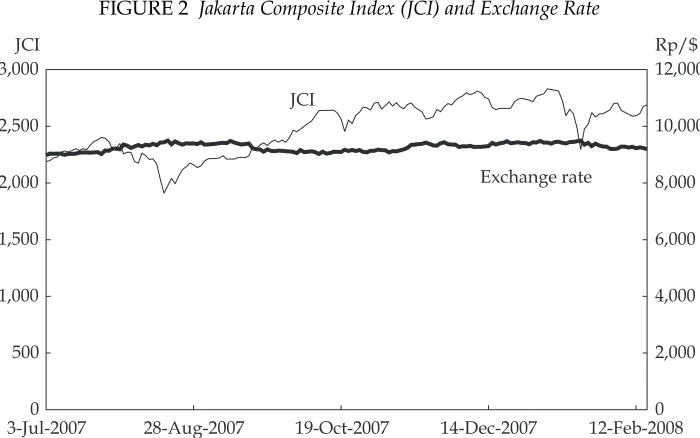
After a short-lived setback in August related to the emergence of the sub-prime crisis in the US, the Indonesia Stock Exchange performed very well for the remain-der of 2007 (fi gure 2).7 The Jakarta Composite Index (JCI) rose by 43% from its low
7 The Jakarta and Surabaya stock exchanges merged to become the Indonesia Stock Ex-change (IDX), effective from 30 November 2007.
BIESApr08.indb 20
BIESApr08.indb 20 29/2/08 9:49:13 PM29/2/08 9:49:13 PM
point in mid-August through to the end of the year, indicating considerable
con-fi dence in the Indonesian economy, particularly on the part of foreign investors:
indeed, monthly net share purchases by foreigners were positive throughout the year. However, the Indonesian capital market appears still to be vulnerable to con-tinuing volatility in the world fi nancial market as a result of the sub-prime crisis.
The index suddenly fell by some 19% in the middle of January 2008, although a large part of this loss was quickly recovered. In such circumstances, it is very much open to doubt whether the IDX can continue to perform as well as it did in 2007. Of course, Indonesia is not alone in this respect.
The rupiah exchange rate was relatively stable during the several months through January 2008 (fi gure 2). While this tends to be interpreted positively,
many other currencies have been appreciating against the US dollar during the second half of 2007. The weakness of the dollar is a refl ection of both the
sub-prime crisis and the dramatic loosening of US monetary policy in response to it. Figure 3 compares exchange rate trends among fi ve ASEAN economies
(Indo-nesia, Singapore, Malaysia, Thailand and the Philippines), and shows that the rupiah, alone among the currencies of this group, failed to appreciate against the US dollar during the second half.
At fi rst glance, this anomalous behaviour of the rupiah exchange rate seems to
suggest that the central bank (Bank Indonesia, BI) has been intervening heavily in the market by purchasing dollars in order to keep the rupiah from appreciat-ing like these other currencies—an argument that is bolstered by the observation that BI’s foreign reserves jumped by about $6 billion in the second half of 2007, to $57 billion. According to market participants and BI offi cials, however, BI did
not engage in large-scale purchases during this period; indeed, BI argues that it has been consistently committed to allowing the rupiah to fl oat by avoiding such
market intervention.
FIGURE 2 Jakarta Composite Index (JCI) and Exchange Rate
3-Jul-2007 28-Aug-2007 19-Oct-2007 14-Dec-2007 12-Feb-2008 0
500 1,000 1,500 2,000 2,500 3,000
0 2,000 4,000 6,000 8,000 10,000 12,000
JCI
Exchange rate
JCI Rp/$
Source: Indonesia Stock Exchange (IDX); Pacifi c Exchange Rate Service.
BIESApr08.indb 21
BIESApr08.indb 21 29/2/08 9:49:13 PM29/2/08 9:49:13 PM
The explanation for the paradox of rapid increases in reserves in the absence of open market purchases of foreign exchange appears to be that there is a large infl ow of oil export dollars to the government’s deposit account at BI. These
dol-lars are immediately converted to rupiah in the government’s account, presum-ably at the current market exchange rate. By contrast with the case in which BI acquires dollars by purchasing them on the open market, there is no impact on the supply of base money, since base money does not include government deposits at the central bank. This means that there is no need for sterilisation—that is, no need for BI to issue SBIs to offset the monetary impact—which explains why the volume of SBIs outstanding remained virtually unchanged during this period.
One implication of these off-market purchases of foreign exchange from the gov-ernment is that they send false signals to market participants. If instead the govern-ment were to sell its foreign exchange earnings on the market and deposit the rupiah proceeds in its account with BI, either this additional large supply of dollars would tend to cause the rupiah to appreciate, or BI would need to intervene to purchase this additional supply if it wanted to prevent such appreciation. In other words, the exchange rate observed in the market is artifi cially high as a consequence of the
hid-den sale of foreign exchange by the government to the central bank.
Infl ation and monetary policy
At 6.6%, consumer price index (CPI) infl ation for 2007 fell within BI’s target range
of 6 ± 1%, although the 5.8% rate achieved mid-year was not able to be sustained (fi gure 4). The trend was upward during the second half, and the year-on-year
rate recorded in January 2008 reached 7.4%. This modest resurgence suggests that BI may have been too eager to ease monetary policy (that is, to reduce interest rates) during 2007. Further reductions were put on hold in January, which was
FIGURE 3 Dollar Exchange Rate Indicesa (June 2007 = 100)
Jun–0750 Jul–07 Aug–07 Sep–07 Oct–07 Nov–07 Dec–07 Jan–08 60
70 80 90 100 110
IDR
MYR
PHP
SGD
THB
a IDR = Indonesian rupiah; MYR = Malaysian ringgit; PHP = Philippines peso; SGD = Singapore
dol-lar; THB = Thai baht.
Source: CEIC Asia Database.
BIESApr08.indb 22
BIESApr08.indb 22 29/2/08 9:49:14 PM29/2/08 9:49:14 PM
unsurprising given the central bank’s decision to lower its infl ation target range
to 5 ± 1% in 2008.
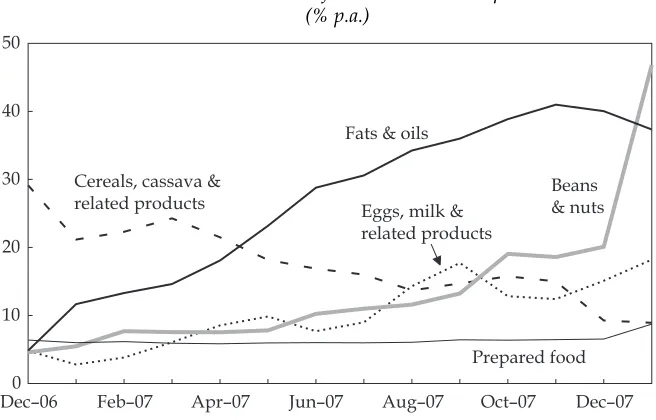
When the CPI is disaggregated into its various components it can be seen that food prices have been growing much faster than the index as a whole, while administered prices under the control of the government have been growing much more slowly (fi gure 4). Price movements within the food component of
the CPI are by no means uniform, however (fi gure 5). Prepared food prices have
FIGURE 4 Infl ation and the Monetary Policy Interest Rate (% p.a.)
Dec–06 Feb–07 Apr–07 Jun–07 Aug–07 Oct–07 Dec–07
0 2 4 6 8 10 12 14
Food prices
SBI rate (30 days)
CPI
Administered prices
Source: CEIC Asia Database.
FIGURE 5 Food Price Infl ation: Selected Components (% p.a.)
Dec–060 Feb–07 Apr–07 Jun–07 Aug–07 Oct–07 Dec–07
10 20 30 40 50
Fats & oils
Cereals, cassava & related products
Prepared food Beans & nuts Eggs, milk &
related products
Source: CEIC Asia Database.
BIESApr08.indb 23
BIESApr08.indb 23 29/2/08 9:49:14 PM29/2/08 9:49:14 PM
been growing at about the same rate as the CPI itself, while, at the other extreme, infl ation of the fats and oils sub-component accelerated steadily and rapidly to
reach almost 40% p.a. by the end of 2007. The beans and nuts sub-component also accelerated, albeit much less steeply (except in January 2008). Infl ation of
cereals prices, by contrast, moved in the other direction, falling from about 30% at the end of 2006 to just 9% a year later, presumably as a result of the easing of import restrictions on rice. The recent rapid increases in the price of palm oil and soybeans are not specifi c to Indonesia, but appear to be related to global
develop-ments in the markets for these commodities resulting from the growing emphasis on the production of bio-fuels. The impact of policies pushing in this direction on world food prices, and the consequences for poverty world-wide, have surely been greatly under-estimated by those who have advocated the policies.
These external developments affecting food prices, as well as the rising trend of oil prices, may make it diffi cult for BI to keep infl ation within its new, lower
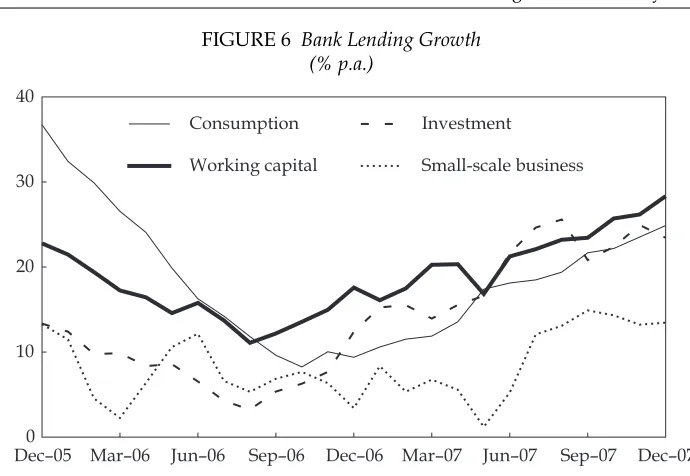
target range in 2008 without having to resort to some tightening of monetary pol-icy. The government’s announcement that it is intending to reduce the interest rate assumed in the 2008 budget is therefore rather surprising. The explanation may be a fear that any reversal of the downward trend in interest rates may slow the currently rapid and accelerating growth of bank lending for working capital, investment and consumption purposes (and, to a lesser extent, for fi nancing small
business activity) (fi gure 6).
The potential threat to infl ation described above is primarily from external price
movements,8 and with this thought in mind it is pertinent to ask what purpose is
served by BI’s strategy of continuing to increase its already large foreign reserves,
8 Not all fuel prices are still subsidised, so rising oil prices will have an indirect impact on infl ation through increases in the production and transport costs of domestic industries.
FIGURE 6 Bank Lending Growth (% p.a.)
Dec–05 Mar–06 Jun–06 Sep–06 Dec–06 Mar–07 Jun–07 Sep–07 Dec–07 0
10 20 30 40
Small-scale business Investment
Working capital Consumption
Source: CEIC Asia Database.
BIESApr08.indb 24
BIESApr08.indb 24 29/2/08 9:49:14 PM29/2/08 9:49:14 PM
thus preventing the rupiah from appreciating. Selling off some of these reserves would tend to reduce the domestic price of tradables—including food imports— with a benefi cial impact on consumers. It would also reduce the rupiah cost of
foreign debt service for both the private sector and the government. It would be necessary to sterilise the contractionary monetary impact of such sales, which could be achieved, for example, by reducing the amount of SBIs outstanding; this would have the further benefi cial effect of lowering interest rates generally. In short,
aban-doning the policy of building up international reserves rather than allowing the rupiah to appreciate would help lower the pressure from imported infl ation, at the
same time providing scope for some reduction in domestic interest rates.9
Monetary policy operations
At the annual bankers’ meeting on 18 January 2008, the governor of BI foreshad-owed refi nements to the way in which the central bank conducts its infl ation
tar-geting monetary policy (Abdullah 2008). Such refi nements were necessary, he
argued, because under the current arrangements inter-bank money market interest rates were too volatile, and the short-term yield curve too steep. These ‘distortions’ were alleged to reduce the effectiveness of monetary policy, and simultaneously to prevent the fi nancial markets from playing a bigger role in the economy. In the
future, BI would be attempting to stabilise inter-bank rates and generate a ‘more reasonable’ short-term yield curve by engaging in fi ne-tuning operations, based
on sale and repurchase transactions (‘repos’) in SBIs and government bonds, and on foreign exchange swap transactions. We expect the change in operational policy to enhance the central bank’s capability to send more precise policy signals to the market, hence refi ning the formation of market expectations.
GOVERNANCE ISSUES
Far-reaching governance problems, particularly in terms of regulatory quality and the control of corruption, constitute a long-term obstacle to Indonesia’s eco-nomic progress. Here we discuss three national-level examples that have attracted attention in recent months: an important fi nding of anti-competitive behaviour by
the Business Competition Supervisory Commission; changes to the membership of the Anti-Corruption Commission; and allegations of misuse of central bank funds, including for the purpose of bribing members of the parliament (DPR).
The Business Competition Supervisory Commission
In November 2007 the Business Competition Supervisory Commission (KPPU) brought down a much anticipated and highly controversial decision in relation to competition in the mobile (cell) phone market (KPPU 2007). This sector’s extremely rapid growth in the last few years refl ects the strong and rising demand for mobile
phone services and the correspondingly high level of current and prospective prof-its. There were two main aspects to the commission’s investigation of alleged vio-lations of Law 5/1999 (on Prohibition of Monopolistic Practices and Unhealthy Competition), the fi rst relating to prohibited activities, and the second to share
9 Yet as recently as December, the central bank suggested that its reserves could rise to $72.9 billion in 2008 (Dow Jones International News, 7/12/2007).
BIESApr08.indb 25
BIESApr08.indb 25 29/2/08 9:49:15 PM29/2/08 9:49:15 PM
ownership of companies operating in this market. The commission found that the dominant company in the market, PT Telkomsel, had abused its position of domi-nance by engaging in the ‘monopolistic practice’ of setting its tariffs too high, and that Temasek Holdings, the investment arm of the Singapore government, had violated the law by controlling a market share in excess of 50%. PT Telkomsel was
fi ned Rp 25 billion (somewhat less than $3 million), and was required to reduce its
current tariffs by at least 15%. Temasek was required to divest its entire sharehold-ing in either Telkomsel or PT Indosat, the second-biggest company in the market, within two years from the time the decision was upheld by the courts (assum-ing the decision was indeed upheld). Purchases of the shares thus divested were required to be limited to parcels of no more than 5% of the total shares divested, and the buyers of such parcels were not to have any association with Temasek or with each other. Temasek and eight related companies were each fi ned Rp 25
bil-lion—an aggregate amount of about $25 million.
The decision forcing Telkomsel to reduce its tariffs may be of little economic consequence, since tariffs have been declining in any case, and the company can probably re-package its products to some extent in order to reduce the impact on its profi ts. But the decision refl ects little understanding of the important role of
prices and profi ts in the economy. It is precisely the existence of super-normal (as
distinct from ‘excessive’) profi ts that rapidly draws resources into the production
of goods and services for which there is an unsatisfi ed demand. The currently
high profi tability of the mobile phone industry is the consequence of its
provid-ing a service that is very attractive to the Indonesian public.10 One impact of a
forced reduction in Telkomsel’s tariffs will be to reduce the amount of profi t
avail-able for reinvestment. A second impact, ironically, will be to weaken the ability of small fi rms to compete by offering their services to customers at a substantial
discount. In both cases the effect will be to slow the expansion of industry out-put, for which there is still a large unmet demand. There are at least fi ve
com-petitors for Telkomsel in the market, but the commission appears to have ignored the fact that there is no obstacle to these competitors offering more attractive tar-iffs. The strongest protection against high prices is precisely the ability of other
fi rms to undercut them, notwithstanding the good intentions behind Law 5/1999.
Telkomsel is certainly much larger than these other fi rms, but it still accounts for
only about 56% of total mobile phone subscribers. Evidence to support the asser-tion that it has a ‘dominant’ posiasser-tion appears weak.
By contrast, the decision in relation to Temasek appears, quite simply, to be inconsistent with the law. Article 27a of the law, which Temasek was found to have breached, reads as follows (translation by the authors):
Business entities are prohibited from owning a majority shareholding [emphasis added] in multiple enterprises that are of the same kind, and that carry out business activities in the same market ... if such ownership results in:
a. a business entity or a group of business entities controlling a market share of more than 50% for a specifi c good or service.
10 PT Excelcomindo Pratama, the third-largest provider of mobile phone services, announced a 62% increase in the number of its subscribers in 2007, to 15.5 million (JP, 22/2/2008).
BIESApr08.indb 26
BIESApr08.indb 26 29/2/08 9:49:15 PM29/2/08 9:49:15 PM
Temasek has indirect shareholdings (through eight related subsidiary compa-nies) in Indosat and Telkomsel, two enterprises of the same kind that operate in the same market, and that jointly account for about 90% of that market. However, Temasek and its subsidiaries do not have a majority shareholding: as the commis-sion itself points out, Temasek is the indirect owner of about 41% of Indosat and 35% of Telkomsel. The commission appears to have confused a greater than 50% market share with a greater than 50% shareholding.11
Even if Temasek were in breach of article 27a, the penalties determined by the commission appear to be beyond the scope of those provided for in the law, which are set out in articles 47 and 48. Neither article suggests that sharehold-ers can be forced by the commission to divest themselves of shares. Moreover, in requiring that individual purchasers of the divested shares not acquire more than 5% of divested shares in the company concerned, the commission is (per-haps unwittingly) imposing its own view as to the desirable ownership structure of that company: specifi cally, that there should be at least 20 new shareholders
in place of the relevant Temasek subsidiaries. This view has no basis whatsoever in the law, which is concerned only with shareholdings of over 50% (and then only if such majority shareholdings lead to the owner controlling a market share of more than 50%).
Nor does this view support the interests of consumers. If the Temasek stake in Telkomsel were to be divested, for example, the fi rm would then be 65% owned by
the state-owned PT Telkom (currently the only other shareholder), with at least 20 other shareholders owning no more than 1.75% each. Telkom would become the controlling shareholder, and presumably Telkomsel’s performance would soon become similar to the dismal performance of its parent—which, over a period of many decades, has managed to extend its fi xed telephone line network to only
about 9 million subscribers in a country with a population of over 220 million.12
One of the main explanations for the explosive growth of the mobile phone com-panies is precisely the failure of Telkom to satisfy the needs of consumers.
These observations lend support to the remarks of one critical Jakarta observer, who refers to ‘the many questionable or even absurd rulings of the [commis-sion]’, asserting that ‘many of the KPPU’s previous decisions in high-profi le
cases ... have been overturned by appellate courts’ (Lingga 2007). Temasek is indeed appealing the decision through the courts. Despite the fact that it would appear to have very strong grounds for appeal, past experience (with the Manu-life and Newmont Mining cases, for example: JP, 20/1/2002; Reuters News 2007) suggests that the outcome is by no means clear. One problem is that no court is specifi cally assigned to handle anti-competition cases, suggesting a likely serious
lack of the expertise needed to deal with such a complex case as this. Another problem is the well-known existence of systemic corruption in the courts and the legal bureaucracy.
The KPPU’s decision in the Temasek case has been heavily criticised by those who see it as damaging the investment climate—specifi cally in relation to foreign
11 This misinterpretation of the law can also be found in numerous newspaper reports about the Temasek case.
12 The number of mobile phone subscribers, by comparison, has grown from zero to well over 60 million in the last decade.
BIESApr08.indb 27
BIESApr08.indb 27 29/2/08 9:49:15 PM29/2/08 9:49:15 PM
investors—but has been strongly supported by those who portray it as a vic-tory in the battle against foreign ownership of strategic assets. Indeed, the case was originally initiated by the Federation of State-Owned Enterprise Employees Unions in the form of a complaint against Temasek, alleging that it over-charged its mobile phone customers and that it held a monopoly in the mobile phone busi-ness in Indonesia (Straits Times, 14/2/2008).13 The anti-foreign investor thrust is
obvious from the fact that the complaint was levelled not against the provider itself but against its (indirect) foreign shareholder. The chairman of the KPPU, M. Iqbal, was reported to have received an award from a group of nationalist poli-ticians, headed by former People’s Consultative Assembly chair and presiden-tial candidate Amien Rais, which had also advocated that the government buy back the shares of Indosat (Osman 2007). On the other hand, a group representing some 100 Indonesian lawyers asserted that the commission’s case was seriously
fl awed, and would ultimately damage the interests of the Indonesian people (JP,
3/12/2007).
Vice President Jusuf Kalla, who earlier argued that the government should buy back the stake it had previously held in Indosat from Temasek’s subsidiary, Sin-gapore Technologies Telemedia (JP, 22/11/2007), has sought to defl ect criticism of
the commission’s decision by asserting that foreign investors had to comply with Indonesian law; the president has reiterated this view. This, of course, is quite beside the point. What matters is whether the commission has properly inter-preted the law—or whether, on the other hand, it has allowed itself to become the instrument of business entities (hiding under the cloak of economic nationalism) that perceive an opportunity to gain a foothold or increase their presence in the industry by virtue of Temasek’s being forced out of one of the two biggest fi rms.
It is a matter for concern that the national leadership has shown so little inter-est in the possibility that the commission’s decision is indeed harmful, not only to consumers but also to the investment climate, and that it has tarnished the commission’s own reputation—and, by association, the credibility of government regulatory bodies in general.
Much that has happened in Indonesia in the post-Soeharto era has been driven by the view that the development of new institutions was one of the keys to suc-cessful democratisation. The KPPU is one such new institution. The present case exemplifi es the fact that most, if not all, public sector institutions, while intended
to further the interests of the general public, may in fact do precisely the opposite, either because they lack the necessary skills and expertise or because they can be captured by vested interests.
Membership changes at the Anti-Corruption Commission
In December 2007, anti-corruption reformers and governance analysts were dis-mayed at the process by which fi ve members were appointed to the
Corrup-tion EradicaCorrup-tion Commission (KPK) for the 2007–11 period. Surprisingly for an agency whose primary function is to enhance the level of trust in all of the public sector institutions, the selection by the DPR’s legal and domestic political affairs commission involved two closed-door voting sessions at the conclusion of a
13 Interestingly, the union withdrew its complaint almost six months later, and yet the KPPU decided to proceed with its investigation.
BIESApr08.indb 28
BIESApr08.indb 28 29/2/08 9:49:15 PM29/2/08 9:49:15 PM