INCOME SMOOTHING PHENOMEN ON IN INDONESIA:
GARBLING VS SIGNALLING
Linda Ariany Mahastanti [email protected]
Satya Wacana Christian University, Salatiga Indonesia
Setha Octatiasari Pratiwi
Satya Wacana Christian University Alumnus, Salatiga Indonesia
Abstract
The purpose of this study is to analyze whether the phenomenon of income smoothing in Indonesia is signalling or garbling. The sample in this study was 10 manufacture companies which released financial statement since 2010-2012 and published bond.
Usi g Tu ker a d )aro i ’s income smoothing statistic, this study discovered companies with high level of income smoothing and companies with low level of income smoothing. Descriptive statistic test with mean, maximum and minimum analysis tools were used in this study to analyze the difference between companies with high yield and companies with low yield and to analyze the difference of company characteristics of companies with signaling income smoothing and companies with garbling income smoothing.
Study results showed that the income smoothing phenomenon in Indonesia is tended to be garbling. It showed that investors in Indonesia were more selective in making investment decision.
Keywords: income smoothing, cost of debt, garbling, signalling, profit
PREFACE
Every company neees funding in building and developing their business activities. Two main sources of funding are the internal and external funding. Funding is derived internally from profits (retained earnings) as a source of financing investment while external funding sources come from outside the company. The two main sources of external funding include investors’ equity (owners or shareholders) and creditors.
The increasing bond issuance occurred in Indonesia will prompt the investors to be more selective in deciding on which companies they will invest to. The decision of investors in determining the company depends on the beliefsto the company's performance presented on the financial reports, especially in the profits. Investors must have confidence wether the company is able to provide benefits and how the company's prospects going forward or not. The importance of profit information for investors is one reason for the company's management to take some disfunctional behavior actions,that is to perform income smoothing practices to resolve conflicts between the management with various stakeholders (interested parties) of the company. Income smoothing practices include efforts to minimize the number of profit reported if actual profit is greater than normal profit, and efforts to increase the number of d profit reported if actual profit are smaller than normal profit (Prasetio, et al, 2002).
Income smoothing is defined as a management tool used to reduce the variability of the target sequencewhich is visible because of the apparent (accounting) or real (transaction) variables manipulation Salno and Baridwan, (2000).The contracting theory argues that income garbling is an equilibrium solution because the principal would otherwise pay a high premium to compensate the agent, who has the information advantage, for taking additional risk (Lambert 1984; Demski and Frimor 1999). In contrast, other studies view income smoothing as a vehicle for managers to reveal their private information about future earnings (Kirschenheiter and Melumad 2002; Sankar and Subramanyam 2001). Such communication could be either active or passive. For example, Kirschenheiter and Melumad (2002) show that reported earnings have dual roles. The level of reported earnings allows investors to infer the level of permanent future cash flows. The fluctuations of reported earnings reduce
i vestors’ co fide ce i the i ferred per a ent component. The dual roles cause managers to smooth earnings
Most studies in Indonesia on income smoothing are associated with several factors that affect the income smoothing practice and income smoothing effect on the stock return. For example, the study conducted by Prabayanti and Yasa (2009) which states that the size of the company, financial leverage, institutional ownership, and the reputation of the auditor do not influence the income smoothing practice. However, these results are not in line with the study conducted by Silviana (2011) which states that the profitability (ROI), Net Profit Margin, Financial Leverage and Debt to Equity are factors that do not affect the income smoothing practice. Windasari (2012) states that only profitability and Debt to Equity Ratio that significantly affect the companies that do and do not perform income smoothing practice and company growth stock returns are the same from time to time.Ronen and Sadan (2005) also tested different smoothing instruments and found significant income smoothing behavior.
manager personal information about the company's future performance. Future Profit earned will be stable each year. Doing so may lead investors tend to be fooled by information from the company's management. So it will a lot of investment for the company and the company's cost of debt is low. Meanwhile, when the income smoothing is garbling, managers and all interested parties of the company's financial reports will not publish any information that is important / valuable. Investors may suspect that the company performs the income smoothing practices. So it will have an impact on low investment number in the company and the cost of company debt is high.
This study is a replication of Li and Richie study (2009), but with a different country case examples, different study problems and purposes. The study conducted by Li and Richie (2009) was a study that analyzed the effect of income smoothing,with the cost of debt. The results of the study showed that income smoothinghad a significant and negative effect on the cost of debt. Phenomenon occured in the country were dominated by signaling income smoothing, investors were likely to be fooled with the financial reports presented by the company management. Based on those results, there is an interesting thing that can be a problem in this study. So, the problem in this study is how is the income smoothing phenomenon in Indonesia, wether it is more likely to garbling income smoothing or signaling income smoothing?
THEORETICAL REVIEW Agency Theory
Agency theory is a theory that describes the approach to the concept of profit management which is strongly associated with income smoothing. Profit management is one of the factors that can reduce the credibility of financial reports. There are differences in the information or the existence of information asymmetry between the manager that as the agent and the company owner as the principal, where the manager as the company's internal party knows better than the company owner (external parties), so this gap is utilized by the manager to perform disfunctional behavior, by doing profit manipulation (earning management) Eisenhardt (1989) Signaling Theory
Information asymmetry can also be the basis of the establishment of signaling theory. Signalling theory is a step-by-step management of the company that actually provides implicit guidance to investors about how the management looks at the company's prospects (Steven and Lina, 2011). In general, investors tend to believe the financial reports presented by the company, without finding out whether the company doesthe dysfunctional behavior or not. Thus, it can encourage more and more investments received by the company which performs income smoothing.
INCOME SMOOTHING
Management can set the timing of certain events to reduce the differences in reported profit.
Management can allocate certain revenues and expenses in different accounting periods.
Management intheir discretion will classify certain profit items in different categories.
Income smoothing is generally a management understanding of the accounting and management principles to reduce profit variability (Si and Li, 2009). Tucker and Zarowin (2006) estimate the income smoothing as the negative relationship between
cha ges i discretio ar accruals pro (ΔDAP) and change in pre - discretionary profit
(ΔPDI) in the company.Two previous empirical studies are closely related to ours. Using the cross-sectional Jones (1991) model, Subramanyam (1996) finds that returns are positively associated with contemporaneous discretionary accruals, and that discretionary accruals are positively associated with future earnings and operating cash flows, implying that discretionary accruals convey information about
fir s’ future prospects
COST OF DEBT
Cost of debt can be defined as the degree to be received from the investment to achieve a rate of return (yield rate) required by the creditor or the rate of interest to be paid by the company when performing loans (Rebecca and Siregar, 2012). This study used a data sample of bonds, particularly the yield of every company that had been determined. Daily yields data estimation was obtained, using the midpoint of all transactions occurred.
There are three approaches that can be used to obtain the data sample bond according to Bessimber, et al (2008) in the study of Li and Richie (2009), those are the approach represents a bond, an approach based on the bonds level, and the approach based on the company level. Study conducted by Li and Richie (2009) used an approach based on the bonds level and the approach based on the company level. The advantages of the approach based on bondslevel that is this approach observes all bonds issued from any company or not only one chosen bonds. However, there are some disadvantages because of the correlation errors on observations pereformed in each company. This can occur in large companies, because these companies do not issue a bond only, otherwise they may issue some bonds. While the approach based on the company level will use market data from the yield average in every day.
GARBLING VS. SIGNALLING
about the company performance. Investors are not interested in fluctuative companyprofit. More and more smooth or stable theprofit from year to year, indicates that the company has a better performance. Increased activity of the company makes the investors increasingly put high expectations of the company. The results of the study conducted by Li and Richie (2009) showed a negative direction, revealed that there were many investors who just belive the financial report information provided by the management company without finding out wether the information is in accordance with the company's actual performance or not. It can encourage companies to increase the selling prices of the bonds issued. The high selling price set by the company or called a premium price, can cause the coupon rate (State Rate) higher than the yield (Market Rate).
While the positive direction indicates garbling income smoothing, The higher income smoothing the higher costof debt. Investors know that information received is garbling, so it is not impossible that investors may not be interested in a wide range of investments offered, as investors feel fooled with the information provided.
RESEARCH METHODS Population And Sample
The population in this study are manufacturing companies listed on the Stock Exchange in 2010-2012. Samples were selected by purposive sampling method. There are 10 samples from the study observations in 2010-2012 and had been grouped into two categories according to the model of Jones (1991) which had been modified by Kothari, Leone and Wasley (2005). Those were, companies with high level of income smoothing (code 1) and companies with low level of income smoothing or no income smoothing practice (code 0).
Income smoothing with Pre-discretio ar profit value (ΔPDI) was negative, indicating a high degree of income smoothing of the company. These companies performed income smoothing for 2 years in a row. While income smoothing with Pre -
discretio ar profit value (ΔPDI) was positive, indicating a low level of income smoothing. The company only performed income smoothing in certain years, or did not do any income smoothing at all.
RESEARCH MODEL
Income smoothing in this study was measured by estimating discretionary accruals, using Zarowin Tucker statistics (2005) by using the cross-sectional method of Jones (1991), the model has been modified by Kothari, Leone and Wasley (2005).
Total accruals for the period are stated in the equation:
� �� � =�0(1/� �−1) +�1∆ �� �+�3 � +�4 �� +�� (1) � �� = Estimates of total accruals on the company i of net profit
minus operating cash flow
� = Total Assets on� −1
∆ �� = Changes in sales
year of�
� = Net profit during total assets period
From the equation above, Non discretionary accruals( � )can be calculated by inserting the values of the first regression in the equation:
� �,� = � 0(1/� �,�−1) +� 1∆ �� �,�+� 3 �,� +� 4 ��,� (2)
anddiscretionary accruals( � ) are represented by the actual accrual deviations of
the � :
Pre-discretionary profit (∆ �)is a counting result ofnet profitminusdiscretionary accruals, or:
� = � − � (3)
TZ statistic is a correlation between discretionary accruals changes with profit Pre - discretionary changes. The company with negative correlation is a company with higher income smoothing, while the company with positive correlation is a company with lower income smoothing or no ioncome smoothing. Companies with high income smoothing will be coded 1, and companies with low or no income smoothing income smoothing will be coded 0.
The cost of debt can be defined as an acceptable return by investors on investment given. The cost of debt in this study is measured using the average yield of each bond issued by each company. Yield measurements use the current yield.
RESULTS AND DISCUSSION
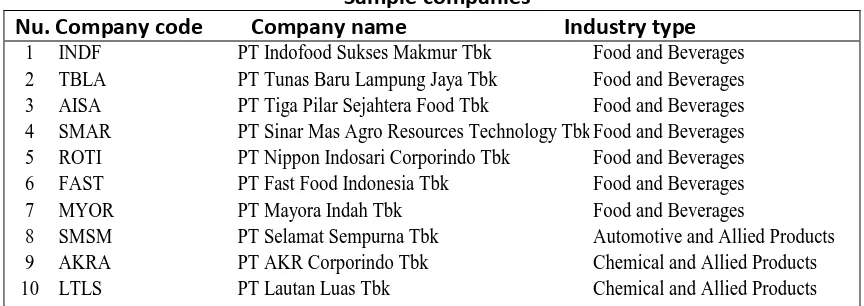
In accordance with Table 3.1, the samples obtained were only 10 companies. Here is the description of the 10sample companies:
Table 2 Sample companies
Nu. Company code Company name Industry type
Source: Indonesian Capital Market Directory
According to Table 4.1 above, the manufacturing companies with industry sector of food and beverages dominated the issuance of bonds compared with other industry sectors. Investors were more interested in the activities of companies in the food and beverages industry, as companies with food and beverages industry were not affected by the economic crisis. Thus, if there is a decrease in the demand for food and drink, it does not significantly affect the company's activities in generating profit ( Devita ,
1 INDF PT Indofood Sukses Makmur Tbk Food and Beverages 2 TBLA PT Tunas Baru Lampung Jaya Tbk Food and Beverages 3 AISA PT Tiga Pilar Sejahtera Food Tbk Food and Beverages 4 SMAR PT Sinar Mas Agro Resources Technology TbkFood and Beverages 5 ROTI PT Nippon Indosari Corporindo Tbk Food and Beverages 6 FAST PT Fast Food Indonesia Tbk Food and Beverages 7 MYOR PT Mayora Indah Tbk Food and Beverages
2012). Stable profit is one factor thataffects the investors in making investment decisions.
The company samples then were grouped into 2: 1) companies with negative Pre - discretio ar profit (ΔPDI), indicating companieswith high level of income smoothing (code 1) and 2) companies with positive value of Pre - discretionary profit
(ΔPDI), indicating the low level of income smoothing (code 0). To find out the results of the 10 sample companies grouping, we may take a look at the table below:
Table 3
Company grouping based on Income smoothing level
Nu. Co pa y code ΔPDI I co e s oothi g ΔPDI I co e s oothi g
Table 4.2 shows that in average, manufacturing companies in Indonesia perform income smoothing. There are 7 manufacturing companies with high level of income smoothing, while the remaining three companies are manufacturing companies with low levels of income smoothing / companies who perform income smoothing practices only in certain years. After analyzing the income smoothing in each company, the next step is to analyze the size of the yield that would be accepted by investors as a reciprocal of their investment in buying bonds. The table below is an
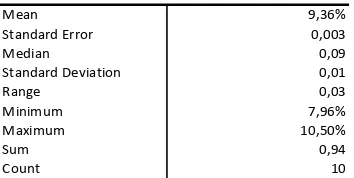
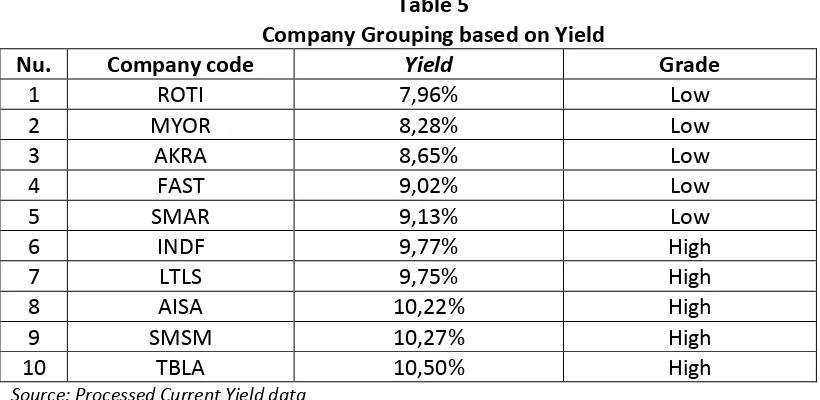
Table 4.3 shows taht 10 sample companieshave the yield average value of 9.36%. With the average value, the samples were grouped into 2 companies at low cost of debt and companies with high cost of debts (Li and Richie, 2009). There are 5 companies with low cost of debts and 5 companies with high cost of debts. Here is a grouping of yield levels of the 10sample companies:
Table 5
Company Grouping based on Yield
Nu. Company code Yield Grade
1 ROTI 7,96% Low
2 MYOR 8,28% Low
3 AKRA 8,65% Low
4 FAST 9,02% Low
5 SMAR 9,13% Low
6 INDF 9,77% High
7 LTLS 9,75% High
8 AISA 10,22% High
9 SMSM 10,27% High
10 TBLA 10,50% High
Source: Processed Current Yield data
Based on Table 4.4 above, PT Nippon Indosari Corporindo, Tbk (ROTI) from food and beverages industry sector was the company with the lowest yield of 7.96%. While PT Tunas Baru Lampung Tbk (TBLA) from the same industry sector, was the company with the highest yield of 10.50 %.
These results indicate that although both companies are in the same industry (food and beverages) which is the most attractive industry for investors, but the yield may be different. In fact the difference is quite big. Such differences may be caused by the high interest of the investors in bonds issued by PT Nippon Indosari Corporindo (ROTI) compared with investors’ interest in PT Tunas Baru Lampung Tbk (TBLA). According to the study conductedby Handayani and Artini (2013), the investment decision made significant negative effect on bond yields. The higher interest of the investor to decide to invest in a company, the lower yield on the company would be.
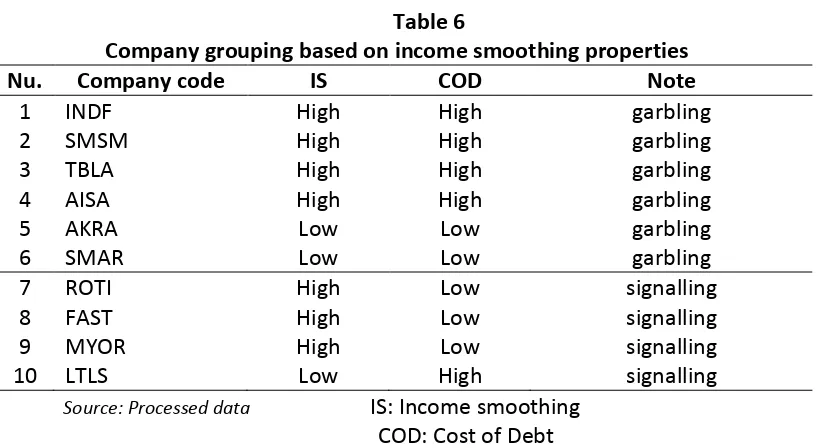
After had been grouped by the yield level, 10 sample companies were regrouped according to the income smoothing properties of their respective companies. The table below shows the income smoothing properties of each company.
Table 6
Company grouping based on income smoothing properties
Nu. Company code IS COD Note
1 INDF High High garbling
2 SMSM High High garbling
3 TBLA High High garbling
4 AISA High High garbling
5 AKRA Low Low garbling
6 SMAR Low Low garbling
7 ROTI High Low signalling
8 FAST High Low signalling
9 MYOR High Low signalling
10 LTLS Low High signalling
Source: Processed data IS: Income smoothing COD: Cost of Debt
In Table 4.5, PT Nippon Indosari Corporindo (ROTI) as the company with the lowest yield was included in the company with signaling income smoothing. Investors were more interested and more confident with the financial reports presented by the company management. While PT Tunas Baru Lampung Tbk (TBLA) with the highest yield, was included in the company with garbling income smoothing. Investors are aware that income smoothing is performed by the company management, so they are not too interested in the bonds issued by the company. To further investigate the differences in company characteristics between the company with signaling income smoothing and the company with garbling income smoothing, we may take a look at the table below:
Table 7
Comparison of the company based on the company characteristics (in millions of rupiahs)
No. Company code
DEBT ROA Rating Note
2012 2011 2010 2012 2011 2010
1 INDF 0,42 0,41 0,47 0,09 0,10 0,10 AA+ Garbling 2 SMSM 0,43 0,35 0,47 0,20 0,21 0,16 AA- Garbling 3 TBLA 0,66 0,62 0,66 0,06 0,12 0,09 A Garbling 4 AISA 0,47 0,49 0,70 0,07 0,08 0,05 A- Garbling 5 AKRA 0,64 0,56 0,62 0,07 0,30 0,05 AA- Garbling 6 SMAR 0,45 0,50 0,52 0,15 0,14 0,12 AA Garbling 7 ROTI 0,16 0,28 0,20 0,20 0,20 0,29 AA- Signalling 8 FAST 0,25 0,46 0,35 0,13 0,19 0,19 AA Signalling 9 MYOR 0,63 0,63 0,54 0,11 0,11 0,15 AA- Signalling 10 LTLS 0,72 0,76 0,72 0,03 0,03 0,04 A- Signalling
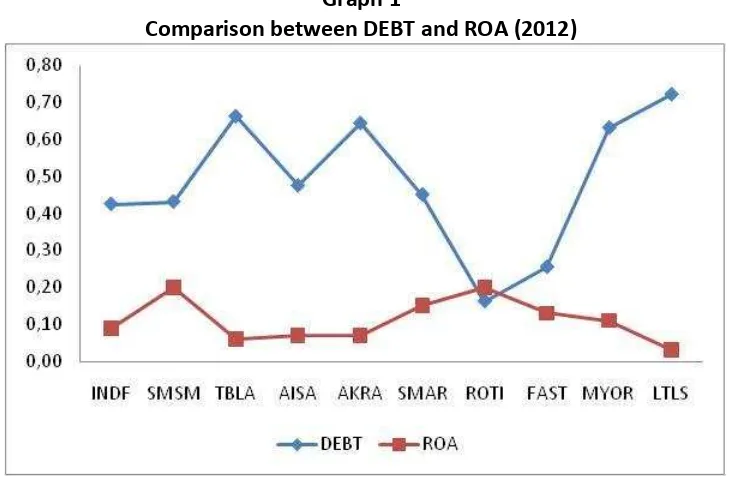
Table 4.6 is a comparison characteristics of the company in 2010-2012. Study by Li and Richie (2009) used the company characteristics to analyze the effect of income smoothing on the cost of debt. Based on the table above, the DEBT average of 10 samplemanufacture companies decreases each year. The decline revealed that the liabilities of the company decrease every year, while the profit generated in each year was fluctuated annually as indicated by an average of ROA in Table 4.6 above. The average bond rating of the sampleswas at the A level, the rating indicated that the ability of each company to pay was pretty good. To simplify in analyzing differences by characteristics, we made a comparison chart as below:
Graph 1
Comparison between DEBT and ROA (2012)
On the other hand, at PT Tunas Baru Lampung Tbk (TBLA), the obligation to be fulfilled by the company was 66%, much higher than the profits of only 6%. According
to www.etraddinggallery.com, a decrease in net profit of PT Tunas Baru Lampung Tbk
(TBLA) was the worst, compared to other companies in the amount of 42.31%. Company with a superior product that is oil "ROSE BRAND" had experienced problems due to commodity weakened prices of crude palm oil (CPO) (www.sawit -
indonesia.com). These constraints make trading activity was interrupted, and create
an impact on the profit generated and encourage the increasing obligations that must be met. PT Tunas Baru Lampung Tbk (TBLA) also performs income smoothing with a fairly high level. However, investor interest in PT Tunas Baru Lampung Tbk (TBLA) was different to PT Nippon Indosari Corporindo Tbk (ROTI). Because of the problems caused by the commodity prices weakening of crude palm oil (CPO), investors did not believe the profits that had been generated by the company. In addition investors had confidence if PT Tunas Baru Lampung Tbk (TBLA) was unable to meet its obligations in providing bond yields. PT Tunas Baru Lampung Tbk (TBLA) had a bond rating, but the rating was lower than the bond rating of PT Nippon Indosari Corporindo Tbk (ROTI). The rating indicated that the company's ability to meet its obligations TBLA was still pretty good.
CONCLUSIONS AND RECOMMENDATIONS Conclusion
Most of the manufacturing companies in Indonesia practice income smoothing successively from year to year, but some are only in the certain years or even no income smoothing practice at all. Based on the comparison between the rate of income smoothing with the cost of debt of the company, income smoothing phenomenon in Indonesia is dominated by garbling income smoothing. This result indicates that investors are cautious enough to make decisions in investment. Investors and company analysts believe will not easily believe with the financial reports presented by the company management.
Characteristics of the company showed the difference between garbling income smoothing and signaling income smoothing. The difference can be seen from the comparison chart between DEBT and ROA of each company in 2012.
Recommendation
REFERENCES
Belkaoui, Ahmed Riahi, 2007, A ou ti g Theory ,Buku Satu dan Dua, Salemba Empat; Jakarta.
Devita, Elisa, 2012, Faktor- Faktor yang mempengaruhi Rasio Profitabilitas pada
Perusahaa Food a d Be erages ya g terdaftar di Bursa Efek I do esia .
Dewi, Ratih Kartika dan Zulaikha. (2011), A alisa Faktor-Faktor yang Mempengaruhi Praktik Perataan Laba (Income Smoothing) pada Perusahaan Manufaktur dan Keuangan yang di BEI (2006-2009 ,Fakultas Ekonomi Universitas
Diponegoro.
4 Emiten Perkebunan Catatkan Laba Turun Pada 2012, http://etradinggallery.com. diunduh pada tanggal 01 Juli 2013.
Eisenhardt, M, K. (1989). Agency theory: An assessment and review. Academy of Management Review, 14(1), 57).
Grant, Julia, Garen Markarian dan Antonio Parbonetti, 2009, CEO Risk-Related
I e ti es a d I o e “ oothi g . http://www.ssrn.com
Handayani, Ida Ayu Made Wiryandari Kusuma dan Luh Gede Sri Artini, 2012,
Pe garuh Faktor Eko o i Makro, Keputusan Investasi dan Keputusan
Pe da aa terhadap Yield O ligasi Korporasi di Bursa Efek I do esia , Fakultas Ekonomi Universitas Udayana.
Hastuti, Sri, 2008, Kualitas Dis losure, Biaya Huta g da Bo d Rati gs , Jurnal Manajemen Gajayana, Volume 5, Nomor 1, 2008, hlm. 61-72.
Jones, J. 1991. Earnings management during import relief investigations. Journal of Accounting Research 29 (2): 193–228.
Kirschenheiter, M., and N. Melumad. 2002. Can Big Bath and earnings smoothing co-exist as equilibriumfinancial reporting strategies? Journal of Accounting Research 40 (3): 761–796
Li, Si dan Nivine Richie, 2009, I o e “ oothi g a d The Cost of De t ,
http://www.ssrn.com.
Markarian, Garen dan Belén Gill-de-Albornoz, 2012, I o e “ oothi g a d
Idiosy rati Volatility , http://www.ssrn.com.
Mursalim, 2005, I o e “ oothi g da Moti asi I estor: “tudi E piris pada
I estor di BEJ , SNA VIII Solo, 15-16 September 2005.
Obligasi, http://www.idx.co.id/. diunduh pada tanggal 10 September 2012.
Penerbitan Obligasi Bakal Ramai, http://koran-jakarta.com. diunduh pada tanggal 06 Juli 2012.
Prabayanti, Ni Luh Putu Arik dan Gerianta Wirawan Yasa, 2009, Perataa La a (Income Smoothing) dan Analisis Faktor-Faktor yang Mempengaruhinya (Studi
pada Perusahaa Ma ufaktur ya g Terdaftar di Bursa Efek I do esia .
Prasetio, J.E., S. Astuti dan A. Wiryawan, 2002, Praktik Perataan Laba Dan Kinerja
“aha Perusahaa Pu lik Di I do esia .
Ronen, J., and Sadan, S. (2005). Classificatory smoothing: alternative income models.
Journal of Accounting Research, 13 (1), 133-149.
tidak Melakukan Perataan Laba pada Perusahaan yang Listing di Bursa Efek
Jakarta , Tesis Pascasarjana Universitas Diponegoro.
Rebecca, Yulisa dan Sylvia Veronica Siregar, 2012, Pe garuh Corporate Governance Index, Kepemilikan Keluarga, dan Kepemilikan Institusional terhadap Biaya Ekuitas dan Biaya Hutang: Studi Empiris pada Perusahaan Manufaktur
ya g Terdaftar di BEI , Universitas Indonesia.
Sankar, M., and K. R. Subramanyam. 2001. Reporting discretion and private information communication through earnings. Journal of Accounting Research 39 (2): 365–386.
Subramanyam, K. R. 1996. The pricing of discretionary accruals. Journal of Accounting and Economics 22: 249–281.
Sari Roti-Produk Roti Kebanggan Negeri, http://www.anneahira.com/sari-roti.htm. diunduh pada tanggal 01 Juli 2013.
Silviana, 2011, A alisis Perataa La a I o e “ oothi g : Faktor-Faktor yang mempengaruhi Perataan Laba pada Perusahaan Manufaktur Sektor Industri
Dasar da Ki ia ya g Terdaftar di Bursa Efek I do esia , Fakultas Ekonomi Universitas Gunadarma.
Skandal Manipulasi Laporan Keuangan PT Kimia Farma Tbk,
www.davidparsaoran.wordpress.com, diunduh pada tanggal 28 Juli 2013.
Surya, Budhi Arta dan Teguh Gunawan Nasher. (2011), A alisis Pe garuh Ti gkat Suku Bunga SBI, Exchange Rate, Ukuran Perusahaan, Debt To Equity Ratio
da Bo d terhadap Yield O ligasi Korporasi di I do esia . Jurnal Manajemen Teknologi, Vol 10 No.2,. pp 50-64
Suwito, Edi dan Arleen Herawaty. (2005), Analisis Pengaruh Karakteristik Perusahaan Terhadap Tindakan Perataan Laba yang Dilakukan oleh Perusahaan yang
Terdaftar di Bursa Efek Jakarta . SNA VIII Solo, 15-16 September 2005. Steven dan Lina. (2011), Faktor-Faktor yang Mempengaruhi Kebijakan Hutang
Perusahaa Ma ufaktur , Jurnal Bisnis dan Akuntansi STIE TRISAKTI, Vol. 13 No. 3, pp. 163-181.
Tucker, X. Jenny dan Paul Zarowin. (2006), Does I o e “ oothi g I pro e Ear i gs
I for ati e ess ? . The Accounting Review Vol. 81 No. 1, pp. 251–270