P
THIS REPORT HAS BEEN PREPARED BY
PT
MAYBANK
KIM
ENG
SECURITIES
SEE PAGE 11 FOR IMPORTANT DISCLOSURES AND ANALYST CERTIFICATIONS
Isnaputra Iskandar, CFA
Tunas Baru Lampung
(TBLA IJ)
Too Sweet to Ignore
Solid 1Q17 just the start; BUY with a higher TP
We maintain BUY and increase our SOTP based TP by 27% to IDR1,900
end-2017, implying a 2017 P/E of 10.5x on the back of higher earnings
forecasts and P/E multiple for the refined sugar business from 8x to 10x.
We believe the higher multiple is justified as the operation of the mill
will increase TBLA’s bargain
ing power with the government. The stock
trades at an undemanding 2017 P/E of 7.4x with 55% EPS growth.
1Q17 NPAT +323% YoY
secured sales in the sugar business, as well as strong demand.
Higher forecasts
Judging from refined sugar sales volume of >60k tonnes in 1Q17 and
import quota of 266k tonnes YTMar-17, our initial 2017 sales assumption
of 200k tonnes look conservative as we are going to see seasonally
stronger demand in 2Q17 and 4Q17. That said, we increase our 2017-18
refined-sugar sales volume assumptions to 225k tonnes (+12.5) and 230k
tonnes (+15%). We also increase our 2017-18 earnings forecasts by 6% and
7%. Our new forecasts suggest 55% and 6% YoY EPS growth.
‘Hidden’ capacity
to fully monetize import quota
The brand new mill plant has been commercially operating since early
April and is ready to process 1.05m tonnes of sugarcane during the
harvesting period. During the non-harvesting period, the mill can also be
used to refine raw sugar with a capacity of around 120-144k tonnes. This
suggests additional capacity by 55-65% to the existing refined capacity of
220k tonnes without incurring additional major capex.
Share Price IDR 1,355
12m Price Target IDR 1,900 (+40%)
Previous Price Target IDR 1,500
BUY
PT Tunas Baru Lampung is an upstream and downstream palm oil player expanding into the sugar business
PT Budi Delta Swakarya PT Sungai Budi
May-15 Aug-15 Nov-15 Feb-16 May-16 Aug-16 Nov-16 Feb-17
Tunas Baru Lampung - (LHS, IDR)
Tunas Baru Lampung / Jakarta Composite Index - (RHS, %)
-1M -3M -12M
Absolute (%) 4 16 124 Relative to index (%) 4 10 90
Source: FactSet
FYE Dec (IDR b) FY15A FY16A FY17E FY18E FY19E
Revenue 5,331 6,514 7,832 8,366 8,642
EBITDA 843 1,409 1,852 1,926 2,023
Core net profit 197 615 953 1,015 1,081
Core EPS (IDR) 37 115 178 190 202
Core EPS growth (%) (54.5) 212.4 54.9 6.5 6.5
Net DPS (IDR) 11 46 71 76 81
Net gearing (%) (incl perps) 142.5 127.8 94.6 74.8 56.8
Consensus net profit - - 896 947 1,003
May 8, 2017
21.
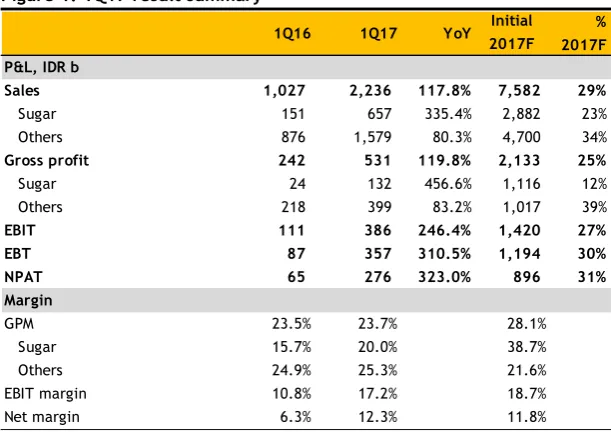
Strong 1Q17 to continue
TBLA posted strong 1Q17 of IDR276b, which was up 323% YoY and
accounted for 31% of our initial 2017 forecast of IDR896. The strong
earnings growth was due to a very strong performance of the
refined-sugar business. On the top line side, refined-sugar revenue made up 23% of our
initial estimates. The surprise came from the top line of the non-sugar
business, which is a palm product that made up 34% of our estimate. This
is because the company is mostly likely selling more cooking oil products
and received higher demand of biodiesel products during 1Q17, in our
view. We will review the 1Q17 results more deeply once the company
releases the quarterly operational data.
Figure 1: 1Q17 result summary
Source: Company, Maybank Kim Eng
We believe the glazing 1Q17 performance is most likely to be continued in
the upcoming quarters. The demand for sugar and palm products is usually
strong during Ramadhan and Eid holiday that lies in 2Q this year. Given
the high demand from Muslim festivities and the sugar deficit position in
Indonesia, we think the Trade Ministry will grant another refined sugar
import quota in the following months. On top of that, the white sugar
retail sales will start to be reflected in 2Q17 TBLA’s book as the mill has
been operating since early April. That said, we expect improving margin
going forward. Seasonally, second quarter (Fig 2) is one of the strongest
quarters, which has contributed 30% of FY earnings on average over the
past three years.
Figure 2
: TBLA’s earnings proportion quarterly
Source: Company, Maybank Kim Eng
1Q16 1Q17 YoY Initial 2017F
% 2017F P&L, IDR b
Sales 1,027 2,236 117.8% 7,582 29%
Sugar 151 657 335.4% 2,882 23% Others 876 1,579 80.3% 4,700 34%
Gross profit 242 531 119.8% 2,133 25%
Sugar 24 132 456.6% 1,116 12% Others 218 399 83.2% 1,017 39%
EBIT 111 386 246.4% 1,420 27% EBT 87 357 310.5% 1,194 30% NPAT 65 276 323.0% 896 31% Margin
GPM 23.5% 23.7% 28.1%
Sugar 15.7% 20.0% 38.7%
Others 24.9% 25.3% 21.6%
EBIT margin 10.8% 17.2% 18.7%
Net margin 6.3% 12.3% 11.8%
30%
42%
11%
28% 18%
32%
40%
30% 26%
2%
26%
18%
25% 23% 24% 24%
May 8, 2017
32.
Higher forecasts
We increased FY17/18/19 our consolidated earnings estimates by 6/7/8%
to IDR953/1,015/1,081b on the back of higher refined sugar volume
assumptions. In addition,
TBLA’s position to secure future
raw sugar
import quota will improve going forward post mill operation. Our other
assumptions for palm and white sugar business are unchanged as we
believe all the catalysts remain intact.
Figure 3: Forecast changes
Source: Maybank Kim Eng
3.
TBLA’s stronger position
in the sugar game
3.1
Glazing sugarcane planted area is ready to be harvested
Referring to our Sept-16 initiation report,
Sweet, Sweet Evolution
TBLA
has been transforming its plantation area in Lampung from palm oil to
sugarcane and targets to manage 15,000 ha of sugar planted area by 2017.
By the end of 2016, TBLA has 10,640 ha of managed sugarcane plated
area, of which c9,000 ha are
currently matured and ready for this year’s
harvesting season, starting in early April to September.
Figure 4
: TBLA’s sugarcane plantation in Lampung (taken in Mar
-17)
Source: Company
We think TBLA will able to produce 1.05 m (Fig 5) tonnes of sugarcane in
2017 (+174% YoY) driven by our conservative sugar planted area
assumptions of 14,000 ha, which is 7% lower than the management target.
2017F 2018F 2019F
Refined sugar sales vol., tonnes
New 225,000 230,000 235,000
Old 200,000 200,000 200,000
Change 12.5% 15.0% 17.5%
Sales, IDR b
New 7,832 8,366 8,642
Old 7,582 8,066 7,582
Change 3.3% 3.7% 14.0%
EBIT, IDR b
New 1,497 1,551 1,618
Old 1,420 1,461 1,514
Change 5.4% 6.2% 6.8%
Net profit, IDR b
New 953 1,015 1,081
Old 896 947 1,003
May 8, 2017
4We conservatively keep our FY17 yield forecast at 75 tonnes/ha, despite
the FY16 sugarcane production yield of 83 tonnes/ha.
Figure 5
: Increasing sugarcane planted area and production (‘000)
Source: Company, Maybank Kim Eng
3.2
New mill plant is running smoothly, lowering the risk of
missing some of the refined quota
Commissioning for the brand new Mill plant for white sugar production
was a success and apparently has been commercially operating since early
April 2017. Given this operation, TBLA has officially become a fully
integrated sugar player with a sugarcane plantation, mill, and refinery.
We think TBLA’s fully integrated sugar business will increase
its bargaining
power to secure a refined sugar import quota going forward to help
address the sugar deficit in Indonesia. Thus, we see the risk of TBLA losing
quota will continue to moderate.
During the first week Apr-17, the mill processed sugarcane at a rate of
2,500 tcd instead of its full capacity of 8,000 tcd. We acknowledge
investor concerns about potential start-up issues that are typical for a
new mill, such as those relating to technical and even administrative
issues. We will closely monitor the situation to learn of any potential
delays, but feel that we have factored into our estimates ample time
based on the schedule below (Fig 6). Our assumption factors in 50%
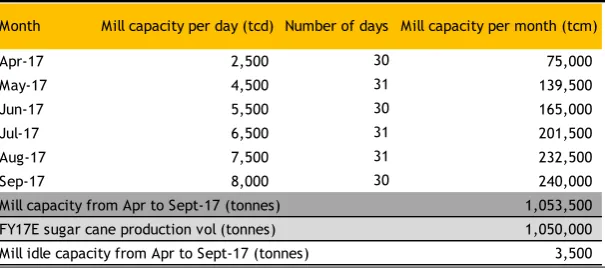
utilization rate for the mill for 2017, which we think is justified.
Figure 6: Mill capacity scenario
Source: Maybank Kim Eng. Note: tcd= tonnes cane per day, tcm= tonnes cane per month
However our conservative scenario exhibited in Fig 6 shows that the mill
will able to produce all of the harvested sugarcane in the harvest season
this year. We assume that TBLA will manage to gradually increase its
capacity on average by 28% per month from April to September 2017, from
0 200 400 600 800 1,000 1,200
0 2 4 6 8 10 12 14 16
2012 2013 2014 2015 2016 2017F
Sugarcane planted area (Ha) (LHS) Sucarcane production (tonnes) (RHS)
Month Mill capacity per day (tcd) Number of days Mill capacity per month (tcm)
Apr-17 2,500 30 75,000 May-17 4,500 31 139,500 Jun-17 5,500 30 165,000 Jul-17 6,500 31 201,500 Aug-17 7,500 31 232,500 Sep-17 8,000 30 240,000 1,053,500
1,050,000
3,500 Mill capacity from Apr to Sept-17 (tonnes)
May 8, 2017
52,500 tcd to 8,000 tcd, respectively. We believe the ramp-up should go
well given the solid management experience and with Sungai Budi (
TBLA’s
parent company) having been an operator of plantations since 1947.
3.3
The “Hidden” capacity: a
dditional back-end refinery
capacity from the new mill
As we mentioned in our Mar-17 report,
Still as Sweet
, TBLA holds an
import quota of 266k tonnes of refined sugar at end Mar-17(116k tonnes
were carried over from 2016 and 150k tonnes were granted in Q117). We
expect TBLA will not able to monetize the whole import quota in 2017,
given the constraints from its standalone refinery capacity of 220k tonnes
per annum. Hence, our initial sales volume forecast for FY17 is 200k
tonnes.
However, TBLA has successfully taken action without investing any
additional substantial capex by installing a conveyer belt on the sugar
bleaching warehouse inside the Mill to increase its refined sugar
production capacity. We think it will improve
TBLA’s
ability to fully
monetize its import quota going forward.
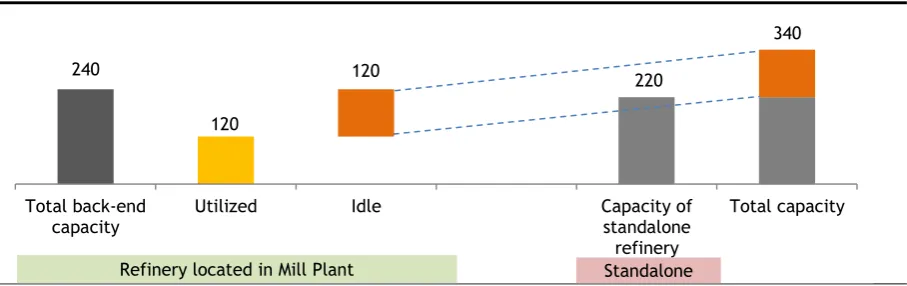
The company has also taken steps to further utilize the mill during the
idle periods when harvesting is completed. The Mill for retail white sugar
only operates during 6 months of the harvesting period, which is from
April to September every year. Thus, the equipment will be unused for
about 6 months, from January to March and October to December. This
includes the refinery equipment inside the Mill that has a production
capacity of 20-24k tonnes per month or 240-288k tonnes per year. Looking
at this opportunity, TBLA decided that the best way to utilize this idle
capacity of 120-144k tonnes pa was by installing a conveyor belt in the
sugar bleaching warehouse to connect the Mill to the port in order to
process imported raw sugar that was previously only processed by the
standalone refinery near the port (c60km away from the mill).
Figure 7: Additional refinery capacity from back-end refinery in mill plant (tonnes per year)
Source: Company, Maybank Kim Eng
Therefore, if we combine the idle/additional mill capacity with the
standalone refinery capacity, TBLA will have at least 340k tonnes of
annual capacity to process its imported raw sugar going forward, shows in
Fig 7. This implies 280k tonnes of production capacity in 2017, which is
27% higher than our initial forecast of 220k tonnes. This fact reinforced
our decision to increase our FY17 refined sugar sales volume forecast by
13%, from 200k tonnes to 225k tonnes, to capture this opportunity.
240
120
120
220
340
Total back-end
capacity
Utilized
Idle
Capacity of
standalone
refinery
Total capacity
May 8, 2017
64.
TP increased
Given the supporting catalysts mentioned above, we increase our SOTP
based TP by 27% to IDR1,900 for end-2017, implying a 2017 P/E of 10.5x.
We maintain EV/ha assumption USD9,000/ha for palm oil
business.
Meanwhile, we increase our P/E multiple for refined sugar
business from 8.0x to
10x due to TBLA’s high bargaining power as
a sugar company with both mill and refinery capacity sufficient
to secure import quotas in the future.
We also increase our FY17 forecast for refined sugar earnings by
13% to ID554b on the back of 13% higher refined sugar sales
volume in 2017 of 225k tonnes.
The sugar business value is calculated using a DCF method and
our WACC of 10.5% is unchanged.
We think the 2017 P/E valuation of 10.5x is undemanding given the strong
EPS growth of 55% in 2017E.
Figure 8: FY17 SOTP valuation changes
Source: Maybank Kim Eng
EV IDRb
Valuation method
EV IDRb
Valuation method
Palm oil business
4,859
EV/ha (USD 9,000/ha)
4,859
EV/ha (USD 9,000/ha) Unchanged
Refined sugar business
3,936
8x P/E
5,535
10x P/E
Multiple changes and
higher earnings forecast
White sugar business
3,543
DCF, WACC 10.5%
3,543
DCF, WACC 10.5%
Unchanged
Sub-total
12,338
13,937
Cash (IDRb)
480
527
10% higher
Debt (IDRb)
(4,432)
(4,432)
Unchanged
Net debt (IDRb)
(3,952)
(3,905)
1% lower
Equity Value (IDRb)
8,386
10,032
# of shares (m)
5.34
5.34
NAV/ share (IDR)
1,570
1,879
Target price (IDR)
1,500
1,900
27% higher
Old
New
May 8, 2017
7Value Proposition
Fully integrated oil palm company with 40,084ha of
nucleus planted area across Sumatra and Kalimantan.
Transformed into a sugar player starting 2012. Converting
old low-yielding oil palm trees into sugar cane due to
suitable location in Lampung. Targets 15,000ha by 2017.
Obtained raw sugar import quota of 294,000 tonnes in
2016 (zero in 2015 and 108,000 tonnes in 2014).
The only public listed fully integrated sugar player
through the completion of its 8,000 tcd mill (tonnes of
cane per day).
TBLA revenue composition & EBITDA margin
Source: Company, Maybank Kim Eng
Price Drivers
Historical share price trend
Source: Bloomberg, Maybank Kim Eng
1.
In 2014, the shares rebounded as TBLA was awarded a
raw sugar import quota of 108,000 tonnes and the oil
price recovered.
2.
Record-high profit in 2014, +376% YoY, mostly due to
refined sugar.
3.
TBLA was not given any sugar import quota for 2015 as
the newly elected government reviewed the import
quota. CPO price tumbled again following the crash in
the crude oil price.
4.
Government awarded TBLA a raw sugar import quota of
294,000 tonnes, the most ever.
5.
Delivered strong FY16 result and government granted
another 150,000 tonnes import quota in 1Q17.
Financial Metrics
Forecast EBITDA margin to increase from 16% in 2015 to
24% in 2017, driven by TBLA’s high-margin sugar division.
For every IDR1,000/kg ASP increase in CPO price, net
profit would increase 14% for FY17F.
Significant growth in net profit forecast to lead to higher
FCF, translating into a higher pay-out ratio and dividend
yield.
Management will also focus on deleveraging going
forward. With lower cost of capital and higher earnings,
ROIC should improve to 13% in 2017 from 3% in 2015.
Net profit vs ROIC and dividend yield
Source: Company, Maybank Kim Eng
Swing Factors
Upside
Better than expected FFB yields.
Better than expected CPO prices going forward.
Increase in government’s sugar price floor.
Better than expected sugar cane yields and extraction
rate.
Downside
Worse than expected CPO prices going forward.
Delay in sugar mill optimization capacity.
Elimination of government protection for the domestic
sugar industry dominated by small farmers.
Government decides not to allocate raw sugar import
quota to TBLA.
[email protected]
60 80 100 120 140 160 180 200 220 240400 500 600 700 800 900 1,000 1,100 1,200 1,300
May-12 May-13 May-14 May-15 May-16
Tunas Baru Lampung - (LHS, IDR)
Tunas Baru Lampung / MSCI AC Asia ex JP - (RHS, %)
1
5
2 4
May 8, 2017
8FYE 31 Dec FY15A FY16A FY17E FY18E FY19E
Key Metrics
P/E (reported) (x) 15.3 6.2 7.6 7.1 6.7
Core P/E (x) 36.7 11.8 7.6 7.1 6.7
P/BV (x) 2.5 2.1 1.8 1.5 1.3
P/NTA (x) 2.5 2.1 1.8 1.5 1.3
Net dividend yield (%) 0.8 3.4 5.3 5.6 6.0
FCF yield (%) nm nm 5.8 8.4 11.3
EV/EBITDA (x) 8.1 6.9 6.0 5.6 5.1
EV/EBIT (x) 11.3 8.8 7.5 7.0 6.4
INCOME STATEMENT (IDR b)
Revenue 5,331.4 6,514.0 7,832.3 8,366.4 8,642.5
Gross profit 1,170.5 1,625.3 2,209.4 2,372.2 2,545.1
EBITDA 843.3 1,409.2 1,851.7 1,926.5 2,022.7
Depreciation (197.2) (260.0) (310.0) (330.0) (360.0)
Amortisation (42.3) (45.0) (45.0) (45.0) (45.0)
EBIT 603.9 1,104.2 1,496.7 1,551.5 1,617.7
Net interest income /(exp) (219.3) (299.1) (246.6) (219.1) (197.7)
Associates & JV 0.0 0.0 0.0 0.0 0.0
Exceptionals 0.0 0.0 0.0 0.0 0.0
Other pretax income (121.4) (2.4) 20.0 20.0 20.0
Pretax profit 263.2 802.7 1,270.2 1,352.4 1,440.0
Income tax (62.4) (181.7) (316.9) (337.3) (359.2)
Minorities (3.8) (5.6) 0.0 0.0 0.0
Perpetual securities 0.0 0.0 0.0 0.0 0.0
Discontinued operations 0.0 0.0 0.0 0.0 0.0
Reported net profit 197.0 615.4 953.3 1,015.1 1,080.8
Core net profit 197.0 615.4 953.3 1,015.1 1,080.8
Preferred Dividends 0.0 0.0 0.0 0.0 0.0
BALANCE SHEET (IDR b)
Cash & Short Term Investments 296.0 136.8 526.9 490.9 639.7 Accounts receivable 797.2 1,132.1 1,361.2 1,454.1 1,502.0
Inventory 1,146.0 2,579.8 2,967.3 3,163.3 3,217.7
Reinsurance assets 0.0 0.0 0.0 0.0 0.0
Property, Plant & Equip (net) 5,984.5 7,317.0 7,607.0 7,877.0 8,117.0
Intangible assets 0.0 0.0 0.0 0.0 0.0
Investment in Associates & JVs 0.0 0.0 0.0 0.0 0.0
Other assets 1,060.2 1,431.1 1,709.1 1,825.1 1,881.1
Total assets 9,283.8 12,596.8 14,171.6 14,810.4 15,357.5
ST interest bearing debt 1,595.4 1,351.2 1,051.5 915.3 797.4 Accounts payable 329.7 1,877.5 2,257.5 2,411.4 2,491.0 LT interest bearing debt 2,803.0 3,157.5 3,380.3 3,138.7 2,931.1 Other liabilities 1,677.0 2,790.0 3,355.0 3,583.0 3,702.0
Total Liabilities 6,405.3 9,176.2 10,043.9 10,048.9 9,921.3
Shareholders Equity 2,857.0 3,394.5 4,101.5 4,735.4 5,410.1
Minority Interest 21.5 26.2 26.2 26.2 26.2
Total shareholder equity 2,878.5 3,420.6 4,127.7 4,761.5 5,436.3
Perpetual securities 0.0 0.0 0.0 0.0 0.0
Total liabilities and equity 9,283.8 12,596.8 14,171.6 14,810.4 15,357.5
CASH FLOW (IDR b)
Pretax profit 263.2 802.7 1,270.2 1,352.4 1,440.0
Depreciation & amortisation 239.5 305.0 355.0 375.0 405.0 Adj net interest (income)/exp 219.3 299.1 246.6 219.1 197.7 Change in working capital (238.4) (221.0) (236.6) (134.8) (22.8) Cash taxes paid (62.4) (181.7) (316.9) (337.3) (359.2)
Other operating cash flow 0.0 0.0 0.0 0.0 0.0
Cash flow from operations (89.6) 859.9 1,022.7 1,205.3 1,419.5
Capex (1,936.2) (1,592.5) (600.0) (600.0) (600.0)
Free cash flow (2,025.8) (732.6) 422.7 605.3 819.5
Dividends paid (131.0) (59.1) (246.2) (381.3) (406.0)
Equity raised / (purchased) 344.1 (18.9) 0.0 0.0 0.0
Perpetual securities 0.0 0.0 0.0 0.0 0.0
Change in Debt 1,324.2 110.3 (76.9) (377.8) (325.4)
Perpetual securities distribution 0.0 0.0 0.0 0.0 0.0
Other invest/financing cash flow 264.7 541.1 290.5 117.7 60.8
Effect of exch rate changes 0.0 0.0 0.0 0.0 0.0
May 8, 2017
9FYE 31 Dec FY15A FY16A FY17E FY18E FY19E
Key Ratios Growth ratios (%)
Revenue growth (15.9) 22.2 20.2 6.8 3.3
EBITDA growth (20.8) 67.1 31.4 4.0 5.0
EBIT growth (24.1) 82.9 35.6 3.7 4.3
Pretax growth (53.2) 205.0 58.2 6.5 6.5
Reported net profit growth (54.5) 212.4 54.9 6.5 6.5
Core net profit growth (54.5) 212.4 54.9 6.5 6.5
Profitability ratios (%)
EBITDA margin 15.8 21.6 23.6 23.0 23.4
EBIT margin 11.3 17.0 19.1 18.5 18.7
Pretax profit margin 4.9 12.3 16.2 16.2 16.7
Payout ratio 30.0 40.0 40.0 40.0 40.0
DuPont analysis
Net profit margin (%) 3.7 9.4 12.2 12.1 12.5
Revenue/Assets (x) 0.6 0.5 0.6 0.6 0.6
Assets/Equity (x) 3.2 3.7 3.5 3.1 2.8
ROAE (%) 7.4 19.7 25.4 23.0 21.3
ROAA (%) 2.4 5.6 7.1 7.0 7.2
Liquidity & Efficiency
Cash conversion cycle 115.0 109.2 102.5 104.5 105.2
Days receivable outstanding 50.9 53.3 57.3 60.6 61.6
Days inventory outstanding 90.9 137.2 177.6 184.1 188.4
Days payables outstanding 26.9 81.3 132.4 140.2 144.7
Dividend cover (x) 3.3 2.5 2.5 2.5 2.5
Current ratio (x) 1.2 1.1 1.3 1.3 1.4
Leverage & Expense Analysis
Asset/Liability (x) 1.4 1.4 1.4 1.5 1.5
Net gearing (%) (incl perps) 142.5 127.8 94.6 74.8 56.8 Net gearing (%) (excl. perps) 142.5 127.8 94.6 74.8 56.8
Net interest cover (x) 2.8 3.7 6.1 7.1 8.2
Debt/EBITDA (x) 5.2 3.2 2.4 2.1 1.8
Capex/revenue (%) 36.3 24.4 7.7 7.2 6.9
Net debt/ (net cash) 4,102.4 4,371.9 3,904.9 3,563.1 3,088.9
May 8, 2017
10Research Offices
REGIONAL
Sadiq CURRIMBHOY
Regional Head, Research & Economics (65) 6231 5836 [email protected]
WONG Chew Hann, CA
Regional Head of Institutional Research (603) 2297 8686 [email protected]
ONG Seng Yeow
Regional Head of Retail Research (65) 6231 5839
TAN Sin Mui
Director of Research
(65) 6231 5849 [email protected]
ECONOMICS
(65) 6231 5836 [email protected]
Willie CHAN
Hong Kong / Regional
(852) 2268 0631 [email protected]
MALAYSIA
WONG Chew Hann, CAHead of Research
(603) 2297 8686 [email protected]
• Plantations - Regional
Mohshin AZIZ
(603) 2297 8692 [email protected]
• Aviation - Regional • Petrochem
YIN Shao Yang, CPA
(603) 2297 8916 [email protected]
• Gaming –Regional • Media
TAN Chi Wei, CFA
(603) 2297 8690 [email protected]
• Power • Telcos
• Building Materials • Glove • Ports • Shipping
Ivan YAP
(603) 2297 8612 [email protected]
• Automotive • Semiconductor • Technology
Kevin WONG
Tee Sze Chiah Head of Retail Research
(603) 2082 6858 [email protected]
HONG KONG / CHINA
Howard WONG Head of Research
(852) 2268 0648
• Consumer Staples & Durables
Ka Leong LO, CFA
(852) 2268 0630 [email protected]
• Consumer Discretionary & Auto
Mitchell KIM
• Healthcare & Pharmaceutical
INDIA
Jigar SHAH Head of Research
(91) 22 6623 2632 [email protected]
• Strategy • Oil & Gas • Automobile • Cement
Vishal MODI
(91) 22 6623 2607 [email protected]
• Banking & Financials
Neerav DALAL
(91) 22 6623 2606 [email protected]
• Software Technology • Telcos
SINGAPORE
Neel SINHA Head of Research
(65) 6231 5838 [email protected]
• Strategy • Metals & Mining • Cement
Rahmi MARINA
• Infra • Construction • Transport• Telcos
Janni ASMAN
(62) 21 8066 8687 [email protected]
• Cigarette • Healthcare • Retail
Adhi TASMIN
• Conglomerates • Property • Gaming • Ports/ Logistics
Maria LAPIZ Head of Institutional Research
Dir (66) 2257 0250 | (66) 2658 6300 ext 1399 [email protected]
• Strategy • Consumer • Materials • Ind. Estates
Sittichai DUANGRATTANACHAYA
(66) 2658 6300 ext 1393 [email protected]
• Services Sector • Transport
Yupapan POLPORNPRASERT
• Real Estate & Contractors
Sukit UDOMSIRIKULHead of Retail Research
(66) 2658 6300 ext 5090
THAI Quang Trung, CFA, Deputy Manager, Institutional Research
(84) 8 44 555 888 x 8180 [email protected]
• Real Estate • Construction • Materials
Le Nguyen Nhat Chuyen
(84) 8 44 555 888 x 8082 [email protected]
• Oil & Gas
NGUYEN Thi Ngan Tuyen,Head of Retail Research
(84) 8 44 555 888 x 8081
• Food & Beverage • Oil&Gas • Banking
TRINH Thi Ngoc Diep
(84) 4 44 555 888 x 8208 [email protected]
• Technology • Utilities • Construction
PHAM Nhat Bich
(84) 8 44 555 888 x 8083 [email protected]
• Consumer • Manufacturing • Fishery
NGUYEN Thi Sony Tra Mi
(84) 8 44 555 888 x 8084
May 8, 2017
11APPENDIX I: TERMS FOR PROVISION OF REPORT, DISCLAIMERS AND DISCLOSURES
DISCLAIMERS
This research report is prepared for general circulation and for information purposes only and under no circumstances should it be considered or intended as an offer to sell or a solicitation of an offer to buy the securities referred to herein. Investors should note that values of such securities, if any, may fluctuate
and that each security’s price or value may rise or fall. Opinions or recommendations contained herein are in form of technical ratings and fundamental
ratings. Technical ratings may differ from fundamental ratings as technical valuations apply different methodologies and are purely based on price and volume-related information extracted from the relevant jurisdiction’s stock exchange in the equity analysis. Accordingly, investors’ returns may be less than the original sum invested. Past performance is not necessarily a guide to future performance. This report is not intended to provide personal investment advice and does not take into account the specific investment objectives, the financial situation and the particular needs of persons who may receive or read this report. Investors should therefore seek financial, legal and other advice regarding the appropriateness of investing in any securities or the investment strategies discussed or recommended in this report.
The information contained herein has been obtained from sources believed to be reliable but such sources have not been independently verified by Maybank
Investment Bank Berhad, its subsidiary and affiliates (collectively, “MKE”) and consequently no representation is made as to the accuracy or completeness of
this report by MKE and it should not be relied upon as such. Accordingly, MKE and its officers, directors, associates, connected parties and/or employees
(collectively, “Representatives”) shall not be liable for any direct, indirect or consequential losses or damages that may arise from the use or reliance of this
report. Any information, opinions or recommendations contained herein are subject to change at any time, without prior notice.
This report may contain forward looking statements which are often but not always identified by the use of words such as “anticipate”, “believe”, “estimate”, “intend”, “plan”, “expect”, “forecast”, “predict” and “project” and statements that an event or result “may”, “will”, “can”, “should”, “could” or “might”
occur or be achieved and other similar expressions. Such forward looking statements are based on assumptions made and information currently available to us and are subject to certain risks and uncertainties that could cause the actual results to differ materially from those expressed in any forward looking statements. Readers are cautioned not to place undue relevance on these forward-looking statements. MKE expressly disclaims any obligation to update or revise any such forward looking statements to reflect new information, events or circumstances after the date of this publication or to reflect the occurrence of unanticipated events.
MKE and its officers, directors and employees, including persons involved in the preparation or issuance of this report, may, to the extent permitted by law, from time to time participate or invest in financing transactions with the issuer(s) of the securities mentioned in this report, perform services for or solicit business from such issuers, and/or have a position or holding, or other material interest, or effect transactions, in such securities or options thereon, or other investments related thereto. In addition, it may make markets in the securities mentioned in the material presented in this report. One or more directors, officers and/or employees of MKE may be a director of the issuers of the securities mentioned in this report to the extent permitted by law.
This report is prepared for the use of MKE’s clients and may not be reproduced, altered in any way, transmitted to, copied or distributed to any other party in
whole or in part in any form or manner without the prior express written consent of MKE and MKE and its Representatives accepts no liability whatsoever for the actions of third parties in this respect.
This report is not directed to or intended for distribution to or use by any person or entity who is a citizen or resident of or located in any locality, state, country or other jurisdiction where such distribution, publication, availability or use would be contrary to law or regulation. This report is for distribution only under such circumstances as may be permitted by applicable law. The securities described herein may not be eligible for sale in all jurisdictions or to certain categories of investors. Without prejudice to the foregoing, the reader is to note that additional disclaimers, warnings or qualifications may apply based on geographical location of the person or entity receiving this report.
Malaysia
Opinions or recommendations contained herein are in the form of technical ratings and fundamental ratings. Technical ratings may differ from fundamental ratings as technical valuations apply different methodologies and are purely based on price and volume-related information extracted from Bursa Malaysia Securities Berhad in the equity analysis.
Singapore
This report has been produced as of the date hereof and the information herein may be subject to change. Maybank Kim Eng Research Pte. Ltd. (“Maybank
KERPL”) in Singapore has no obligation to update such information for any recipient. For distribution in Singapore, recipients of this report are to contact
Maybank KERPL in Singapore in respect of any matters arising from, or in connection with, this report. If the recipient of this report is not an accredited investor, expert investor or institutional investor (as defined under Section 4A of the Singapore Securities and Futures Act), Maybank KERPL shall be legally liable for the contents of this report, with such liability being limited to the extent (if any) as permitted by law.
Thailand
Except as specifically permitted, no part of this presentation may be reproduced or distributed in any manner without the prior written permission of Maybank Kim Eng Securities (Thailand) Public Company Limited. Maybank Kim Eng Securities (Thailand) Public Company Limited (“MBKET”) accepts no liability
whatsoever for the actions of third parties in this respect.
Due to different characteristics, objectives and strategies of institutional and retail investors, the research reports of MBKET Institutional and Retail Research Department may differ in either recommendation or target price, or both. MBKET Retail Research is intended for retail investors ( http://kelive.maybank-ke.co.th) while Maybank Kim Eng Institutional Research is intended only for institutional investors based outside Thailand only.
The disclosure of the survey result of the Thai Institute of Directors Association (“IOD”) regarding corporate governance is made pursuant to the policy of the
Office of the Securities and Exchange Commission. The survey of the IOD is based on the information of a company listed on the Stock Exchange of Thailand and the market for Alternative Investment disclosed to the public and able to be accessed by a general public investor. The result, therefore, is from the perspective of a third party. It is not an evaluation of operation and is not based on inside information. The survey result is as of the date appearing in the Corporate Governance Report of Thai Listed Companies. As a result, the survey may be changed after that date. MBKET does not confirm nor certify the accuracy of such survey result.
The disclosure of the Anti-Corruption Progress Indicators of a listed company on the Stock Exchange of Thailand, which is assessed by Thaipat Institute, is made in order to comply with the policy and sustainable development plan for the listed companies of the Office of the Securities and Exchange Commission. Thaipat Institute made this assessment based on the information received from the listed company, as stipulated in the form for the assessment of Anti-corruption which refers to the Annual Registration Statement (Form 56-1), Annual Report (Form 56-2), or other relevant documents or reports of such listed company. The assessment result is therefore made from the perspective of Thaipat Institute that is a third party. It is not an assessment of operation and is not based on any inside information. Since this assessment is only the assessment result as of the date appearing in the assessment result, it may be changed after that date or when there is any change to the relevant information. Nevertheless, MBKET does not confirm, verify, or certify the accuracy and completeness of the assessment result.
US
This third-party research report is distributed in the United States (“US”) to Major US Institutional Investors (as defined in Rule 15a-6 under the Securities
Exchange Act of 1934, as amended) only by Maybank Kim Eng Securities USA Inc (“Maybank KESUSA”), a broker-dealer registered in the US (registered under
May 8, 2017
12Disclosure of Interest
Malaysia: MKE and its Representatives may from time to time have positions or be materially interested in the securities referred to herein and may further act as market maker or may have assumed an underwriting commitment or deal with such securities and may also perform or seek to perform investment banking services, advisory and other services for or relating to those companies.
Singapore: As of 8 May 2017, Maybank KERPL and the covering analyst do not have any interest in any companies recommended in this research report.
Thailand: MBKET may have a business relationship with or may possibly be an issuer of derivative warrants on the securities /companies mentioned in the research report. Therefore, Investors should exercise their own judgment before making any investment decisions. MBKET, its associates, directors, connected parties and/or employees may from time to time have interests and/or underwriting commitments in the securities mentioned in this report.
Hong Kong: KESHK may have financial interests in relation to an issuer or a new listing applicant referred to as defined by the requirements under Paragraph 16.5(a) of the Hong Kong Code of Conduct for Persons Licensed by or Registered with the Securities and Futures Commission.
As of 8 May 2017, KESHK and the authoring analyst do not have any interest in any companies recommended in this research report.
MKE may have, within the last three years, served as manager or co-manager of a public offering of securities for, or currently may make a primary market in issues of, any or all of the entities mentioned in this report or may be providing, or have provided within the previous 12 months, significant advice or investment services in relation to the investment concerned or a related investment and may receive compensation for the services provided from the companies covered in this report.
OTHERS
Analyst Certification of Independence
The views expressed in this research report accurately reflect the analyst’s personal views about any and all of the subject securities or issuers; and no part of
the research analyst’s compensation was, is or will be, directly or indirectly, related to the specific recommendations or views expressed in the report.
Reminder
Structured securities are complex instruments, typically involve a high degree of risk and are intended for sale only to sophisticated investors who are capable of understanding and assuming the risks involved. The market value of any structured security may be affected by changes in economic, financial and political factors (including, but not limited to, spot and forward interest and exchange rates), time to maturity, market conditions and volatility and the credit quality of any issuer or reference issuer. Any investor interested in purchasing a structured product should conduct its own analysis of the product and consult with its own professional advisers as to the risks involved in making such a purchase.
No part of this material may be copied, photocopied or duplicated in any form by any means or redistributed without the prior consent of MKE.
UK
This document is being distributed by Maybank Kim Eng Securities (London) Ltd (“Maybank KESL”) which is authorized and regulated, by the Financial Conduct
Authority and is for Informational Purposes only. This document is not intended for distribution to anyone defined as a Retail Client under the Financial Services and Markets Act 2000 within the UK. Any inclusion of a third party link is for the recipients convenience only, and that the firm does not take any responsibility for its comments or accuracy, and that access to such links is at the individuals own risk. Nothing in this report should be considered as constituting legal, accounting or tax advice, and that for accurate guidance recipients should consult with their own independent tax advisers.
DISCLOSURES
Legal Entities Disclosures
Malaysia: This report is issued and distributed in Malaysia by Maybank Investment Bank Berhad (15938- H) which is a Participating Organization of Bursa Malaysia Berhad and a holder of Capital Markets and Services License issued by the Securities Commission in Malaysia. Singapore: This report is distributed in Singapore by Maybank KERPL (Co. Reg No 198700034E) which is regulated by the Monetary Authority of Singapore. Indonesia: PT Maybank Kim Eng Securities
(“PTMKES”) (Reg. No. KEP-251/PM/1992) is a member of the Indonesia Stock Exchange and is regulated by the Financial Services Authority (Indonesia).
Thailand: MBKET (Reg. No.0107545000314) is a member of the Stock Exchange of Thailand and is regulated by the Ministry of Finance and the Securities and Exchange Commission. Philippines: Maybank ATRKES (Reg. No.01-2004-00019) is a member of the Philippines Stock Exchange and is regulated by the Securities and Exchange Commission. Vietnam: Maybank Kim Eng Securities Limited (License Number: 117/GP-UBCK) is licensed under the State Securities Commission of Vietnam. Hong Kong: KESHK (Central Entity No AAD284) is regulated by the Securities and Futures Commission. India: Kim Eng Securities India Private Limited
(“KESI”) is a participant of the National Stock Exchange of India Limited and the Bombay Stock Exchange and is regulated by Securities and Exchange Board of
India (“SEBI”) (Reg. No. INZ000010538). KESI is also registered with SEBI as Category 1 Merchant Banker (Reg. No. INM 000011708) and as Research Analyst (Reg
May 8, 2017
13Historical recommendations and target price: Tunas Baru Lampung (TBLA IJ)
Definition of Ratings
Maybank Kim Eng Research uses the following rating system
BUY Return is expected to be above 10% in the next 12 months (excluding dividends)
HOLD Return is expected to be between - 10% to +10% in the next 12 months (excluding dividends)
SELL Return is expected to be below -10% in the next 12 months (excluding dividends)
Applicability of Ratings
The respective analyst maintains a coverage universe of stocks, the list of which may be adjusted according to needs. Investment ratings are only applicable to the stocks which form part of the coverage universe. Reports on companies which are not part of the coverage do not carry investment ratings as we do not actively follow developments in these companies.
400.0 600.0 800.0 1,000.0 1,200.0 1,400.0
Oct-15 Jan-16 May-16 Aug-16 Nov-16 Feb-17 May-17
Tunas Baru Lampung
28 Sep Buy : Rp1,500
May 8, 2017
14
Malaysia
Maybank Investment Bank Berhad
(A Participating Organisation of Bursa Malaysia Securities Berhad) 33rd Floor, Menara Maybank, 100 Jalan Tun Perak, 50050 Kuala Lumpur Tel: (603) 2059 1888; Fax: (603) 2078 4194
Singapore
Maybank Kim Eng Securities Pte Ltd Maybank Kim Eng Research Pte Ltd
50 North Canal Road
Maybank Kim Eng Securities USA Inc
777 Third Avenue, 21st Floor New York, NY 10017, U.S.A.
Tel: (212) 688 8886 Fax: (212) 688 3500
Stockbroking Business:Level 8, Tower C, Dataran Maybank, No.1, Jalan Maarof
59000 Kuala Lumpur Tel: (603) 2297 8888 Fax: (603) 2282 5136
Hong Kong
Kim Eng Securities (HK) Ltd
Level 30,
PT Maybank Kim Eng Securities
Sentral Senayan III, 22nd Floor
Jl. Asia Afrika No. 8
Kim Eng Securities India Pvt Ltd
2nd Floor, The International, 16, Maharishi Karve Road, Churchgate Station, Mumbai City - 400 020, India
Tel: (91) 22 6623 2600 Fax: (91) 22 6623 2604
Philippines
Maybank ATR Kim Eng Securities Inc.
17/F, Tower One & Exchange Plaza Ayala Triangle, Ayala Avenue
999/9 The Offices at Central World, 20th - 21st Floor,
Rama 1 Road Pathumwan, Bangkok 10330, Thailand
Tel: (66) 2 658 6817 (sales) Tel: (66) 2 658 6801 (research)
Vietnam
Maybank Kim Eng Securities Limited
4A-15+16 Floor Vincom Center Dong Khoi, 72 Le Thanh Ton St. District 1 Ho Chi Minh City, Vietnam
Tel : (84) 844 555 888 Fax : (84) 8 38 271 030
Saudi Arabia
In association with
Anfaal Capital
Villa 47, Tujjar Jeddah Prince Mohammed bin Abdulaziz Street P.O. Box 126575 Jeddah 21352
Tel: (966) 2 6068686 Fax: (966) 26068787
South Asia Sales Trading
Kevin Foy
Regional Head Sales Trading [email protected] Tel: (65) 6636-3620 US Toll Free: 1-866-406-7447
North Asia Sales Trading
Andrew Lee
[email protected] Tel: (852) 2268 0283 US Toll Free: 1 877 837 7635
www.maybank-ke.com | www.maybank-keresearch.com