P
la
n
ta
ti
o
n
s
In
d
o
n
e
si
a
THIS REPORT HAS BEEN PREPARED BY
PT MAYBANK KIM ENG SECURITIES
SEE PAGE 8 FOR IMPORTANT DISCLOSURES AND ANALYST CERTIFICATIONS
Anthony Lukmawijaya
[email protected]
(62) 21 8066 8690
Isnaputra Iskandar, CFA
[email protected]
(62) 21 8066 8680
Tunas Baru Lampung
(TBLA IJ)
Look ahead to sweet 2017;
BUY
FY16 EPS cut 10% on weak 3Q; FY17, TP unchanged
We remain positive on TBLA as 2017 will see the full-year contribution of
its sugar business (refinery and mill). Our SOTP-based target price of
IDR1,500 equates to a PER of 8.9x 2017F. Catalysts to the stock are
strong 1Q17 earnings on the back of readily available sugar inventory and
commencement of its sugar milling business.
Vol below expectation, but 4Q demand up strongly
Our analysis suggests that 2016 total sugar volume should have been 178k
tonnes, below our forecast of 200k tonnes due to weak demand in 3Q16.
Although the actual figure is lower than expected, sales in 4Q16 likely
reached 61k tonnes, up 63% QoQ. Should the strong pick-up in sales carry
through into 1Q17, we are confident our 200k tonnes sales volume
forecast for FY17 could be met. We have lowered our FY16 earnings
estimate by 9.6% to IDR615b, but maintain our FY17 forecast.
Additional 100k tonnes of raw sugar import quota
TBLA announced it was awarded another 100k tonnes of raw sugar import
quota to start the new year. With the new quota, TBLA comfortably sits
on 230k tonnes of inventory, which is enough to boost its 1Q17 earnings
and reach 200k tonnes of refined sugar sales for 2017
. The company’s
8,000 tcd (
tonnes of cane per day)
sugar mill should also commence
operation by the end of 1Q17. We expect its sugar milling business to
contribute 84k tonnes of additional sugar sales volume, translating to
IDR882b (+13% YoY) of revenue growth from this source alone.
Attractive valuation
TBLA is trading at an undemanding 8.9x 2017 P/E compared to its local
peers (c.18x 2017 P/E) and its regional peers at ~24x. Potential earnings
risk may arise from its palm oil business as strong yield recovery in the
overall i
ndustry’s production could damper CPO prices.
Share Price IDR 1,165
12m Price Target IDR 1,500 (+29%)
Previous Price Target IDR 1,500
BUY
Company Description
Statistics
52w high/low (IDR) 3m avg turnover (USDm) Free float (%)
Issued shares (m) Market capitalisation
Major shareholders:
27.8% 26.5% na
5,342 0.3 PT Tunas Baru Lampung is an upstream and downstream palm oil player expanding into the sugar business
PT Budi Delta Swakarya PT Sungai Budi na
1,165/480
45.7
IDR6.2T USD467M
Price Performance
60 80 100 120 140 160 180 200 220
400 500 600 700 800 900 1,000 1,100 1,200
Jan-15 Apr-15 Jul-15 Oct-15 Jan-16 Apr-16 Jul-16 Oct-16
Tunas Baru Lampung - (LHS, IDR)
Tunas Baru Lampung / Jakarta Composite Index - (RHS, %)
-1M -3M -12M
Absolute (%) 23 13 133
Relative to index (%) 23 15 96
Source: FactSet
FYE Dec (IDR b) FY14A FY15A FY16E FY17E FY18E
Revenue 6,338 5,331 6,371 7,582 8,066
EBITDA 1,065 843 1,349 1,775 1,836
Core net profit 433 197 615 896 947
Core EPS (IDR) 81 37 115 168 177
Core EPS growth (%) 375.9 (54.5) 212.0 45.7 5.7
Net DPS (IDR) 25 11 46 67 71
Core P/E (x) 14.4 31.6 10.1 6.9 6.6
P/BV (x) 2.5 2.2 1.8 1.5 1.3
Net dividend yield (%) 2.1 0.9 4.0 5.8 6.1
ROAE (%) 20.5 7.4 19.6 24.0 21.7
ROAA (%) 6.4 2.4 6.1 8.1 8.2
EV/EBITDA (x) 6.2 8.1 7.9 5.9 5.6
Net gearing (%) (incl perps) 103.7 142.5 128.3 102.8 84.7
Consensus net profit - - 646 874 944
January 12, 2017
2Figure 1: Changes in FY16F assumptions for TBLA
2016F 2016F Change
Old New
Assumptions
IDR/USD 13500 13500 0.0%
Refined sugar sales volume (tonnes) 200,000 178,000 -11.0%
White sugar production (tonnes) - - 0.0%
Refined sugar ASP (IDR/kg) 10,500 10,750 2.4%
White sugar ASP (IDR/kg) - - 0.0%
Nucleus FFB production (tonnes) 452,204 340,483 -24.7%
Gross CPO ASP (IDR/kg) 8,030 8,030 0.0%
Income statement (IDR b)
Revenue 6,635 6,371 -4.0%
COGS (4,905) (4,740) -3.4%
Gross Profit 1,729 1,631 -5.7%
Operating Expenses (599) (587) -2.0%
Operating Profit 1,131 1,044 -7.7%
Others (224) (224) 0.2%
Profit before tax 906 819 -9.6%
Net Profit 680 615 -9.6%
Assumptions 2016F 2017F 2018F
IDR/USD 13,500 13,500 13,500
Refined sugar sales volume (tonnes) 178,000 200,000 200,000
White sugar production (tonnes) - 84,000 95,625
Refined sugar ASP (IDR/kg) 10,750 10,000 10,000
White sugar ASP (IDR/kg) - 10,500 10,500
Nucleus FFB production (tonnes) 340,483 529,828 572,784
Gross CPO ASP (IDR/kg) 8,030 8,064 8,500
Source: Maybank Kim Eng
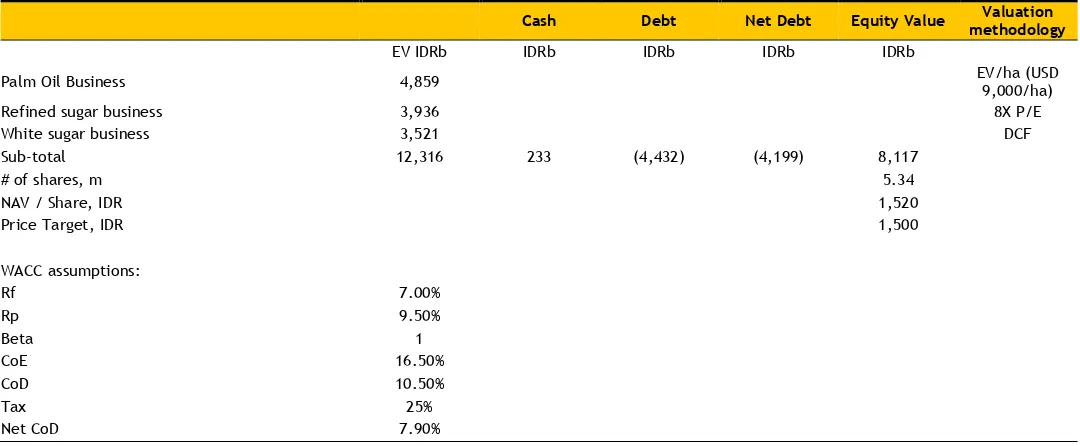
Figure 2: SOTP valuation
Cash Debt Net Debt Equity Value Valuation
methodology
EV IDRb IDRb IDRb IDRb IDRb
Palm Oil Business 4,859 EV/ha (USD
9,000/ha)
Refined sugar business 3,936 8X P/E
White sugar business 3,521 DCF
Sub-total 12,316 233 (4,432) (4,199) 8,117
# of shares, m 5.34
NAV / Share, IDR 1,520
Price Target, IDR 1,500
WACC assumptions:
Rf 7.00%
Rp 9.50%
Beta 1
CoE 16.50%
CoD 10.50%
Tax 25%
Net CoD 7.90%
January 12, 2017
3FOCUS CHARTS
Figure 3:Quarterly refined sugar sales volume
Source: Company, Maybank Kim Eng
Figure 4: Raw sugar import quota allocation
Source: Company, Maybank Kim Eng
Figure 5
: TBLA’s sugar cane plantation
Source: Company
Figure 6
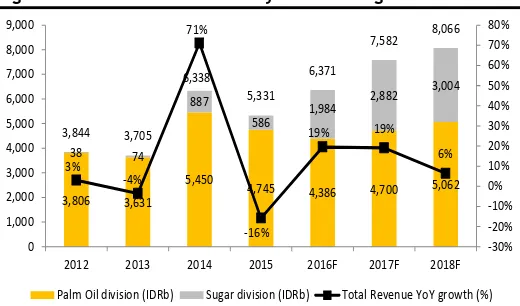
: TBLA’s sugar vs palm oil business revenue
Source: Company, Maybank Kim Eng
Figure 7: Revenue breakdown by business segment
Source: Company, Maybank Kim Eng
Figure 8: Earnings forecast (2016-2018F)
Source: Company, Maybank Kim Eng
3,000
Sugar sales volume (tonnes)
18,000
2013 2014 2015 2016F 2017F 2018F
Sugar import quota allocation (tons)
1,305 1,963
2012 2013 2014 2015 2016F 2017F 2018F
Sugar cane plantation (ha)
0% 2% 14% 11%
2012 2013 2014 2015 2016F 2017F 2018F
Sugar business revenue (%) Palm oil business revenue (%)
3,806 3,631 5,450
4,745 4,386 4,700 5,062
38 74
2012 2013 2014 2015 2016F 2017F 2018F
Palm Oil division (IDRb) Sugar division (IDRb) Total Revenue YoY growth (%)
242
2012 2013 2014 2015 2016F 2017F 2018F
January 12, 2017
4Value Proposition
Fully integrated palm oil company with 40,084ha of
nucleus planted area across Sumatra and Kalimantan.
Transformed into a sugar player starting 2012. Converting
old low-yielding palm oil trees into sugar cane due to
suitable location in Lampung. Targets 15,000ha by 2017.
Obtained raw sugar import quota of 264,000 tonnes last
year (zero in 2015 and 108,000 tonnes in 2014).
Will become fully integrated sugar player through the
completion of its 8,000 tcd (tonnes of cane per day) sugar
mill by the end of 4Q16.
Sugar should lift ROE from 7.4% in 2015 to 19.6%/24.0% in
FY16/17F, respectively.
TBLA revenue composition & EBITDA margin
Source: Company, Maybank Kim Eng
Price Drivers
Historical share price trend
Source: Bloomberg, Maybank Kim Eng
1.
Crude oil price corrected from its all-time high in 1H11,
which impacted the shares.
2.
In 2014, the shares rebounded as TBLA was awarded
108,000 tonnes of raw sugar import quota and the oil
price recovered.
3.
Record-high profit in 2014, +376% YoY, mostly due to
refined sugar.
4.
TBLA was not given any sugar import quota for 2015 as
the newly elected government reviewed the import
quota. CPO price tumbled again following the crash in
the crude oil price.
5.
Government awarded TBLA 264,000 tonnes of raw sugar
import quota, the most ever.
Financial Metrics
Forecast EBITDA margin to increase from 16% in 2015 to
23% in 2017,
driven by TBLA’s high
-margin sugar division.
For every IDR1,000/kg ASP increase in CPO price, net
profit would increase 16%/14% for FY16/17F.
Significant growth in net profit forecast to lead to higher
FCF, translating into a higher pay-out ratio and dividend
yield. We expect 40% DPR from 2016 onwards, up from
the usual 30%.
Management will also focus on deleveraging going
forward. With lower cost of capital and higher earnings,
ROIC should improve to 12% in 2017 from 3% in 2015.
Net profit vs ROIC and dividend yield
Source: Company, Maybank Kim Eng
Swing Factors
Upside
Higher-than-expected FFB yields.
Higher-than-expected CPO prices going forward.
Increase in government’s sugar price floor.
Higher-than-expected sugar cane yields and extraction
rate.
Downside
Worse-than-expected CPO prices going forward.
Delay in completion of its sugar mill.
Elimination of government protection for the domestic
sugar industry dominated by small farmers.
Government decides not to allocate raw sugar import
quotas to TBLA.
[email protected]
20.9%
17.7% 19.0% 16.8% 15.8%
21.6% 23.4% 22.8%
0% 5% 10% 15% 20% 25%
0% 20% 40% 60% 80% 100%
2011 2012 2013 2014 2015 2016F 2017F 2018F
Palm products (%) Sugar products (%)
EBITDA margin (%)
55 65 75 85 95 105 115 125 135 145
400 450 500 550 600 650 700 750 800
Aug-11 Aug-12 Aug-13 Aug-14 Aug-15 Aug-16
Tunas Baru Lampung - (LHS, IDR)
Tunas Baru Lampung / MSCI AC Asia ex JP - (RHS, %)
0% 5% 10% 15%
0 200 400 600 800 1,000
2012A 2013A 2014A 2015A 2016F 2017F 2018F
Net profit (IDRb, LHS) ROIC (%, RHS)
Dividend yield (%, RHS)
1
5
2
January 12, 2017
5FYE 31 Dec FY14A FY15A FY16E FY17E FY18E Key Metrics
P/E (reported) (x) 7.5 15.3 10.1 6.9 6.6
Core P/E (x) 14.4 31.6 10.1 6.9 6.6
P/BV (x) 2.5 2.2 1.8 1.5 1.3
P/NTA (x) 2.5 2.2 1.8 1.5 1.3
Net dividend yield (%) 2.1 0.9 4.0 5.8 6.1
FCF yield (%) nm nm nm 4.0 8.3
EV/EBITDA (x) 6.2 8.1 7.9 5.9 5.6
EV/EBIT (x) 8.3 11.3 10.2 7.4 7.0
INCOME STATEMENT (IDR b)
Revenue 6,337.6 5,331.4 6,370.6 7,582.3 8,066.4
Gross profit 1,292.7 1,170.5 1,630.8 2,132.9 2,280.4
EBITDA 1,065.0 843.3 1,348.5 1,775.2 1,836.2
Depreciation (227.8) (197.2) (260.0) (310.0) (330.0)
Amortisation (42.0) (42.3) (45.0) (45.0) (45.0)
EBIT 795.2 603.9 1,043.5 1,420.2 1,461.2
Net interest income /(exp) (201.0) (219.3) (274.0) (246.6) (219.1)
Associates & JV 0.0 0.0 0.0 0.0 0.0
Exceptionals 0.0 0.0 0.0 0.0 0.0
Other pretax income (31.7) (121.4) 49.5 20.0 20.0
Pretax profit 562.4 263.2 819.1 1,193.7 1,262.1
Income tax (125.9) (62.4) (204.4) (297.8) (314.7)
Minorities (3.0) (3.8) 0.0 0.0 0.0
Perpetual securities 0.0 0.0 0.0 0.0 0.0
Discontinued operations 0.0 0.0 0.0 0.0 0.0
Reported net profit 433.5 197.0 614.7 895.9 947.4
Core net profit 433.5 197.0 614.7 895.9 947.4
Preferred Dividends 0.0 0.0 0.0 0.0 0.0
BALANCE SHEET (IDR b)
Cash & Short Term Investments 519.7 296.0 606.5 232.5 96.3
Accounts receivable 711.2 797.2 952.5 1,133.7 1,206.1
Inventory 956.1 1,146.0 1,305.4 1,500.8 1,593.6
Reinsurance assets 0.0 0.0 0.0 0.0 0.0
Property, Plant & Equip (net) 4,245.5 5,984.5 6,724.5 7,014.5 7,284.5
Intangible assets 0.0 0.0 0.0 0.0 0.0
Investment in Associates & JVs 0.0 0.0 0.0 0.0 0.0
Other assets 896.0 1,060.2 1,257.3 1,488.6 1,583.2
Total assets 7,328.4 9,283.8 10,846.3 11,370.1 11,763.6
ST interest bearing debt 1,429.9 1,595.4 1,391.4 1,051.5 915.3
Accounts payable 292.3 329.7 394.0 468.9 498.8
LT interest bearing debt 1,644.2 2,803.0 3,622.7 3,380.3 3,138.7
Other liabilities 1,498.0 1,677.0 2,004.0 2,385.0 2,538.0
Total Liabilities 4,864.0 6,405.3 7,412.2 7,286.1 7,090.5
Shareholders Equity 2,446.8 2,857.0 3,412.6 4,062.6 4,651.6
Minority Interest 17.6 21.5 21.5 21.5 21.5
Total shareholder equity 2,464.4 2,878.5 3,434.1 4,084.1 4,673.1
Perpetual securities 0.0 0.0 0.0 0.0 0.0
Total liabilities and equity 7,328.4 9,283.8 10,846.3 11,370.1 11,763.6
CASH FLOW (IDR b)
Pretax profit 562.4 263.2 819.1 1,193.7 1,262.1
Depreciation & amortisation 269.7 239.5 305.0 355.0 375.0
Adj net interest (income)/exp 201.0 219.3 274.0 246.6 219.1
Change in working capital (354.9) (238.4) (250.5) (301.7) (135.2)
Cash taxes paid (125.9) (62.4) (204.4) (297.8) (314.7)
Other operating cash flow 0.0 0.0 0.0 0.0 0.0
Cash flow from operations 536.1 (89.6) 579.6 850.9 1,118.7
Capex (957.2) (1,936.2) (1,000.0) (600.0) (600.0)
Free cash flow (421.1) (2,025.8) (420.4) 250.9 518.7
Dividends paid (26.0) (131.0) (59.1) (245.9) (358.4)
Equity raised / (purchased) 255.9 344.1 0.0 0.0 0.0
Perpetual securities 0.0 0.0 0.0 0.0 0.0
Change in Debt 30.2 1,324.2 615.7 (582.3) (377.8)
Perpetual securities distribution 0.0 0.0 0.0 0.0 0.0
Other invest/financing cash flow 32.7 264.7 174.3 203.3 81.2
Effect of exch rate changes 0.0 0.0 0.0 0.0 0.0
January 12, 2017
6FYE 31 Dec FY14A FY15A FY16E FY17E FY18E Key Ratios
Growth ratios (%)
Revenue growth 71.0 (15.9) 19.5 19.0 6.4
EBITDA growth 51.1 (20.8) 59.9 31.6 3.4
EBIT growth 61.1 (24.1) 72.8 36.1 2.9
Pretax growth 372.9 (53.2) 211.2 45.7 5.7
Reported net profit growth 414.4 (54.5) 212.0 45.7 5.7
Core net profit growth 414.4 (54.5) 212.0 45.7 5.7
Profitability ratios (%)
EBITDA margin 16.8 15.8 21.2 23.4 22.8
EBIT margin 12.5 11.3 16.4 18.7 18.1
Pretax profit margin 8.9 4.9 12.9 15.7 15.6
Payout ratio 30.2 30.0 40.0 40.0 40.0
DuPont analysis
Net profit margin (%) 6.8 3.7 9.6 11.8 11.7
Revenue/Assets (x) 0.9 0.6 0.6 0.7 0.7
Assets/Equity (x) 3.0 3.2 3.2 2.8 2.5
ROAE (%) 20.5 7.4 19.6 24.0 21.7
ROAA (%) 6.4 2.4 6.1 8.1 8.2
Liquidity & Efficiency
Cash conversion cycle 77.3 115.0 115.1 113.7 118.4
Days receivable outstanding 32.0 50.9 49.4 49.5 52.2
Days inventory outstanding 62.2 90.9 93.1 92.7 96.3
Days payables outstanding 16.9 26.9 27.5 28.5 30.1
Dividend cover (x) 3.3 3.3 2.5 2.5 2.5
Current ratio (x) 1.1 1.2 1.4 1.6 1.6
Leverage & Expense Analysis
Asset/Liability (x) 1.5 1.4 1.5 1.6 1.7
Net gearing (%) (incl perps) 103.7 142.5 128.3 102.8 84.7
Net gearing (%) (excl. perps) 103.7 142.5 128.3 102.8 84.7
Net interest cover (x) 4.0 2.8 3.8 5.8 6.7
Debt/EBITDA (x) 2.9 5.2 3.7 2.5 2.2
Capex/revenue (%) 15.1 36.3 15.7 7.9 7.4
Net debt/ (net cash) 2,554.4 4,102.4 4,407.5 4,199.3 3,957.7
January 12, 2017
7Research Offices
REGIONAL Sadiq CURRIMBHOY
Regional Head, Research & Economics (65) 6231 5836 [email protected] WONG Chew Hann, CA
Regional Head of Institutional Research (603) 2297 8686 [email protected] ONG Seng Yeow
Regional Head of Retail Research (65) 6231 5839
[email protected] TAN Sin Mui
Director of Research
(65) 6231 5849 [email protected]
ECONOMICS Suhaimi ILIAS Chief Economist Singapore | Malaysia
(603) 2297 8682 [email protected] Tim LEELAHAPHAN
Thailand
(66) 2658 6300 ext 1420 [email protected] JUNIMAN
Chief Economist, BII Indonesia
(62) 21 29228888 ext 29682 [email protected]
STRATEGY Sadiq CURRIMBHOY Global Strategist
(65) 6231 5836 [email protected] Willie CHAN
Hong Kong / Regional
(852) 2268 0631 [email protected]
MALAYSIA
WONG Chew Hann, CAHead of Research
(603) 2297 8686 [email protected]
• Strategy
Desmond CH’NG, ACA
(603) 2297 8680
• Banking & Finance
LIAW Thong Jung
(603) 2297 8688 [email protected]
• Oil & Gas Services- Regional ONG Chee Ting, CA
(603) 2297 8678 [email protected]
• Plantations - Regional Mohshin AZIZ
(603) 2297 8692 [email protected]
• Aviation - Regional • Petrochem
YIN Shao Yang, CPA
(603) 2297 8916 [email protected]
• Gaming –Regional • Media
TAN Chi Wei, CFA
(603) 2297 8690 [email protected]
• Power • Telcos
WONG Wei Sum, CFA
(603) 2297 8679 [email protected]
• Property
LEE Yen Ling
(603) 2297 8691 [email protected]
• Building Materials • Glove • Ports • Shipping
Ivan YAP
(603) 2297 8612 [email protected]
• Automotive • Semiconductor • Technology
Kevin WONG
(603) 2082 6824 [email protected]
• REITs • Consumer Discretionary
LIEW Wei Han
(603) 2297 8676 [email protected]
• Consumer Staples
Tee Sze Chiah Head of Retail Research
(603) 2297 6858 [email protected]
HONG KONG / CHINA Howard WONG Head of Research
(852) 2268 0648 [email protected]
• Strategy • Oil & Gas - Regional
Benjamin HO
(852) 2268 0632 [email protected]
• Consumer & Auto
Christopher WONG
(852)2268 0652 [email protected]
• HK & China Properties
Jacqueline KO,CFA
(852) 2268 0633 [email protected]
• Consumer Staples & Durables
Ka Leong LO, CFA
(852) 2268 0630 [email protected]
• Consumer Discretionary & Auto
Mitchell KIM
(852) 2268 0634 [email protected]
• Internet & Telcos
Ning MA
(852) 2268 0672 [email protected]
• Insurance
Ricky NG, CFA
(852) 2268 0689 [email protected]
• Regional Renewables • HK & China Properties
Sonija LI, CFA, FRM
(852) 2268 0641 [email protected]
• Gaming
Stefan CHANG,CFA
(852) 2268 0675 [email protected]
• Technology –Regional
INDIA
Jigar SHAH Head of Research
(91) 22 6623 2632 [email protected]
• Strategy • Oil & Gas • Automobile • Cement
Vishal MODI
(91) 22 6623 2607 [email protected]
• Banking & Financials
Neerav DALAL
(91) 22 6623 2606 [email protected]
• Software Technology • Telcos
SINGAPORE
Neel SINHA Head of Research
(65) 6231 5838 [email protected]
• Strategy
• SMID Caps – Regional Gregory YAP
(65) 6231 5848 [email protected]
• SMID Caps
• Technology & Manufacturing • Telcos
Derrick HENG,CFA
(65) 6231 5843 [email protected]
• Transport• Property • REITs (Office)
John CHEONG,CFA
(65) 6231 5845 [email protected]
• Small & Mid Caps • Healthcare
Ng Li Hiang
(65) 6231 5840 [email protected]
• Banks
INDONESIA
Isnaputra ISKANDARHead of Research
(62) 21 8066 8680
• Strategy • Metals & Mining • Cement
Rahmi MARINA (62) 21 8066 8689
• Banking & Finance
Aurellia SETIABUDI
• Infra • Construction • Transport• Telcos
Janni ASMAN (62) 21 8066 8687 [email protected]
• Cigarette • Healthcare • Retail
Adhi TASMIN
Michael BENGSON Head of Research
(63) 2 849 8840
• Strategy • Utilities • Conglomerates • Telcos
Lovell SARREAL (63) 2 849 8841
• Consumer • Media • Cement
Rommel RODRIGO (63) 2 849 8839
• Conglomerates • Property • Gaming • Ports/ Logistics
Katherine TAN (63) 2 849 8843 [email protected]
• Banks • Construction
THAILAND
Maria LAPIZ Head of Institutional Research
Dir (66) 2257 0250 | (66) 2658 6300 ext 1399 [email protected]
• Strategy • Consumer • Materials • Ind. Estates
Sittichai DUANGRATTANACHAYA (66) 2658 6300 ext 1393 [email protected]
• Services Sector • Transport
Yupapan POLPORNPRASERT
• Banks & Diversified Financials
Vorapoj HONGPINYO (66) 2658 6300 ext 1392 [email protected]
• Real Estate & Contractors
Sukit UDOMSIRIKULHead of Retail Research
(66) 2658 6300 ext 5090
• Media • Commerce
Sutthichai KUMWORACHAI (66) 2658 6300 ext 1400 [email protected]
• Energy • Petrochem
Termporn TANTIVIVAT
• Transportation • Small cap
VIETNAM LE Hong Lien, ACCA Head of Institutional Research
(84) 8 44 555 888 x 8181 [email protected]
• Strategy • Consumer • Diversified • Utilities
THAI Quang Trung, CFA, Deputy Manager, Institutional Research
(84) 8 44 555 888 x 8180 [email protected]
• Real Estate • Construction • Materials
Le Nguyen Nhat Chuyen (84) 8 44 555 888 x 8082 [email protected]
• Oil & Gas
NGUYEN Thi Ngan Tuyen,Head of Retail Research
(84) 8 44 555 888 x 8081
• Food & Beverage • Oil&Gas • Banking
TRINH Thi Ngoc Diep (84) 4 44 555 888 x 8208 [email protected]
• Technology • Utilities • Construction
PHAM Nhat Bich (84) 8 44 555 888 x 8083 [email protected]
• Consumer • Manufacturing • Fishery
NGUYEN Thi Sony Tra Mi (84) 8 44 555 888 x 8084 [email protected]
• Port operation • Pharmaceutical • Food & Beverage
TRUONG Quang Binh (84) 4 44 555 888 x 8087 [email protected]
January 12, 2017
8APPENDIX I: TERMS FOR PROVISION OF REPORT, DISCLAIMERS AND DISCLOSURES
DISCLAIMERS
This research report is prepared for general circulation and for information purposes only and under no circumstances should it be considered or intended as an offer to sell or a solicitation of an offer to buy the securities referred to herein. Investors should note that values of such securities, if any, may fluctuate
and that each security’s price or value may rise or fall. Opinions or recommendations contained herein are in form of technical ratings and fundamental
ratings. Technical ratings may differ from fundamental ratings as technical valuations apply different methodologies and are purely based on price and volume-related information extracted from the relevant jurisdiction’s stock exchange in the equity analysis. Accordingly, investors’ returns may be less than the original sum invested. Past performance is not necessarily a guide to future performance. This report is not intended to provide personal investment advice and does not take into account the specific investment objectives, the financial situation and the particular needs of persons who may receive or read this report. Investors should therefore seek financial, legal and other advice regarding the appropriateness of investing in any securities or the investment strategies discussed or recommended in this report.
The information contained herein has been obtained from sources believed to be reliable but such sources have not been independently verified by Maybank
Investment Bank Berhad, its subsidiary and affiliates (collectively, “MKE”) and consequently no representation is made as to the accuracy or completeness of
this report by MKE and it should not be relied upon as such. Accordingly, MKE and its officers, directors, associates, connected parties and/or employees
(collectively, “Representatives”) shall not be liable for any direct, indirect or consequential losses or damages that may arise from the use or reliance of this
report. Any information, opinions or recommendations contained herein are subject to change at any time, without prior notice.
This report may contain forward looking statements which are often but not always identified by the use of words such as “anticipate”, “believe”, “estimate”, “intend”, “plan”, “expect”, “forecast”, “predict” and “project” and statements that an event or result “may”, “will”, “can”, “should”, “could” or “might”
occur or be achieved and other similar expressions. Such forward looking statements are based on assumptions made and information currently available to us and are subject to certain risks and uncertainties that could cause the actual results to differ materially from those expressed in any forward looking statements. Readers are cautioned not to place undue relevance on these forward-looking statements. MKE expressly disclaims any obligation to update or revise any such forward looking statements to reflect new information, events or circumstances after the date of this publication or to reflect the occurrence of unanticipated events.
MKE and its officers, directors and employees, including persons involved in the preparation or issuance of this report, may, to the extent permitted by law, from time to time participate or invest in financing transactions with the issuer(s) of the securities mentioned in this report, perform services for or solicit business from such issuers, and/or have a position or holding, or other material interest, or effect transactions, in such securities or options thereon, or other investments related thereto. In addition, it may make markets in the securities mentioned in the material presented in this report. One or more directors, officers and/or employees of MKE may be a director of the issuers of the securities mentioned in this report to the extent permitted by law.
This report is prepared for the use of MKE’s clients and may not be reproduced, altered in any way, transmitted to, copied or distributed to any other party in
whole or in part in any form or manner without the prior express written consent of MKE and MKE and its Representatives accepts no liability whatsoever for the actions of third parties in this respect.
This report is not directed to or intended for distribution to or use by any person or entity who is a citizen or resident of or located in any locality, state, country or other jurisdiction where such distribution, publication, availability or use would be contrary to law or regulation. This report is for distribution only under such circumstances as may be permitted by applicable law. The securities described herein may not be eligible for sale in all jurisdictions or to certain categories of investors. Without prejudice to the foregoing, the reader is to note that additional disclaimers, warnings or qualifications may apply based on geographical location of the person or entity receiving this report.
Malaysia
Opinions or recommendations contained herein are in the form of technical ratings and fundamental ratings. Technical ratings may differ from fundamental ratings as technical valuations apply different methodologies and are purely based on price and volume-related information extracted from Bursa Malaysia Securities Berhad in the equity analysis.
Singapore
This report has been produced as of the date hereof and the information herein may be subject to change. Maybank Kim Eng Research Pte. Ltd. (“Maybank
KERPL”) in Singapore has no obligation to update such information for any recipient. For distribution in Singapore, recipients of this report are to contact
Maybank KERPL in Singapore in respect of any matters arising from, or in connection with, this report. If the recipient of this report is not an accredited investor, expert investor or institutional investor (as defined under Section 4A of the Singapore Securities and Futures Act), Maybank KERPL shall be legally liable for the contents of this report, with such liability being limited to the extent (if any) as permitted by law.
Thailand
Except as specifically permitted, no part of this presentation may be reproduced or distributed in any manner without the prior written permission of Maybank Kim Eng Securities (Thailand) Public Company Limited. Maybank Kim Eng Securities (Thailand) Public Company Limited (“MBKET”) accepts no liability
whatsoever for the actions of third parties in this respect.
Due to different characteristics, objectives and strategies of institutional and retail investors, the research reports of MBKET Institutional and Retail Research Department may differ in either recommendation or target price, or both. MBKET Retail Research is intended for retail investors ( http://kelive.maybank-ke.co.th) while Maybank Kim Eng Institutional Research is intended only for institutional investors based outside Thailand only.
The disclosure of the survey result of the Thai Institute of Directors Association (“IOD”) regarding corporate governance is made pursuant to the policy of the
Office of the Securities and Exchange Commission. The survey of the IOD is based on the information of a company listed on the Stock Exchange of Thailand and the market for Alternative Investment disclosed to the public and able to be accessed by a general public investor. The result, therefore, is from the perspective of a third party. It is not an evaluation of operation and is not based on inside information. The survey result is as of the date appearing in the Corporate Governance Report of Thai Listed Companies. As a result, the survey may be changed after that date. MBKET does not confirm nor certify the accuracy of such survey result.
The disclosure of the Anti-Corruption Progress Indicators of a listed company on the Stock Exchange of Thailand, which is assessed by Thaipat Institute, is made in order to comply with the policy and sustainable development plan for the listed companies of the Office of the Securities and Exchange Commission. Thaipat Institute made this assessment based on the information received from the listed company, as stipulated in the form for the assessment of Anti-corruption which refers to the Annual Registration Statement (Form 56-1), Annual Report (Form 56-2), or other relevant documents or reports of such listed company. The assessment result is therefore made from the perspective of Thaipat Institute that is a third party. It is not an assessment of operation and is not based on any inside information. Since this assessment is only the assessment result as of the date appearing in the assessment result, it may be changed after that date or when there is any change to the relevant information. Nevertheless, MBKET does not confirm, verify, or certify the accuracy and completeness of the assessment result.
US
This third-party research report is distributed in the United States (“US”) to Major US Institutional Investors (as defined in Rule 15a-6 under the Securities
Exchange Act of 1934, as amended) only by Maybank Kim Eng Securities USA Inc (“Maybank KESUSA”), a broker-dealer registered in the US (registered under
January 12, 2017
9Disclosure of Interest
Malaysia: MKE and its Representatives may from time to time have positions or be materially interested in the securities referred to herein and may further act as market maker or may have assumed an underwriting commitment or deal with such securities and may also perform or seek to perform investment banking services, advisory and other services for or relating to those companies.
Singapore: As of 12 January 2017, Maybank KERPL and the covering analyst do not have any interest in any companies recommended in this research report.
Thailand: MBKET may have a business relationship with or may possibly be an issuer of derivative warrants on the securities /companies mentioned in the research report. Therefore, Investors should exercise their own judgment before making any investment decisions. MBKET, its associates, directors, connected parties and/or employees may from time to time have interests and/or underwriting commitments in the securities mentioned in this report.
Hong Kong: As of 12 January 2017, KESHK and the authoring analyst do not have any interest in any companies recommended in this research report.
India: As of 12 January 2017, and at the end of the month immediately preceding the date of publication of the research report, KESI, authoring analyst or their associate / relative does not hold any financial interest or any actual or beneficial ownership in any shares or having any conflict of interest in the subject companies except as otherwise disclosed in the research report.
In the past twelve months KESI and authoring analyst or their associate did not receive any compensation or other benefits from the subject companies or third party in connection with the research report on any account what so ever except as otherwise disclosed in the research report.
MKE may have, within the last three years, served as manager or co-manager of a public offering of securities for, or currently may make a primary market in issues of, any or all of the entities mentioned in this report or may be providing, or have provided within the previous 12 months, significant advice or investment services in relation to the investment concerned or a related investment and may receive compensation for the services provided from the companies covered in this report.
OTHERS
Analyst Certification of Independence
The views expressed in this research report accurately reflect the analyst’s personal views about any and all of the subject securities or issuers; and no part of
the research analyst’s compensation was, is or will be, directly or indirectly, related to the specific recommendations or views expressed in the report.
Reminder
Structured securities are complex instruments, typically involve a high degree of risk and are intended for sale only to sophisticated investors who are capable of understanding and assuming the risks involved. The market value of any structured security may be affected by changes in economic, financial and political factors (including, but not limited to, spot and forward interest and exchange rates), time to maturity, market conditions and volatility and the credit quality of any issuer or reference issuer. Any investor interested in purchasing a structured product should conduct its own analysis of the product and consult with its own professional advisers as to the risks involved in making such a purchase.
No part of this material may be copied, photocopied or duplicated in any form by any means or redistributed without the prior consent of MKE.
UK
This document is being distributed by Maybank Kim Eng Securities (London) Ltd (“Maybank KESL”) which is authorized and regulated, by the Financial Conduct
Authority and is for Informational Purposes only. This document is not intended for distribution to anyone defined as a Retail Client under the Financial Services and Markets Act 2000 within the UK. Any inclusion of a third party link is for the recipients convenience only, and that the firm does not take any responsibility for its comments or accuracy, and that access to such links is at the individuals own risk. Nothing in this report should be considered as constituting legal, accounting or tax advice, and that for accurate guidance recipients should consult with their own independent tax advisers.
DISCLOSURES
Legal Entities Disclosures
Malaysia: This report is issued and distributed in Malaysia by Maybank Investment Bank Berhad (15938- H) which is a Participating Organization of Bursa Malaysia Berhad and a holder of Capital Markets and Services License issued by the Securities Commission in Malaysia. Singapore: This report is distributed in Singapore by Maybank KERPL (Co. Reg No 198700034E) which is regulated by the Monetary Authority of Singapore. Indonesia: PT Maybank Kim Eng Securities
(“PTMKES”) (Reg. No. KEP-251/PM/1992) is a member of the Indonesia Stock Exchange and is regulated by the Financial Services Authority (Indonesia).
Thailand: MBKET (Reg. No.0107545000314) is a member of the Stock Exchange of Thailand and is regulated by the Ministry of Finance and the Securities and Exchange Commission. Philippines: Maybank ATRKES (Reg. No.01-2004-00019) is a member of the Philippines Stock Exchange and is regulated by the Securities and Exchange Commission. Vietnam: Maybank Kim Eng Securities Limited (License Number: 117/GP-UBCK) is licensed under the State Securities Commission of Vietnam. Hong Kong: KESHK (Central Entity No AAD284) is regulated by the Securities and Futures Commission. India: Kim Eng Securities India Private Limited
(“KESI”) is a participant of the National Stock Exchange of India Limited and the Bombay Stock Exchange and is regulated by Securities and Exchange Board of
India (“SEBI”) (Reg. No. INZ000010538). KESI is also registered with SEBI as Category 1 Merchant Banker (Reg. No. INM 000011708) and as Research Analyst (Reg
January 12, 2017
10Historical recommendations and target price: Tunas Baru Lampung (TBLA IJ)
Definition of Ratings
Maybank Kim Eng Research uses the following rating system
BUY Return is expected to be above 10% in the next 12 months (excluding dividends)
HOLD Return is expected to be between - 10% to +10% in the next 12 months (excluding dividends)
SELL Return is expected to be below -10% in the next 12 months (excluding dividends)
Applicability of Ratings
The respective analyst maintains a coverage universe of stocks, the list of which may be adjusted according to needs. Investment ratings are only applicable to the stocks which form part of the coverage universe. Reports on companies which are not part of the coverage do not carry investment ratings as we do not actively follow developments in these companies.
400.0 600.0 800.0 1,000.0 1,200.0
Jul-15 Oct-15 Jan-16 Apr-16 Jul-16 Oct-16 Jan-17
Tunas Baru Lampung
January 12, 2017
11
Malaysia
Maybank Investment Bank Berhad
(A Participating Organisation of Bursa Malaysia Securities Berhad) 33rd Floor, Menara Maybank, 100 Jalan Tun Perak, 50050 Kuala Lumpur Tel: (603) 2059 1888; Fax: (603) 2078 4194
Singapore
Maybank Kim Eng Securities Pte Ltd Maybank Kim Eng Research Pte Ltd
50 North Canal Road Singapore 059304
Tel: (65) 6336 9090
London
Maybank Kim Eng Securities (London) Ltd
PNB House
77 Queen Victoria Street London EC4V 4AY, UK
Tel: (44) 20 7332 0221 Fax: (44) 20 7332 0302
New York
Maybank Kim Eng Securities USA Inc
777 Third Avenue, 21st Floor New York, NY 10017, U.S.A.
Tel: (212) 688 8886 Fax: (212) 688 3500
Stockbroking Business:Level 8, Tower C, Dataran Maybank, No.1, Jalan Maarof
59000 Kuala Lumpur Tel: (603) 2297 8888 Fax: (603) 2282 5136
Hong Kong
Kim Eng Securities (HK) Ltd
Level 30, Three Pacific Place,
1 Queen’s Road East,
Hong Kong
Tel: (852) 2268 0800 Fax: (852) 2877 0104
Indonesia
PT Maybank Kim Eng Securities
Sentral Senayan III, 22nd Floor
Jl. Asia Afrika No. 8 Gelora Bung Karno, Senayan Jakarta 10270, Indonesia
Tel: (62) 21 8066 8500 Fax: (62) 21 8066 8501
India
Kim Eng Securities India Pvt Ltd
2nd Floor, The International, 16, Maharishi Karve Road, Churchgate Station, Mumbai City - 400 020, India
Tel: (91) 22 6623 2600 Fax: (91) 22 6623 2604
Philippines
Maybank ATR Kim Eng Securities Inc.
17/F, Tower One & Exchange Plaza Ayala Triangle, Ayala Avenue Makati City, Philippines 1200
Tel: (63) 2 849 8888 Fax: (63) 2 848 5738
Thailand
Maybank Kim Eng Securities (Thailand) Public Company Limited
999/9 The Offices at Central World, 20th - 21st Floor,
Rama 1 Road Pathumwan, Bangkok 10330, Thailand
Tel: (66) 2 658 6817 (sales) Tel: (66) 2 658 6801 (research)
Vietnam
Maybank Kim Eng Securities Limited
4A-15+16 Floor Vincom Center Dong Khoi, 72 Le Thanh Ton St. District 1 Ho Chi Minh City, Vietnam
Tel : (84) 844 555 888 Fax : (84) 8 38 271 030
Saudi Arabia
In association with Anfaal Capital
Villa 47, Tujjar Jeddah Prince Mohammed bin Abdulaziz Street P.O. Box 126575 Jeddah 21352
Tel: (966) 2 6068686 Fax: (966) 26068787
South Asia Sales Trading
Kevin Foy
Regional Head Sales Trading [email protected] Tel: (65) 6636-3620 US Toll Free: 1-866-406-7447
North Asia Sales Trading
Andrew Lee
[email protected] Tel: (852) 2268 0283 US Toll Free: 1 877 837 7635
Tel:(66)2 658 6820
Indonesia Tel: (84)-8-44-555-888 x8080
Philippines
Keith Roy
[email protected] Tel:(63) 2 848-5288
www.maybank-ke.com | www.maybank-keresearch.com