84
CHAPTER V
CONCLUSION
This chapter provides the conclusion, limitations and suggestion for
further research. The purpose of this study is to examine the systematic relation
between Corporate Social Responsibility (CSR) and Corporate Financial
Performance (CFP) proxied with financial ratios such as Return on Assets (ROA),
Return on Equity (ROE) and Price to Book Value (PBV).
5.1
Conclusion
Based on the data collected and the results of hypothesis testing using
multiple regression, then it can be concluded as follows:
1.
CSR has positive influence on ROA with significant value 0.001. CSR
has positive beta coefficient of 0.821. This means that CSR have positive
influence on the financial performance of companies proxied by the ROA
with autocorrelation in region of ignorance.
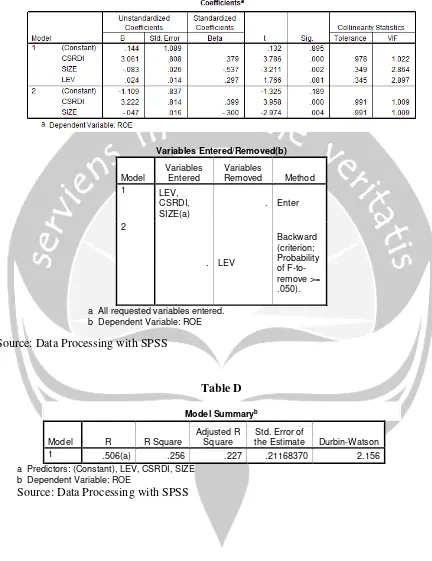
2.
CSR has positive influence on ROE with significant value 0.000. CSR
has positive beta coefficient of 3.222. This means that CSR have positive
influence on the financial performance of companies proxied by the
85
3.
CSR has positive influence on PBV with significant value 0.002. CSR
has positive beta coefficient of 24.514. This means that CSR have
positive influence on the financial performance of companies proxied by
the PBV.
4.
SIZE as control variable has negative significant influence on ROA, ROE
and PBV. It means that the higher the SIZE will contribute negative
influence of ROA, ROE and PBV or the lower the ROA, ROE and PBV.
5.
LEV as control variable has negative significant influence on ROA. It
means that the higher the LEV will contribute negative influence of ROA
or the lower the ROA.
5.2
Managerial Implication
The implementation of CSR in Indonesia today has been growing
rapidly. Companies began to give serious attention to the implementation and
reporting of CSR. It aims to motivate companies to be more aware of the essence
and significance of CSR to the company's financial performance. This study has
several managerial implication include:
1.
For Management of Companies
This study’s finding give new insights about CSR to the firm’s CEO and
encourage them to engage in various CSR activities as a business
86
able to create customer loyalty in the longterm. This may also improve
earnings and market value of companies which are represented by a
strong financial performance.
Firm's CEO must change the paradigm that CSR programs is a burdening
expense of the company. CSR programs should utilized seriously as an
integral part of business strategy and management policy of the company.
The expenditure for used for CSR programs should not be considered as
a burdening cost, but a promising long-term investment.
2.
For Investors
This study's finding also give new insights about CSR to the investors
about selected companies listed in SRI KEHATI Index. Companies that
meet the criteria of SRI KEHATI Index is a profitable company but
remains concerned to the biodiversity and sustainable development.
5.3
Research Limitation and Suggestion for Further Research
5.3.1
Research Limitation
This study has several limitations include:
1. The results of this study show that there is autocorrelation problem in the
relation of CSR to CFP proxied with ROA. This model can not be said as
87
2. There are other dependent variables outside Return on Asset (ROA),
Return on Equity (ROE) and Price to Book Value (PBV) that can be used
to test the influence of corporate social responsibility (CSR) to corporate
financial performance (CFP).
3.
Researcher took the PBV data from ICMD. The PBV data of TLKM year
2013 and 2014 must be times by 5 because the existence of stock split
approved by the shareholders is 1:5.
5.3.2
Suggestion for Further Research
Based on the conclusion, some suggestions for future research include:
1.
The researcher suggest to fix the problem of autocorrelation problem by
add the number of sample or processed with non linear regression model
to gain better observation result. It is necessary to conduct more research
on the development of a comprehensive corporate social responsibiity
(CSR) measure in the relation with corporate financial performance
(CFP).
2.
Further research is expected to use other financial performance proxy in
predicting the effects of CSR on the corporate financial performance to
gain more comprehensive study. Other financial performance includes
Return on Sales (ROS), Economic Value Added (EVA), Market Value
88
REFERENCES
Ahmed, S.U., Islam, Z.M., Hasan, I. (2012), Corporate social responsibility and
financial performance linkage evidence from the banking sector
Bangladesh.
Journal of Organizational Management,
1(1), 14-21.
Al-Tuwaijri, S.A., Christensen,T.E. a
nd Hughes, K.E. II (2004), “The relations
among environmental disclosure, environmental performance, and
economic performance: a simultaneous equations approach”,
Accounting, Organizations and Society, Vol. 29, pp. 447-71.
Aupperle, K. E., A. B. Carroll a
nd J. D. Hatfield: 1985, “An Empirical
Examination of the Relationship between Corporate Social
Re
sponsibility and Profitability,”
Academy of Management Journal
28(2), pp. 446-463.
Balbanis, George., Hugh C. Phillips, dan Jonathan Lyall. 1998. "Corporate Social
Responsibility & Economic Performance in the Top British Companies
: Are They Linked?" European Business Review. Vol. 98, No.1, 1998,
pp. 25- 44
Bidhari, S.C., Salim, U., Aisjah, S. (2013), Effect of corporatesocial responsibility
information disclosure on financial performance and firm value in
banking industry listed at Indonesia stock exchange. European Journal
of Business and Management, 5, 39-46.
Cochran, P.L. and Wood, R.A. (1984), “Corporate social responsibility and
financial performance”,
Academy of Management Journal, Vol. 27
No.
1, pp. 42-56.
Ghozali, Imam. 2011.
Aplikasi Analisis Multivariate dengan Program IBM SPSS
19. 5th edition, Semarang : Badan Penerbit Undip.
Griffin, J.J. and Mahon, J.F. (1997), “The corporate social performance
and
corporate financial performance debate: twenty-five years of
incomparable research”,
Business and Society,
Vol. 36 No. 1, pp. 5-31.
Herremans, I. M., P. Akathaporn and M. McInnes: 1993, “An Investigation of
Corporate
Social
Responsibility
Reputation
and
Economic
Performance”,
Accounting, Organization and Society 18
(7-8), pp.
587-604.
89
Jensen, M dan W, Meckling. 1976. Theory of the Firm: Managerial
Behaviour, Agency, and Ownership Structure.
Journal of Financial
Economic:
305-360.
J. Chung: 2004, “The Relationship between Firm Environmental Performance and
Financial Performance”,
Korean Management Journal 33
(5), pp.
1461-1487.
Karagiorgos, Theofanis. 2010. “Corporate Social Responsibility and Financial
Performance : An Empirical Analysis on Greek Companies”.
European
Research Studies. Volume XIII, Issue (4), 2010, pp 85-107.
Kotler, Philip. 2007. Doing the Most Good for Your Company and Your Cause.
Thomas Dunne Books New York.
Kuncoro, Mudrajad. 2013.
Metode Riset Untuk Bisnis dan Ekonomi. 4th edition,
Erlangga.
Laan, G.V., Ees, H.V. and Witteloostuijn, A.V. (2008), “Corporate social and
financial performance: an extended stakeholder theory, and empirical
test with accounting measures”,
Journal of Business Ethics,
Vol. 79, pp.
299-310.
Lee, K. J. and M. Kang: 2012, “The Association between the Firm’s Social
Performance and Its Financial Performance: Evidence from Korean
Firms”,
Pan-Pacific Journal of Business Research
3(2), pp. 59-75.
Lindenberg, E. and Ross, S. (1981), “Tobin’s q ratio and industrial organization”,
Journal of Business,
Vol. 54 No. 1, pp. 1-32
McGuire, J. B., T. Schneeweiss and A. Sund
gren: 1988, “Corporate Social
Responsibility
and
Financial
Performance:
Correlation
and
Misspecification”,
Strategic Management Journal 21,
pp. 603-609.
Park, H. J., I. Kwon, H. Shin and
McGuire, J., Sundgren, A. and Schneeweis, T. (1988), “Corporate soc
ial
responsibility and firm financial performance”,
Academy of
Management Journal,
Vol. 31 No. 4, pp. 854-72.
Munawir, S., (2008),
Analisis Informasi Keuangan,
First Edition, Liberty
Yogyakarta.
90
2007
–
2010). Dipenegoro Journal of Management Volume 1 Nomor 1
Tahun 2012 Halaman 1
–
9 .
oss Westerfield Jeff. 2010.
Corporate
Finance 9th Edition.
Irwin, McGraw-Hill.
OECD. 2004. “
OECD Principles of Corporate Governance
.”
Prastowo, Joko., and Huda, Miftachul., (2011),
Corporate Social Responsibility
Kunci Meraih Kemuliaan Bisnis.
First Edition, Samudra Biru,
Yogyakarta.
Resturiyani, N. (2012), Influence of Corporate Social Responsibility Disclosure
Of Financial Performance (Study on Mining Company Listed in
Indonesia Stock Exchange in 2011). Bandung: Faculty of Economics
Universtas Pasundan.
Robert Jao and Gagaring Pagalung. 2011.
Corporate Governance, Ukuran
Perusahaan dan Leverage terhadap Manajemen Laba Perusahaan
Manufaktur Indonesia.
Accountancy and Auditing Journal, Vol. 8/No.
1/November 2011:1-94.
Ross Westerfield Jeff. 2010. Corporate Finance 9th Edition.
Irwin, McGraw-Hill
Sekaran Uma. 2006.
Metodologi
Penelitian
Bisnis
. Erlangga, Jakarta
Sembiring, Edy Rismanda., (2005),
Karakteristik Perusahaan dan Pengungkapan
Tanggung Jawab Sosial: Studi Empiris pada Perusahaan yang Tercatat
di Bursa Efek Jakarta.
National Simposium of Accountant VIII, Solo.
Solihin, Ismail., (2009),
Corporate Social Responsibility: From Charity to
Sustainability,
Salemba Empat, Jakarta.
Subramanyam, K.R Wild, John and Robert F. Halsey. 2005.
Analisis
Laporan Keuanga
n. Eight Edition. Second Book. Jakarta: Salemba
Empat
Sugiono. 2005.
Metologi Penelitian (Teori
dan Aplikasi dalam Penelitian
Sosial).
Gramedia Pustaka, Jakarta.
Yaparto, M., Frisko, K.D., Eriandani, R. (2013), Influence of Corporate Social
Responsibility Financial Performance Against SektorManufaktur
Registered In Indonesia Stock Exchange Period 2010-2011 On. Student
Scientific journal Universitas Surabaya, 2(1), 1-19.
91
92
APPENDIX A
ROA, ROE, PBV, CSRDI, SIZE AND LEV DURING 2010-2014
Year Code ROA ROE PBV CSRDI SIZE LEV
2010
AALI 0.34108 0.28210 5.53000 0.948718 29.80484 0.18000 ANTM 0.16111 0.17600 2.44000 0.897436 30.13400 0.27000 ASII 0.12989 0.29400 3.76000 0.910256 32.36161 0.93000 BBCA 0.03206 0.25770 4.57000 0.897436 33.41306 8.51156 BDMN 0.03911 0.18190 2.59000 0.897436 32.40502 5.38955 BBNI 0.02216 0.14100 2.18000 0.871795 33.14679 6.49876 BBRI 0.03560 0.31520 3.53000 0.858974 33.63367 10.02403 BMRI 0.03055 0.22520 3.24000 0.897436 33.73977 9.69109 INDF 0.14234 0.16160 1.72000 0.923077 31.48702 0.90000 KLBF 0.25466 0.23320 5.72000 0.923077 29.58156 0.22000 PGAS 0.28160 0.41320 7.10000 0.923077 31.09949 1.12000 PTBA 0.26429 0.31190 8.22000 0.846154 29.79646 0.35000 TLKM 0.22263 0.28190 2.84000 0.884615 32.24119 0.78000 TINS 0.22288 0.22420 3.29000 0.923077 29.40277 0.40000 UNVR 0.52207 0.83600 31.09000 0.897436 29.79449 1.15000 UNTR 0.17382 0.24280 4.90000 0.897436 31.02220 0.84000
2011
AALI 0.31259 0.29650 4.06000 0.935897 29.95385 0.21000 ANTM 0.13242 0.17870 1.43000 0.871795 30.35240 0.41000 ASII 0.11555 0.28150 3.95000 0.884615 32.67004 1.03000 BBCA 0.03482 0.25630 4.64000 0.884615 33.57620 8.08714 BDMN 0.03637 0.12940 1.53000 0.897436 32.58890 4.53460 BBNI 0.02422 0.15830 1.87000 0.884615 33.33166 6.90259 BBRI 0.03742 0.30700 1.67000 0.871795 33.78354 8.43187 BMRI 0.02962 0.19920 2.51000 0.884615 33.94437 7.80850 INDF 0.12538 0.15870 1.28000 0.910256 31.61231 0.70000 KLBF 0.23475 0.23630 5.30000 0.910256 29.74421 0.27000 PGAS 0.25058 0.35870 4.48000 0.884615 31.05911 0.80000 PTBA 0.32502 0.37830 4.90000 0.858974 30.07426 0.41000 TLKM 0.20652 0.25390 2.33000 0.858974 32.26627 0.69000 TINS 0.20315 0.19510 1.83000 0.884615 29.51351 0.43000 UNVR 0.52044 1.13130 38.97000 0.910256 29.98071 1.85000 UNTR 0.15488 0.21320 3.57000 0.910256 31.49049 0.69000
2012
93
BMRI 0.03088 0.21460 2.49000 0.897436 34.08562 6.85735 INDF 0.11581 0.14270 1.50000 0.897436 31.71514 0.74000 KLBF 0.23362 0.24040 7.30000 0.910256 29.87364 0.28000 PGAS 0.26060 0.38840 6.72000 0.897436 31.26312 0.66000 PTBA 0.28231 0.26680 4.09000 0.884615 30.17490 0.50000 TLKM 0.22718 0.27450 2.72000 0.871795 32.34387 0.66000 TINS 0.10669 0.09560 1.70000 0.846154 29.43947 0.34000 UNVR 0.53857 1.21940 40.09000 0.923077 30.11468 1.94000 UNTR 0.14467 0.18140 2.27000 0.871795 31.54904 0.56000
2013
AALI 0.19596 0.18860 3.85000 0.884615 30.33661 0.46000 ANTM 0.01926 0.03210 0.81000 0.858974 30.71591 0.71000 ASII 0.12126 0.22330 2.59000 0.923077 32.99697 1.02000 BBCA 0.03571 0.20330 3.70000 0.923077 33.83821 6.73622 BDMN 0.03042 0.12920 1.15000 0.897436 32.84725 4.83898 BBNI 0.02902 0.13090 1.54000 0.910256 33.58855 6.90917 BBRI 0.04173 0.25110 2.25000 0.910256 34.07066 6.89365 BMRI 0.03213 0.20270 2.06000 0.910256 34.22830 6.72070 INDF 0.07826 0.12920 1.53000 0.884615 31.98892 1.05000 KLBF 0.22274 0.23580 6.89000 0.897436 30.05716 0.33000 PGAS 0.21399 0.31150 5.76000 0.871795 31.61138 0.62000 PTBA 0.18436 0.31140 3.11000 0.858974 30.08866 0.55000 TLKM 0.20317 0.26350 2.80000 0.846154 32.48267 0.65000 TINS 0.10517 0.11050 1.53000 0.820513 29.69577 0.57000 UNVR 0.53354 1.25810 46.63000 0.935897 30.22240 1.99000 UNTR 0.11024 0.17540 1.99000 0.858974 31.68041 0.61000
2014
94
APPENDIX B
MODEL I DATA BEFORE TRIMMING
Year Code ROA CSRDI SIZE LEV
2010
AALI 0.34108 0.948718 29.80484 0.18000 ANTM 0.16111 0.897436 30.13400 0.27000 ASII 0.12989 0.910256 32.36161 0.93000 BBCA 0.03206 0.897436 33.41306 8.51156 BDMN 0.03911 0.897436 32.40502 5.38955 BBNI 0.02216 0.871795 33.14679 6.49876 BBRI 0.03560 0.858974 33.63367 10.02403 BMRI 0.03055 0.897436 33.73977 9.69109 INDF 0.14234 0.923077 31.48702 0.90000 KLBF 0.25466 0.923077 29.58156 0.22000 PGAS 0.28160 0.923077 31.09949 1.12000 PTBA 0.26429 0.846154 29.79646 0.35000 TLKM 0.22263 0.884615 32.24119 0.78000 TINS 0.22288 0.923077 29.40277 0.40000 UNVR 0.52207 0.897436 29.79449 1.15000 UNTR 0.17382 0.897436 31.02220 0.84000
2011
AALI 0.31259 0.935897 29.95385 0.21000 ANTM 0.13242 0.871795 30.35240 0.41000 ASII 0.11555 0.884615 32.67004 1.03000 BBCA 0.03482 0.884615 33.57620 8.08714 BDMN 0.03637 0.897436 32.58890 4.53460 BBNI 0.02422 0.884615 33.33166 6.90259 BBRI 0.03742 0.871795 33.78354 8.43187 BMRI 0.02962 0.884615 33.94437 7.80850 INDF 0.12538 0.910256 31.61231 0.70000 KLBF 0.23475 0.910256 29.74421 0.27000 PGAS 0.25058 0.884615 31.05911 0.80000 PTBA 0.32502 0.858974 30.07426 0.41000 TLKM 0.20652 0.858974 32.26627 0.69000 TINS 0.20315 0.884615 29.51351 0.43000 UNVR 0.52044 0.910256 29.98071 1.85000 UNTR 0.15488 0.910256 31.49049 0.69000
2012
95
BMRI 0.03088 0.897436 34.08562 6.85735 INDF 0.11581 0.897436 31.71514 0.74000 KLBF 0.23362 0.910256 29.87364 0.28000 PGAS 0.26060 0.897436 31.26312 0.66000 PTBA 0.28231 0.884615 30.17490 0.50000 TLKM 0.22718 0.871795 32.34387 0.66000 TINS 0.10669 0.846154 29.43947 0.34000 UNVR 0.53857 0.923077 30.11468 1.94000 UNTR 0.14467 0.871795 31.54904 0.56000
2013
AALI 0.19596 0.884615 30.33661 0.46000 ANTM 0.01926 0.858974 30.71591 0.71000 ASII 0.12126 0.923077 32.99697 1.02000 BBCA 0.03571 0.923077 33.83821 6.73622 BDMN 0.03042 0.897436 32.84725 4.83898 BBNI 0.02902 0.910256 33.58855 6.90917 BBRI 0.04173 0.910256 34.07066 6.89365 BMRI 0.03213 0.910256 34.22830 6.72070 INDF 0.07826 0.884615 31.98892 1.05000 KLBF 0.22274 0.897436 30.05716 0.33000 PGAS 0.21399 0.871795 31.61138 0.62000 PTBA 0.18436 0.858974 30.08866 0.55000 TLKM 0.20317 0.846154 32.48267 0.65000 TINS 0.10517 0.820513 29.69577 0.57000 UNVR 0.53354 0.935897 30.22240 1.99000 UNTR 0.11024 0.858974 31.68041 0.61000
2014
96
APPENDIX C
MODEL I DATA AFTER TRIMMING
Year Code ROA CSRDI SIZE LEV
2010
AALI 0.34108 0.948718 29.80484 0.18000 ANTM 0.16111 0.897436 30.13400 0.27000 ASII 0.12989 0.910256 32.36161 0.93000 BBCA 0.03206 0.897436 33.41306 8.51156 BDMN 0.03911 0.897436 32.40502 5.38955 BBNI 0.02216 0.871795 33.14679 6.49876 BBRI 0.03560 0.858974 33.63367 10.02403 BMRI 0.03055 0.897436 33.73977 9.69109 INDF 0.14234 0.923077 31.48702 0.90000 KLBF 0.25466 0.923077 29.58156 0.22000 PGAS 0.28160 0.923077 31.09949 1.12000 PTBA 0.26429 0.846154 29.79646 0.35000 TLKM 0.22263 0.884615 32.24119 0.78000 TINS 0.22288 0.923077 29.40277 0.40000 UNTR 0.17382 0.897436 31.02220 0.84000
2011
AALI 0.31259 0.935897 29.95385 0.21000 ANTM 0.13242 0.871795 30.35240 0.41000 ASII 0.11555 0.884615 32.67004 1.03000 BBCA 0.03482 0.884615 33.57620 8.08714 BDMN 0.03637 0.897436 32.58890 4.53460 BBNI 0.02422 0.884615 33.33166 6.90259 BBRI 0.03742 0.871795 33.78354 8.43187 BMRI 0.02962 0.884615 33.94437 7.80850 INDF 0.12538 0.910256 31.61231 0.70000 KLBF 0.23475 0.910256 29.74421 0.27000 PGAS 0.25058 0.884615 31.05911 0.80000 PTBA 0.32502 0.858974 30.07426 0.41000 TLKM 0.20652 0.858974 32.26627 0.69000 TINS 0.20315 0.884615 29.51351 0.43000 UNTR 0.15488 0.910256 31.49049 0.69000
2012
97
KLBF 0.23362 0.910256 29.87364 0.28000 PGAS 0.26060 0.897436 31.26312 0.66000 PTBA 0.28231 0.884615 30.17490 0.50000 TLKM 0.22718 0.871795 32.34387 0.66000 TINS 0.10669 0.846154 29.43947 0.34000 UNTR 0.14467 0.871795 31.54904 0.56000
2013
AALI 0.19596 0.884615 30.33661 0.46000 ANTM 0.01926 0.858974 30.71591 0.71000 ASII 0.12126 0.923077 32.99697 1.02000 BBCA 0.03571 0.923077 33.83821 6.73622 BDMN 0.03042 0.897436 32.84725 4.83898 BBNI 0.02902 0.910256 33.58855 6.90917 BBRI 0.04173 0.910256 34.07066 6.89365 BMRI 0.03213 0.910256 34.22830 6.72070 INDF 0.07826 0.884615 31.98892 1.05000 KLBF 0.22274 0.897436 30.05716 0.33000 PGAS 0.21399 0.871795 31.61138 0.62000 PTBA 0.18436 0.858974 30.08866 0.55000 TLKM 0.20317 0.846154 32.48267 0.65000 TINS 0.10517 0.820513 29.69577 0.57000 UNTR 0.11024 0.858974 31.68041 0.61000
2014
98
APPENDIX D
MODEL II DATA
Year Code ROE CSRDI SIZE LEV
2010
AALI 0.28210 0.948718 29.80484 0.18000 ANTM 0.17600 0.897436 30.13400 0.27000 ASII 0.29400 0.910256 32.36161 0.93000 BBCA 0.25770 0.897436 33.41306 8.51156 BDMN 0.18190 0.897436 32.40502 5.38955 BBNI 0.14100 0.871795 33.14679 6.49876 BBRI 0.31520 0.858974 33.63367 10.02403 BMRI 0.22520 0.897436 33.73977 9.69109 INDF 0.16160 0.923077 31.48702 0.90000 KLBF 0.23320 0.923077 29.58156 0.22000 PGAS 0.41320 0.923077 31.09949 1.12000 PTBA 0.31190 0.846154 29.79646 0.35000 TLKM 0.28190 0.884615 32.24119 0.78000 TINS 0.22420 0.923077 29.40277 0.40000 UNVR 0.83600 0.897436 29.79449 1.15000 UNTR 0.24280 0.897436 31.02220 0.84000
2011
AALI 0.29650 0.935897 29.95385 0.21000 ANTM 0.17870 0.871795 30.35240 0.41000 ASII 0.28150 0.884615 32.67004 1.03000 BBCA 0.25630 0.884615 33.57620 8.08714 BDMN 0.12940 0.897436 32.58890 4.53460 BBNI 0.15830 0.884615 33.33166 6.90259 BBRI 0.30700 0.871795 33.78354 8.43187 BMRI 0.19920 0.884615 33.94437 7.80850 INDF 0.15870 0.910256 31.61231 0.70000 KLBF 0.23630 0.910256 29.74421 0.27000 PGAS 0.35870 0.884615 31.05911 0.80000 PTBA 0.37830 0.858974 30.07426 0.41000 TLKM 0.25390 0.858974 32.26627 0.69000 TINS 0.19510 0.884615 29.51351 0.43000 UNVR 1.13130 0.910256 29.98071 1.85000 UNTR 0.21320 0.910256 31.49049 0.69000
2012
99
BMRI 0.21460 0.897436 34.08562 6.85735 INDF 0.14270 0.897436 31.71514 0.74000 KLBF 0.24040 0.910256 29.87364 0.28000 PGAS 0.38840 0.897436 31.26312 0.66000 PTBA 0.26680 0.884615 30.17490 0.50000 TLKM 0.27450 0.871795 32.34387 0.66000 TINS 0.09560 0.846154 29.43947 0.34000 UNVR 1.21940 0.923077 30.11468 1.94000 UNTR 0.18140 0.871795 31.54904 0.56000
2013
AALI 0.18860 0.884615 30.33661 0.46000 ANTM 0.03210 0.858974 30.71591 0.71000 ASII 0.22330 0.923077 32.99697 1.02000 BBCA 0.20330 0.923077 33.83821 6.73622 BDMN 0.12920 0.897436 32.84725 4.83898 BBNI 0.13090 0.910256 33.58855 6.90917 BBRI 0.25110 0.910256 34.07066 6.89365 BMRI 0.20270 0.910256 34.22830 6.72070 INDF 0.12920 0.884615 31.98892 1.05000 KLBF 0.23580 0.897436 30.05716 0.33000 PGAS 0.31150 0.871795 31.61138 0.62000 PTBA 0.31140 0.858974 30.08866 0.55000 TLKM 0.26350 0.846154 32.48267 0.65000 TINS 0.11050 0.820513 29.69577 0.57000 UNVR 1.25810 0.935897 30.22240 1.99000 UNTR 0.17540 0.858974 31.68041 0.61000
2014
100
APPENDIX E
MODEL III DATA BEFORE TRIMMING
Year Code PBV CSRDI SIZE LEV
2010
AALI 5.53000 0.948718 29.80484 0.18000 ANTM 2.44000 0.897436 30.13400 0.27000 ASII 3.76000 0.910256 32.36161 0.93000 BBCA 4.57000 0.897436 33.41306 8.51156 BDMN 2.59000 0.897436 32.40502 5.38955 BBNI 2.18000 0.871795 33.14679 6.49876 BBRI 3.53000 0.858974 33.63367 10.02403 BMRI 3.24000 0.897436 33.73977 9.69109 INDF 1.72000 0.923077 31.48702 0.90000 KLBF 5.72000 0.923077 29.58156 0.22000 PGAS 7.10000 0.923077 31.09949 1.12000 PTBA 8.22000 0.846154 29.79646 0.35000 TLKM 2.84000 0.884615 32.24119 0.78000 TINS 3.29000 0.923077 29.40277 0.40000 UNVR 31.09000 0.897436 29.79449 1.15000 UNTR 4.90000 0.897436 31.02220 0.84000
2011
AALI 4.06000 0.935897 29.95385 0.21000 ANTM 1.43000 0.871795 30.35240 0.41000 ASII 3.95000 0.884615 32.67004 1.03000 BBCA 4.64000 0.884615 33.57620 8.08714 BDMN 1.53000 0.897436 32.58890 4.53460 BBNI 1.87000 0.884615 33.33166 6.90259 BBRI 1.67000 0.871795 33.78354 8.43187 BMRI 2.51000 0.884615 33.94437 7.80850 INDF 1.28000 0.910256 31.61231 0.70000 KLBF 5.30000 0.910256 29.74421 0.27000 PGAS 4.48000 0.884615 31.05911 0.80000 PTBA 4.90000 0.858974 30.07426 0.41000 TLKM 2.33000 0.858974 32.26627 0.69000 TINS 1.83000 0.884615 29.51351 0.43000 UNVR 38.97000 0.910256 29.98071 1.85000 UNTR 3.57000 0.910256 31.49049 0.69000
2012
101
BMRI 2.49000 0.897436 34.08562 6.85735 INDF 1.50000 0.897436 31.71514 0.74000 KLBF 7.30000 0.910256 29.87364 0.28000 PGAS 6.72000 0.897436 31.26312 0.66000 PTBA 4.09000 0.884615 30.17490 0.50000 TLKM 2.72000 0.871795 32.34387 0.66000 TINS 1.70000 0.846154 29.43947 0.34000 UNVR 40.09000 0.923077 30.11468 1.94000 UNTR 2.27000 0.871795 31.54904 0.56000
2013
AALI 3.85000 0.884615 30.33661 0.46000 ANTM 0.81000 0.858974 30.71591 0.71000 ASII 2.59000 0.923077 32.99697 1.02000 BBCA 3.70000 0.923077 33.83821 6.73622 BDMN 1.15000 0.897436 32.84725 4.83898 BBNI 1.54000 0.910256 33.58855 6.90917 BBRI 2.25000 0.910256 34.07066 6.89365 BMRI 2.06000 0.910256 34.22830 6.72070 INDF 1.53000 0.884615 31.98892 1.05000 KLBF 6.89000 0.897436 30.05716 0.33000 PGAS 5.76000 0.871795 31.61138 0.62000 PTBA 3.11000 0.858974 30.08866 0.55000 TLKM 2.80000 0.846154 32.48267 0.65000 TINS 1.53000 0.820513 29.69577 0.57000 UNVR 46.63000 0.935897 30.22240 1.99000 UNTR 1.99000 0.858974 31.68041 0.61000
2014
102
APPENDIX F
MODEL III AFTER TRIMMING
Year Code PBV CSRDI SIZE LEV
2010
ANTM 2.44000 0.897436 30.13400 0.27000 ASII 3.76000 0.910256 32.36161 0.93000 BBCA 4.57000 0.897436 33.41306 8.51156 BDMN 2.59000 0.897436 32.40502 5.38955 BBNI 2.18000 0.871795 33.14679 6.49876 BBRI 3.53000 0.858974 33.63367 10.02403 BMRI 3.24000 0.897436 33.73977 9.69109 INDF 1.72000 0.923077 31.48702 0.90000 KLBF 5.72000 0.923077 29.58156 0.22000 PGAS 7.10000 0.923077 31.09949 1.12000 PTBA 8.22000 0.846154 29.79646 0.35000 TLKM 2.84000 0.884615 32.24119 0.78000 UNTR 4.90000 0.897436 31.02220 0.84000
2011
ANTM 1.43000 0.871795 30.35240 0.41000 ASII 3.95000 0.884615 32.67004 1.03000 BBCA 4.64000 0.884615 33.57620 8.08714 BDMN 1.53000 0.897436 32.58890 4.53460 BBNI 1.87000 0.884615 33.33166 6.90259 BBRI 1.67000 0.871795 33.78354 8.43187 BMRI 2.51000 0.884615 33.94437 7.80850 INDF 1.28000 0.910256 31.61231 0.70000 KLBF 5.30000 0.910256 29.74421 0.27000 PGAS 4.48000 0.884615 31.05911 0.80000 PTBA 4.90000 0.858974 30.07426 0.41000 TLKM 2.33000 0.858974 32.26627 0.69000 TINS 1.83000 0.884615 29.51351 0.43000 UNTR 3.57000 0.910256 31.49049 0.69000
2012
103
TLKM 2.72000 0.871795 32.34387 0.66000 TINS 1.70000 0.846154 29.43947 0.34000 UNTR 2.27000 0.871795 31.54904 0.56000
2013
AALI 3.85000 0.884615 30.33661 0.46000 ANTM 0.81000 0.858974 30.71591 0.71000 ASII 2.59000 0.923077 32.99697 1.02000 BBCA 3.70000 0.923077 33.83821 6.73622 BDMN 1.15000 0.897436 32.84725 4.83898 BBNI 1.54000 0.910256 33.58855 6.90917 BBRI 2.25000 0.910256 34.07066 6.89365 BMRI 2.06000 0.910256 34.22830 6.72070 INDF 1.53000 0.884615 31.98892 1.05000 KLBF 6.89000 0.897436 30.05716 0.33000 PGAS 5.76000 0.871795 31.61138 0.62000 PTBA 3.11000 0.858974 30.08866 0.55000 TLKM 0.56000 0.846154 32.48267 0.65000 TINS 1.53000 0.820513 29.69577 0.57000 UNTR 1.99000 0.858974 31.68041 0.61000
2014
104
APPENDIX G
DESCRIPTIVE STATISTICS
Descriptive Statistics
N Minimum Maximum Mean Std. Deviation
ROA 80 -.00814 .54474 .1539981 .13350106
ROE 80 -.06500 1.25810 .2740412 .24076039
PBV 80 .81000 46.63000 5.5150000 9.22332225
CSRDI 80 .80769 .94872 .8876603 .02978825
SIZE 80 29.40277 34.38217 31.750463
6 1.55043394
LEV 80 .18000 10.02403 2.6401860 2.98838177
Valid N (listwise) 80
105
APPENDIX H
STATISTICAL TEST RESULT
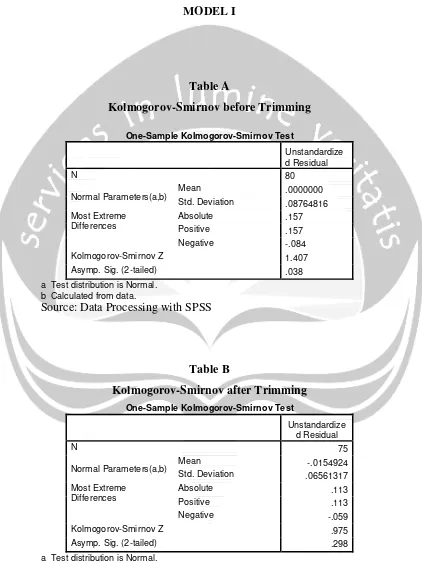
MODEL I
Table A
Kolmogorov-Smirnov before Trimming
One-Sample Kolmogorov-Smirnov Test
Unstandardize d Residual
N 80
Normal Parameters(a,b) Mean .0000000
Std. Deviation .08764816
Most Extreme Differences
Absolute .157
Positive .157
Negative -.084
Kolmogorov-Smirnov Z 1.407
Asymp. Sig. (2-tailed) .038
a Test distribution is Normal. b Calculated from data.
Source: Data Processing with SPSS
Table B
Kolmogorov-Smirnov after Trimming
One-Sample Kolmogorov-Smirnov Test
Unstandardize d Residual
N 75
Normal Parameters(a,b) Mean Std. Deviation -.0154924 .06561317 Most Extreme
Differences
Absolute .113
Positive .113
Negative -.059
Kolmogorov-Smirnov Z .975
Asymp. Sig. (2-tailed) .298
a Test distribution is Normal. b Calculated from data.
106
Table C
Source: Data Processing with SPSS
Table D
Model Summary(b)
Model R R Square
Adjusted R Square
Std. Error of
the Estimate Durbin-Watson
1 .796(a) .634 .618 .05774353 1.667
a Predictors: (Constant), LEV, CSRDI, SIZE b Dependent Variable: ROA
Source: Data Processing with SPSS
Table E
ANOVAb
Model
Sum of
Squares df Mean Square F Sig.
1 Regression .409 3 .136 40.914 .000(a)
Residual .237 71 .003
Total .646 74
a Predictors: (Constant), LEV, CSRDI, SIZE b Dependent Variable: ROA
108
APPENDIX I
STATISTICAL TEST RESULT
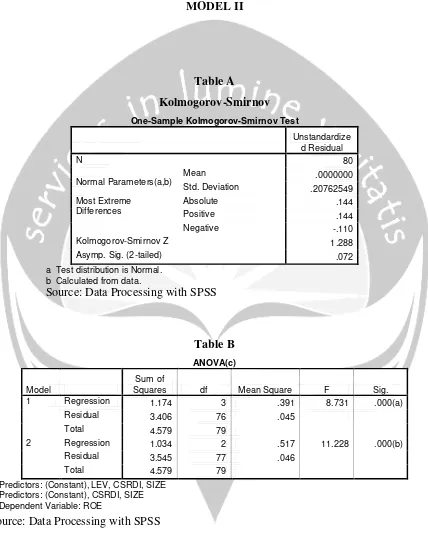
MODEL II
Table A
Kolmogorov-Smirnov
One-Sample Kolmogorov-Smirnov Test
Unstandardize d Residual
N 80
Normal Parameters(a,b) Mean .0000000
Std. Deviation .20762549
Most Extreme Differences
Absolute .144
Positive .144
Negative -.110
Kolmogorov-Smirnov Z 1.288
Asymp. Sig. (2-tailed) .072
a Test distribution is Normal. b Calculated from data.
Source: Data Processing with SPSS
Table B
ANOVA(c)
Model
Sum of
Squares df Mean Square F Sig.
1 Regression 1.174 3 .391 8.731 .000(a)
Residual 3.406 76 .045
Total 4.579 79
2 Regression 1.034 2 .517 11.228 .000(b)
Residual 3.545 77 .046
Total 4.579 79
a Predictors: (Constant), LEV, CSRDI, SIZE b Predictors: (Constant), CSRDI, SIZE c Dependent Variable: ROE
109
Table C
Variables Entered/Removed(b)
Model
Variables Entered
Variables
Removed Method
1 LEV,
CSRDI, SIZE(a)
. Enter
2
. LEV
Backward (criterion: Probability of F-to-remove >= .050).
a All requested variables entered. b Dependent Variable: ROE
Source: Data Processing with SPSS
Table D
Model Summaryb
Model R R Square
Adjusted R Square
Std. Error of
the Estimate Durbin-Watson
1 .506(a) .256 .227 .21168370 2.156
a Predictors: (Constant), LEV, CSRDI, SIZE b Dependent Variable: ROE
111
APPENDIX J
STATISTICAL TEST RESULT
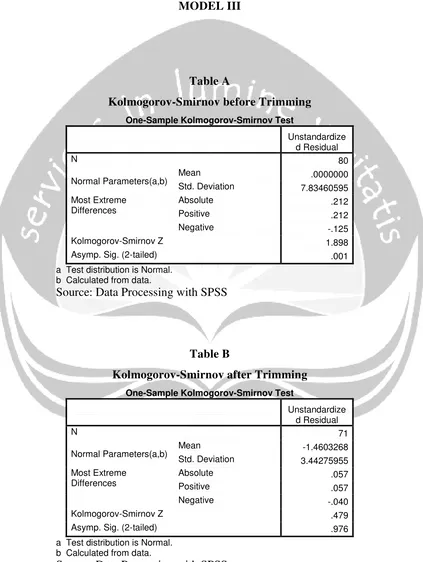
MODEL III
Table A
Kolmogorov-Smirnov before Trimming
One-Sample Kolmogorov-Smirnov Test
Unstandardize d Residual
N 80
Normal Parameters(a,b) Mean .0000000
Std. Deviation 7.83460595
Most Extreme Differences
Absolute .212
Positive .212
Negative -.125
Kolmogorov-Smirnov Z 1.898
Asymp. Sig. (2-tailed) .001
a Test distribution is Normal. b Calculated from data.
Source: Data Processing with SPSS
Table B
Kolmogorov-Smirnov after Trimming
One-Sample Kolmogorov-Smirnov Test
Unstandardize d Residual
N 71
Normal Parameters(a,b) Mean Std. Deviation -1.4603268 3.44275955 Most Extreme
Differences
Absolute .057
Positive .057
Negative -.040
Kolmogorov-Smirnov Z .479
Asymp. Sig. (2-tailed) .976
a Test distribution is Normal. b Calculated from data.
112
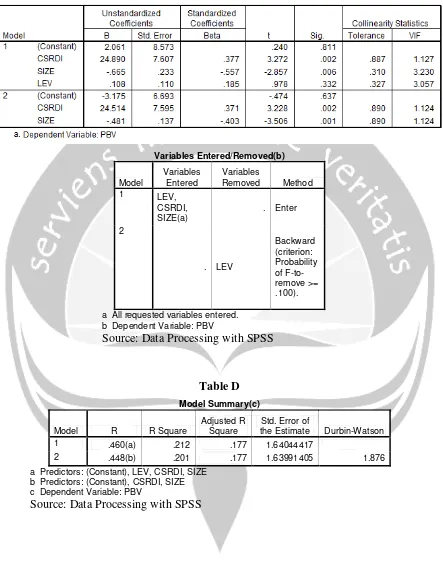
Table C
Variables Entered/Removed(b)
Model
Variables Entered
Variables
Removed Method
1 LEV,
CSRDI, SIZE(a)
. Enter
2
. LEV
Backward (criterion: Probability of F-to-remove >= .100).
a All requested variables entered. b Dependent Variable: PBV
Source: Data Processing with SPSS
Table D
Model Summary(c)
Model R R Square
Adjusted R Square
Std. Error of
the Estimate Durbin-Watson
1 .460(a) .212 .177 1.64044417
2 .448(b) .201 .177 1.63991405 1.876
a Predictors: (Constant), LEV, CSRDI, SIZE b Predictors: (Constant), CSRDI, SIZE c Dependent Variable: PBV
113
Table E
ANOVA(c)
Model
Sum of
Squares Df Mean Square F Sig.
1 Regression 48.497 3 16.166 6.007 .001(a)
Residual 180.301 67 2.691
Total 228.798 70
2 Regression 45.925 2 22.962 8.538 .000(b)
Residual 182.874 68 2.689
Total 228.798 70
a Predictors: (Constant), LEV, CSRDI, SIZE b Predictors: (Constant), CSRDI, SIZE c Dependent Variable: PBV