SUPPLEMENTARY MATERIAL FOR
CONFORMATIONAL ANALYSIS: A NEW APPROACH BY MEANS OF
A. SEE SUPMAT2.DOC
B.COMPLETE CONFORMATIONAL ANALYSIS FOR THE BASIC STRUCTURE
A complete systematic search is carried out for the basic structure and the results are presented here, including:
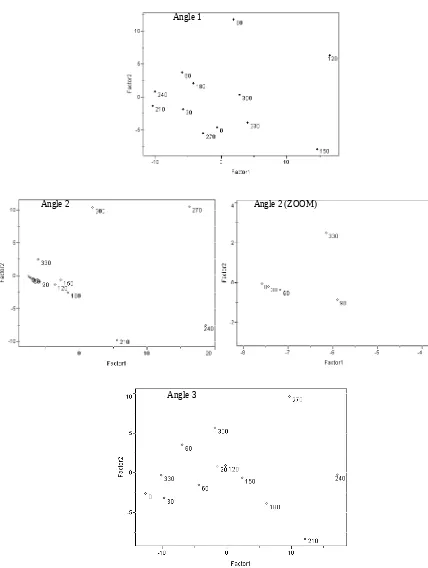
FIGURE 1. PCA results for the basic structure: Results for all potential energy surfaces data organized
according to Scheme 1, regarding the paper.
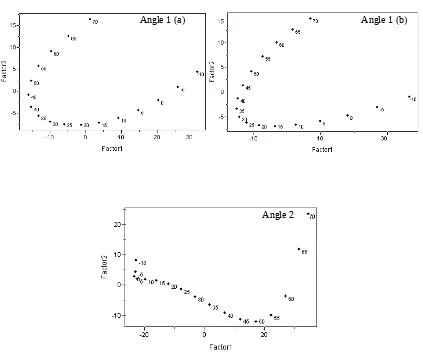
FIGURE 2. PCA results for each individual angle.
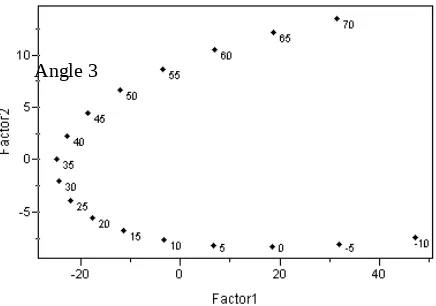
FIGURE 3. PCA results for selected regions in the basic structure refinement.
COMPLETE CONFORMATIONAL ANALYSIS FOR THE BASIC STRUCTURE
A complete systematic search is carried out for the basic structure and the results are presented here.
Principal Component Analysis: the first rotation
The results refer to the calculations performed according to Equation 1 (see the paper) and can be compared with those presented in the paper, which were obtained through Equation 2 (see the paper).
In the basic structure, as already mentioned, there are three bonds with free rotations. It is not possible to visualize the surface containing all three angles versus energy since that would require a four dimensional space. However, the results may be visualized through principal component analysis. A combinatorial tree of these three angles, shown by the scheme below is used, being s the number of steps. A matrix was built for each angle, where the number of the rows is given by the number of branches, and the columns are composed by the number of ramifications.
Angles were analyzed and the result are presented by Figure 1. When the data were analyzed in one step, the first and the second principal components accumulated 50% of the original information. It can be seen that all the points converge to the same region on the diagram.
FIGURE 1. PCA results for the basic structure: Results for all potential energy surfaces data
organized according to Scheme 1, regarding the paper.
Angle 1
Angle 2 Angle 2 (ZOOM)
FIGURE 2. PCA results for each individual angle.
Principal Component Analysis: Refinement
The selected regions for each angle were further refined with a 5 angle increment.
Figure 3 shows the results for each principal component analysis. When these results are compared with those obtained for the refinement performed according the Equation 2 (see Figure 5 in the paper), it is observed that, for all angles, the same values were found. Table I shows the values for optimized conformations .
Angle 1 (b) Angle 1 (a)
FIGURE 3. PCA results for selected regions in the basic structure refinement.
Table I.
Characteristics of minimum conformation characteristics (basic structure) Conformation Angle Obtained value Hf (PM3)/kcal mol-1 Ee(6-31G**)/hartree
1 92.37
A 2 10.07 54.96 -1134.33
3 298.36
1 266.46
B 2 175.69 54.71 -1134.35
3 296.42
According to Table I, it is observed that the same conformations were obtained as in Table III in the paper, which again confirms that the methodologies are equivalent.