Supplementary Material for “Calculation of
Relative Solvation Free Energy Differences by
Thermodynamic Perturbation Method:
Dependence of the Free Energy Results on the
Simulation Length” by M. Rami Reddy and
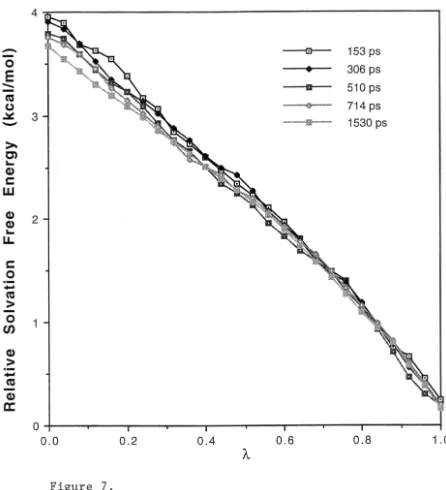
Figure 6: Plot of accumulated relative solvation free energy change as a function of for the transformation of 1,1,1-trifluoroacetone ( =1) to
acetone ( =0). These calculated results were obtained using different MD
simulation lengths (153, 306, 510, 714 and 1530 ps) and the same starting
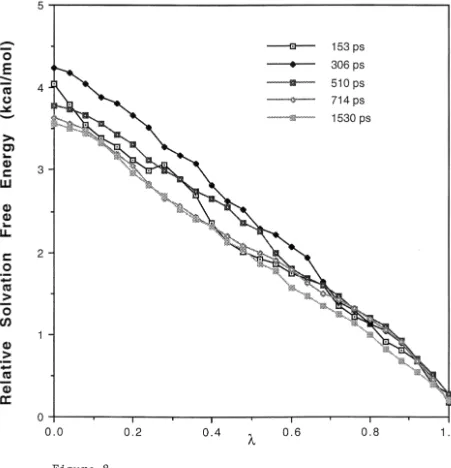
function of for the transformation of 1,1,1-trichloroacetone ( =1) to
acetone ( =0). These calculated results were obtained using different MD
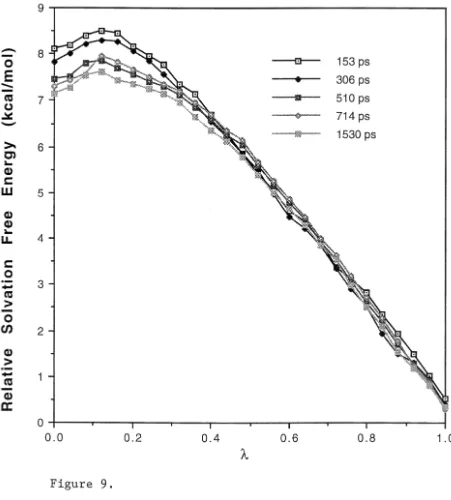
Figure 8: Plot of accumulated relative solvation free energy change as a function of for the transformation of 2,3-butanedione ( =1) to acetone (
=0). These calculated results were obtained using different MD simulation
lengths (153, 306, 510, 714 and 1530 ps) and the same starting
function of for the transformation of formaldehyde hydrate ( =1) to
formaldehyde ( =0). These calculated results were obtained using different
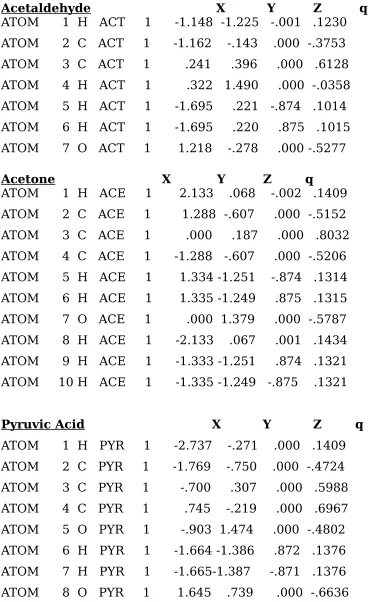
Table IV: List of final atomic coordinates and CHELPG charges for the
optimized coordinates (Table IV). Partial atomic charges were obtained using CHELPG to fit the charges to the quantum mechanical electrostatic potential computed from ab initio 6-31G** wave functions calculated with Gaussian 94 (Table IV). Force constants and Van der waal’s parameters for all the atoms were obtained from similar chemical species within the
AMBER database, except the force field parameters related to the following atoms.
Van der waal’s parameters
Compound name Atom Name R*(Å) kcal/mol
1,1,1-Trifluoroacetone F 1.70 0.08
1,1,1-Trichlroacetone Cl 2.07 0.25
Torsional parameters
Torsion Vn /2 n