EQIVALENT INTERGRANULAR VOID RATIO ANALYSIS OF SAND-SILT MIXTURES
Analisis Angka Pori Intergranular Ekuievalen Terhadap Beberapa Campuran Pasir Lanau
Ida Sri Oktaviana
Jurusan Teknik Sipil Universitas Tadulako-Jalan Soekarno Hatta Km. 8 Palu 94118, Email : [email protected]
ABSTRACT
In the recent last decade studies indicated that the void ratio only might not be good to characterize the sand with fines state variable and fine grains in fact were contributed to the intergrain contact. Contribution of fine content defined in the intergranular (es) and interfine (ef) void ratio studied by Thevanayagam (1998). Moreover, Thevanayagam (2000) introduced equivalent intergranular void ratio (es)eq and equivalent interfine void ratio (ef)eq, as contact index which include the contribution of fine contents as an active intergrain contact (b). In this article, the void ratio given in the 6 sand-silt mixture from past researches recalculated to intergranular void ratio and equivalent intergranular void ratio for FC < FCth using estimated b value obtained from the line equation from chart given by Thevanayagam (2010). The new chart replotted and compared to the one given in those articles. The results shows that for most sand-silt mixture using es and (es)eq rather than e as the indices to characterize the contribution of fine grains in a soil mix for FC< FCth indicated good results that shows in plotted data points of soil mixtures that located close to a single line compare to the one using void ratio (e) only. The line equation proposed by Thevanayagam (2010) can be used to estimate the b value to obtain the equivalent intergranular void ratio.
Keywords :sand-silt mixture, intergranular, void ratio
ABSTRAK
Studi yang dilakukan pada dekade terakhir mengindikasikan bahwa angka pori saja tidak dapat digunakan untuk mencirikan state variable dari campuran pasir dan butiran halus karena pada kenyataannya butiran halus berkontribusi terhadap kontak antar butir. Kontribusi butiran halus ini dapat didefinisikan dalam angka pori intergranular (es) and interfine (ef) (Thevanayagam, 1998). Angka pori intergranular ekuivalen (es)eq dan angka pori interfine ekuivalen (ef)eq diperkenalkan oleh Thevanayagam (2000) sebagai indeks kontak yang menyertakan kontribusi butiran halus sebagai kontak antar butir aktif (b). Pada studi ini, dengan angka pori campuran pasir-butiran halus dari 6 penelitian sebelumnya, angka pori intergranular dan angka pori intergranular ekuivalen untuk FC < FCth dihitung dengan memakai nilai b estimasi yang diperoleh dari persamaan garis kurva yang diberikan oleh Thevanayagam (2010). Hasil yang diperoleh kemudian diplot kembali dan dibandingkan dengan data asli dari masing-masing penelitian tersebut. Hasil studi menunjukkan bahwa pada kebanyakan campuran pasir-lanau yang menggunakan es dan (es)eq daripada e sebagai indeks untuk mencirikan kontribusi butiran halus pada campuran pasir-lanau tersebut untuk FC < FCth memperlihatkan bahwa titik-titik data hasil analisis tersebut cenderung berdekatan membentuk satu garis kurva jika dibandingkan dengan data-data yang hanya menggunakan nilai angka pori saja. Berdasarkan studi ini, persamaan garis yang diberikan oleh Thevanayagam (2010) dapat digunakan untuk menentukan nilai b untuk menghitung angka pori intergranular ekuivalen.
Kata Kunci :campuran pasir-lanau, intergranular, angka pori
INTRODUCTION
a. Background
Liquefaction is one phenomenon that can occur during earthquakes that may cause damages to structures. Liquefaction mainly occurs in saturated soils that have a relatively loose structure, uncemented, low permeability and subjected to an intense ground motion with sufficient long duration. Typically soil mix of sand and silt in nature are
vulnerable to liquefy, however most research were carried on clean sands.
mechanical behavior, liquefaction resistance and void ratio of clean sands, sand-silt mixtures with different fine content and silt has been carried on (Polito and Martin, 2001; Thevanayagam et al. 2002; Carraro et al. 2003; Murthy et al. 2007; Papadopoulos and Tika, 2008; Chiu and Fu, 2008; Belkhatir et al. 2010). Some researches use the global void ratio (e) as the soil mixture indices while some others use intergranular void ratio and equivalent intergranular void ratio proposed by Thevanayagam (2000). Intergranular void ratio proposed to use is to consider the contribution of fines to the coarse grain skeleton, while void ratio only is neglecting the fine contribution.
The fraction of fine grains that contribute to the active intergrain contacts or b value is introduced in the equivalent intergranular void ratio equation for higher fine contents. The b value can be set in range of 0-1. The prediction of b value is somewhat still in controversy. Thevanayagam (2010) has proposed a chart that can be used to estimate b value. It depends on the uniformity coefficient of host sand (Cus), uniformity coefficient of silt (Cuf) and diameter ratio of sand and silt (Rd
6 sand-silt mixture from past research will be recalculated using estimated b value obtained from the chart given by Thevanayagam (2010) and compared to the one given in the previous researches
b. Intergranular Void Ratio of Sand-Silt Mixture
− Intergranular soil mix classification
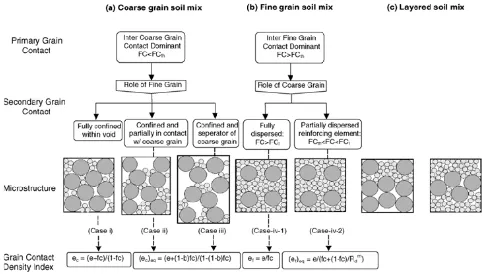
Traditionally, void ratio has used as state variable to assess liquefaction behavior of soil under critical state of soil mechanics framework. However, recent studies indicated that the void ratio only might not be good to characterize the sand with fines state variable. The studies showed that fine grains in fact were contributed to the intergrain contact. Contribution of fine content defined in the intergranular and interfine void ratio studied by Thevanayagam (1998). Moreover, Thevanayagam (2000) introduced equivalent intergranular void ratio as contact index which include the contribution of fine contents as an active intergrain contact (b).
Figure 1 represents the microstructure and soil mix behavior classified by Thevanayagam (2002) which explain how the addition of fine content with different proportion will behave in the soil skeleton and how they contribute to the skeleton. According to Thevanayagam (2002), basically, three categories are dividing these soil mixtures.
1) Coarse grain soil mix where primarily the
coarse grain contact play a role in the soil shear response and the fines have secondary contribution (FC<FCth, fine content less than
threshold fine content). This category divided more to three secondary grain contact cases which represent the contribution of fine contents in the structure. Case (i) is the soil structure where the fines are confined within the void between the coarse grains with less contribution to support the coarse grain skeleton. It possible in condition where the size of fine grain or d is much smaller the minimum possible pore opening size in the coarse skeleton (D/d > 6.5) and if the intergranular void are not fully filled with fines. Case (ii) is the structure where the fines partially supporting the coarse grain skeleton. Fines are partially separate the coarse grain skeleton in case (iii).
2) In the second category where FC>FCth, the fine
grain are dominant to play important role in the fine grain contact and provide secondary reinforcement effect. The coarse grains are fully dispersed in the fine grain matrix (case iv). 3) In this category the coarse grain and fine are
layered and either coarse grain layers have no fines confined in them or fines layers have no coarse grain confined in them.
Soil skeleton will gradually change from case i to case iv with the increasing of fine content in the soil skeleton.
− Intergranular void ratio and equivalent intergranular void ratio
It is likely to express the contribution of sand and fines together in terms of intergranular void ratio as given in several studies (Polito and Martin, 2001; Carraro et al. 2003; Papadopoulos and Tika, 2008;and Belkhatir et al. 2010). The intergranular
(1)
where es is the intergranular void ratio, e is global
void ratio and fc is fine contents. This expression
assuming that the secondary effect of fines is neglected. Thevanayagam (2000) introduced the equivalent contact index which considering the participation of fines in the soil structure. At FC < FCth grain contact index defined as
for 0 ≤ b ≤ 1 (2)
where fc = FC/100, e is global void ratio and b is the
portion of fines that contribute to the active intergrain contact. Value of b ranged from 0 to 1 and
it depends on grain size disparity ratio Rd
(D50/d50)and grain characteristic such as coefficient
of uniformity of coarse grain (Cus) and coefficient of
uniformity of fine grain (Cuf). If none of the fine
grain participate in supporting the coarse grain skeleton value of b = 0 and b = 1 if all of the fine grains actively supported the coarse grain skeleton and the intergranular void ratio will reduced to global void ratio e as shown in equation 3.
for b = 1 (3)
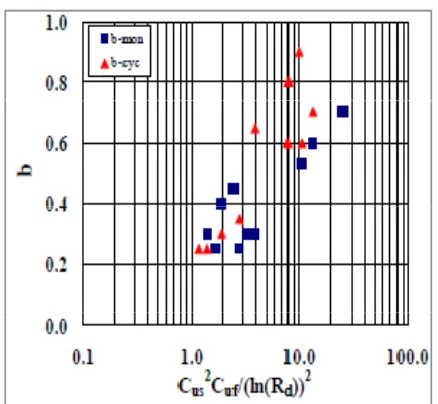
Thevanayagam (2010) provided a chart as shown in figure 2 to estimate the b value which depends on Rd
(ratio of the d50 of the host sand and silt in the soil
mix), Cus (uniformity coefficient of coarse grain
soil) and Cuf (uniformity coefficient of fine grain
soil) of the sand-silt mixture. The equivalent intergranular void ratio of sand-silt soil mixture then can be calculated using equation 2 whenever the value of b has been estimated from chart according to the soil properties given for the mixtures. The value of b can be estimated using equation 4) for monotonic behavior of soil and 5) for cyclic behavior.
b = 0.144 x ln (X) + 0.2 (4)
b = 0.232 x ln (X) + 0.19 (5)
Figure 2. Approximate relationship between b and Rd, Cus and Cuf for non-plastic fine contents (after
Thevanayagam, 2010)
METHOD OF ANALYSIS
Data of analysis of different sand-silt mixtures from 6 past published papers had been analyzed in this research. Most of the data taken from the papers are analysis on the effect of sand-silt mixtures on the soil instability in terms of its void ratio, thus the plots are mostly between the void ratio or intergranular void ratio (e or es) and the mean effective stress or soil cyclic resistance of the mixture (p’ or CRR) with different fine contents. Some other papers plotted the results between void
peak shear strength (Sus ).
The data were analized to obtain and plot the new equivalent intergranular void ratio by using value of b estimated from chart provided by Thevanayagam (2010). The b value will obtained using line equation for monotonic and cyclic behavior of soil in equation 4 and 5. The new estimation plotted in new charts of relation between the mean effective stress or soil cyclic resistance and the equivalent intergranular void ratio or (es)eq which is considering the secondary influence of the fine grain without neglecting the effects of fines as defined for intergranular void ratio (ec).
This reseach is limited to study only the intergranular void ratio for sand-silt mixture for inter coarse grain dominant or FC<FCth.
RESULTS AND DISCUSSION
The b value estimated using the chart provided by Thevanayagam (2010) based on the soil mixtures index properties briefly summarized in Table 1. Using the estimated b value, the equivalent intergranular void ratio then calculated for the published datasets and plotted in a chart to observed if it can be better contact density indices to characterize the mechanical response of the sand-silt mixture than the global void ratio and to observed the effectivity of chart provided to estimate b value
(a) (b)
(c)
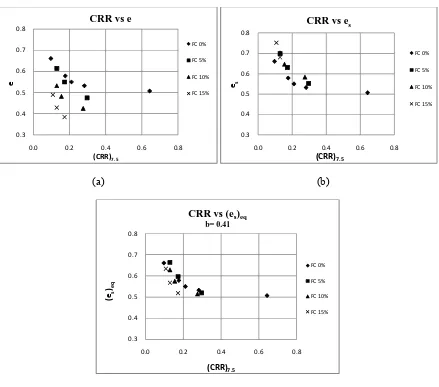
Figure 3. Cyclic resistance ratio (CRR)7.5 of Ottawa sand with #106 Sil-Co-Sil ground silica silt and (a)
global void ratio; (b) intergranular void ratio with b = 0 from after Carraro et al. (2003) and; (c) equivalent intergranular void ratio with b = 0.41 using equation (2)
(a) (b)
0.3 0.4 0.5 0.6 0.7 0.8
0.0 0.2 0.4 0.6 0.8
e
(CRR)7.5
CRR vs e
FC 0%
FC 5%
FC 10%
FC 15%
0.3 0.4 0.5 0.6 0.7 0.8
0.0 0.2 0.4 0.6 0.8
es
(CRR)7.5
CRR vs es
FC 0%
FC 5%
FC 10%
FC 15%
0.3 0.4 0.5 0.6 0.7 0.8
0.0 0.2 0.4 0.6 0.8
(es )eq
(CRR)7.5
CRR vs (es)eq
b= 0.41
FC 0%
FC 5%
FC 10%
FC 15%
0 0.2 0.4 0.6 0.8 1
1 10 100 1000 10000
e
pcs
Critical state lines vs e
fc 0% fc 5% fc 10 % fc 15 % fc 25 %
0.2 0.4 0.6 0.8 1 1.2 1.4
1 10 100 1000 10000
es
pcs
Critical state lines vs es
(c)
Figure 4. Critical state lines of Assyros sand with silt (F) and (a) global void ratio; (b) intergranular void ratio source data from Papadopoulos and Tika (2008) and; (c) equivalent intergranular void ratio with b = 0.28 using equation (2)
Carraro et al. (2003) studied the liquefaction resistance of clean and non-plastic silty sands based on Cone Penetration Resistance with fine contents range from 0 to 15% of Ottawa sand and ground silica silt. The cyclic stress ratio (CRR)7.5 here are the required CRR required to produce 5% double-amplitude axial strain at 20 uniform cycles as the criterion to define liquefaction of clean and silty sands. The results showed that the cyclic resistance of sand decreases when the silt content is increase for the given global void ratio while it will virtually independent of silt content and slightly higher than the liquefaction resistance of clean sand if intergranular void ratio (es) used as the basis of comparison (figs. 3 a-b). Fig. 3c presents the data from fig. 3a replotted using equivalent intergranular
void ratio (es)eq using b = 0.41 estimated from the chart provided by Thevanayagam (2010) for cyclic loading. The result indicated a single trend curve as expected.
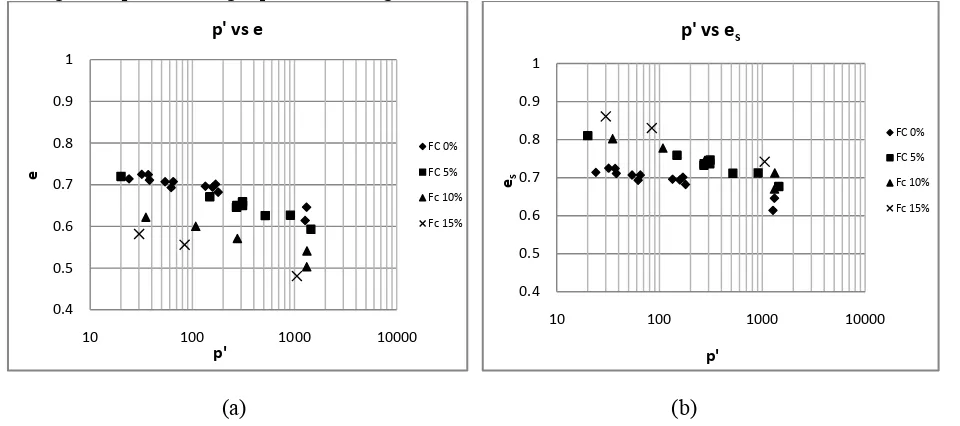
Figure 4a and 4b shows the data points of mean effective stress in critical state conditions obtained from triaxial monotonic tests plots in terms of global void ratio and intergranular void ratio of Assyros sand and silt mixtures with fine contents ranged from 0 to 25% studied by Papadopoulos and Tika (2008). Figure 4c shows the mean effective stress in terms of equivalent intergranular void ratio with b = 0.28. It shows the data points moved to one single curve trend with the changed of the e to (es)eq.
1 10 100 1000 10000
(es
10 100 1000 10000
e
10 100 1000 10000
(c)
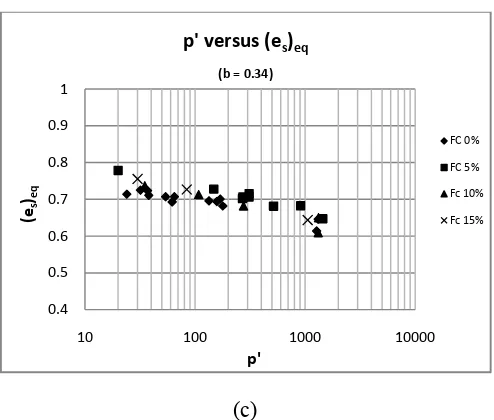
Figure 5. Mean effective stress of Ottawa sand with #106 Sil-Co-Sil ground silica silt (a) global void ratio, source data after Murthy et al (2007); (b) intergranular void ratio; and (c) equivalent intergranular void ratio with b = 0.34 using equation (2)
From the study in undrained monotonic response of clean and silty sands with fine contents of 0, 5, 10 and 15 % of Ottawa sand and ground silica silt, Murthy et al (2007) present one relationship between mean effective stresses in critical state (p’) and void ratio (e) for different specimen preparation method. Figure 5a shows the data points for specimen prepared in moisture tamping method only. Its relation in terms of equivalent intergranular void ratio (es)eq with b = 0.34 given in Figure 5c that virtually indicated the changing of the (es)eq which moved the points to the single curve trend.
In the study of nonplastic fines of Yatesville silt on the liquefaction resistance of Monterey sand Polito and Martin (2001) presented the relation between the cyclic resistance ratio of the soil mixture (CRR) in terms of void ratio and intergranular void ratio in range of silt 0 to 100%. This study only evaluated fine content up to 25% considering the threshold fine content of 30% for evaluation of intergranular void ratio. The result of the evaluation using b = 0.24 and equation 2 for calculation of (es)eq showed the good correlation between the CRR and the (es)eq showed in the close trend in Figure 6
(a) (b)
0.4 0.5 0.6 0.7 0.8 0.9 1
10 100 1000 10000
(es )eq
p'
p' versus (es)eq (b = 0.34)
FC 0% FC 5%
Fc 10% Fc 15%
0.40 0.60 0.80 1.00 1.20 1.40 1.60 1.80
0.00 0.10 0.20 0.30 0.40 0.50
e
CRR
CRR vs e
FC 0%
FC 5%
FC 10%
FC 15%
FC 20%
FC 25%
0.40 0.60 0.80 1.00 1.20 1.40 1.60 1.80
0.00 0.10 0.20 0.30 0.40 0.50
es
CRR
CRR vs es
FC 0%
FC 5%
FC 10%
FC 15%
FC 20%
(c)
Figure 6. Cyclic resistance of Monterey sand with Yatesville silt and (a) global void ratio; (b) sand skeleton void ratio source data from Polito and Martin (2001) and; (c) equivalent intergranular void ratio with b = 0.24 using equation (2)
(a) (b)
(c)
Figure 7. Undrained shear strength of Chlef sand with Chlef silt and (a) global void ratio with data after Belkhatir et al. (2010a); (b) intergranular void ratio (b = 0) and; (c) equivalent intergranular void ratio with b = 0.75 using equation (2)
0.00 0.10 0.20 0.30 0.40 0.50
The similar results have been given in the Figure 7 for the Chlef sand and silt mixtures studied by Belkhatir et al. (2010). For data points taken from this article the value of b is as high as 0.75 and the results shown the close range of (es)eq , however it virtually do not show good single curve trend compare to Figure 7b with intergranular void ratio (es) (Figure 7c).
From the study on undrained instability of mixed soils by equivalent intergranular state parameter by Chiu and Fu (2008) using b = 0.3 shows good result. Replotted the data points using b = 0.23 estimated from chart given by Thevanayagam (2010) has given close result to the previous study that can be seen from Figure 8b and 8c. Both results gave similar trend to single trend curve.
(a) (b)
(c) (d)
Figure 8. Mean effective stress of quartz sand with low plasticity silt (a) global void ratio; (b) equivalent intergranular void ratio with b = 0.3, source data after Chiu and Fu (2008) and; (c) equivalent intergranular void ratio with b = 0.23 using equation (2)
CONCLUSION
For most sand-silt mixture using the intergranular and equivalent intergranular void ratio rather than global void ratio as the indices to characterize the contribution of fine grains in a soil mix for FC< FCth shows good results. It can clearly defined from the Figures that showed data points plotted as relationship between equivalent
effective stresses of soil resistance of the soil mixture that located close to a single line.
Chart in Figure 2 used to estimated b value has given approximately close relation to b value given from other published articles even though some of them given less correlation compare to the one provided in those published articles. More study on published articles providing another b values
introduced by Thevanayagam (2010).
REFERENCES
Belkhatir, M., Arab, A., Della, N., Missoun, H., & Schanz, T., 2010a, Influence of inter-granular void ratio on monotonic and cyclic undrained shear response of sandy soils. Comptes Rendus Mecanique, 338, 290-303.
Carraro, J. A. H., Bandini, P., & Salgado, R., 2003, Liquefaction resistance of clean and nonplastic silty sands based on cone penetration resistance. Journal of Geotechnical and Geoenvironmental Engineering, 129(11), 965-976.
Chiu, C. F., & Fu, X. J., 2008, Interpreting undrained instability of mixed soils by equivalent intergranular state parameter. Géothecnique, 58(9), 751-755.
M. Bozozuk, 1976, Tower Silo Foundations, Published by Canadian Building Digest.
M.J. Tomlinson, 1955, Foundation Design and Construction, Sixth Edition, Published by Longman Scientific & Technical.
Murthy, T. G., Loukidis, D., Carraro, J. A. H., Prezzi, M., & Salgado, R., 2007, Undrained monotonic response of clean and silty sands. Géothecnique, 57(3), 273-288.
Papadopoulos, A., & Tika, T., 2008, The effect of fines on critical state and liquefaction resistance characteristics of non-plastic silty sands. Soil and Foundations, 48 (5), 713-725.
Polito, C. P., & Martin II, J. R., 2001, Effects of nonplastic fines on the liquefaction resistance of sands. Journal of Geotechnical and Geoenvironmental Engineering, 127(5), 408-415.
Stewart B, Lectures notes in foundation engineering, University of Glasgow, 2004-2005.
Thevanayagam, S., 1998, Effect of fines and confining stress on undrained shear strength of silty sands. Journal of Geotechnical and Geoenvironmental Engineering, 124(6), 479-491.
Thevanayagam, S., 2010, Liquefaction, screening, and remediation of silty soils. Fifth International Conference on Recent Advances in Geotechnical Earthquake Engineering and Soil Dynamics and Symposium in Honor of Professor I.M. Idriss, San Diego, pp. 1-11.
Thevanayagam, S., Shenthan, T., Mohan, S., & Liang, J., 2002, Undrained fragility of sands, silty
Geoenvironmental Engineering, 128(10), 849-859.
Thevanayagam, S., 2000, Liquefaction potential and undrained fragility of silty sands. Proceeding 12th International Conference Earthquake Engineering, R. Park, ed., Auckland, New Zealand, Paper 2383, New Zealand Society of Earthquake Engineers, UpperHutt, New Zealand.