Gadjah Mada International Journal of Business January-April 2009. Vol. 11, No. 1, pp. 73–116
THE BEHAVIOR OF OPENING AND
CLOSING PRICES
Noise and Overreaction*
Sumiyana**
This study extends several previous studies that conclude that noise and overreaction on intraday data occur. Those studies have yet to be clear about the kind of price that explains for this noise and overreaction. This study examines the opening price and closing price behavior, and tries to explain the noise and overreaction on the Indonesia Stock Exchange using intraday data in every 30-minute interval. Sample is firms listed in LQ45 index. Sequentially, this research sample is filtered to stocks that are the most actively traded on the Indonesia Stock Exchange based on trading frequency in an observation period from January to December 2006. This research finds that noise and overreaction phenomena always occur in the opening and closing prices. In addition, investors actually correct the noise and overreaction that occur simultaneously at the first 30-minute interval on every trading day.
Keywords:closing price; noise; opening price; overreaction
JEL Classification: G-11, G-14
* This paper has been presented in The 9th Annual Conference of the Asian Academic Accounting
Association, UOWD, Abu Dhabi, United Arab Emirates. I am considerate to all suggestions from the conference participants that make this paper better.
** The author appreciate helpful comments from Suwardjono, Jogiyanto HM, Ainun Na’im,
74
Gadjah Mada International Journal of Business, January - April 2009, Vol. 11, No. 1
Background
Opening and closing prices dur-ing a traddur-ing session play a crucial role due to the influence of information dissemination on both prices and con-centrated trading volumes. High un-certainty also supports this crucial role because of nontrading period (Madahavan and Panchapagesan 2002). High return volatility at the beginning of trading is a phenomenon that has been evidenced empirically (Amihud and Mendelson 1987; Stoll and Whaley 1990). Previous research shows that price volatility always in-creases at opening time and closing time (Wood et al. 1985; Haris 1986b; Lockwood and Linn 1990; Chan et al. 1995). Amihud and Mendelson (1987) argue that substantial movements of opening prices are caused by different trading mechanisms adopted by stock exchanges using auction method. Amihud and Mendelson (1987) and Stoll and Whaley (1990) examine trad-ing mechanism hypothesis by compar-ing return variances at the opencompar-ing with those at the closing for stocks listed on the NYSE. NYSE adopts both call market and continuous method mechanisms. The opening price is determined by call market mechanism whereas the closing price is determined by continuous method. Researchers find that return variances during the open-to-open periods are higher than those during the close-to-close periods. They also conclude that their results are consistent with trad-ing mechanism hypothesis. However,
NYSE trading mechanism differs from trading mechanism in Indonesia Stock Exchange where opening and closing prices are determined by continuous method. This means that trading mechanism may drive volatility. There-fore, there is no significant difference in return variances between opening prices and closing prices.
Trading mechanism hypothesis is not the only factor explaining the high volatility of returns at the NYSE ing prices. High volatility on the open-ing prices is the result of monopoly power specialists have and the ab-sence of overnight trading (Lam and Tong 1999). This is supported by the study of Guner and Onder (2002). These authors argue that the variances of opening returns on the ISE (Istanbul Stock Exchange) are higher than those of closing returns. They provide evi-dence that there is no difference in trading procedure at the opening and the closing on the ISE. Therefore, the conclusion drawn is that the differ-ences stem from previous nontrading period or nontrading session (Amihud and Mendelson 1991).
This phenomenon is well known as day-end effect, observed by Cheung (1995), Wood et al. (1985), Jain and Joh (1988), Miller (1989), Mcnish and Wood (1990), Ho (1990), Ho and Cheung (1991), and Harris (1996, 1989). All of those studies conclude that the increasing stock prices at the end of trading day constantly occur in European, American, Canadian, Aus-tralian, Asian, and Southeast Asian capital markets. However, the same phenomenon in Indonesia has yet to be investigated.
The high volatility on opening and closing prices indicates that stock prices fluctuate more intensely com-pared to those in other periods. Stock price movement reflects two concerns: (1) information arrivals and (2) noise (Huang et al. 2000). Noise can be noticed by investors’ inaccuracy per-ception or investors’ confidence on the fundamental values of stock prices. The differences between noise and information arrival are indicated by autocorrelation values between open-ing prices and subsequent openopen-ing pro-cess in an equal period. Negative autocorrelation implies the presence of noise, whereas zero or positive autocorrelation values indicate the in-formation related to volatility at the opening period.
In the other words, according to noise hypothesis, price movement that is not caused by fundamental changes will revert to the original price at the subsequent period. Thus, return series are negatively correlated. On the other
hand, according to information arrival hypothesis, price movement is caused by the presence of new information, and stock prices will not revert. When the information affects only one-pe-riod price movement, the autocorre-lation will be zero. When its influence lasts longer (more than one period), the autocorrelation value should be positive. In addition to noise hypoth-esis, high volatility on opening and closing returns could be the result of overreaction. There is a difference in return behavior between opening re-turns and closing rere-turns. It suggests that investors can adjust the pricing inaccuracy of opening and closing prices in the subsequent periods.
76
Gadjah Mada International Journal of Business, January - April 2009, Vol. 11, No. 1
prices is principally unable to repre-sent the fundamental values. The ini-tial and final influences of trading day can also be recognized as the presence of asymmetric information between buyers and sellers. Therefore, stock prices tend to vary temporarily from the fundamental values.
Objectives
This study examines noise and overreaction phenomena of opening and closing prices on an emerging capital market, Indonesia Stock Ex-change. More specifically, this study observes the similarity and dissimilar-ity of return distributive structure dur-ing some intervals in one day. The phenomena become important for the following reasons. First, to investi-gate the noise and overreaction occur-rences, this research uses both open-ing and closopen-ing prices simultaneously. Simultaneous use of the opening and closing prices is better than single use of opening or closing price returns as it could give a higher conclusion valid-ity. Second, different capital market circumstances, especially emerging capital markets in comparison to ad-vanced capital markets, possibly sug-gest a different conclusion. Further-more, examination on those phenom-ena has two important consequences.
First, stock prices at the opening and closing of trading day do not com-pletely reflect the fundamental values, which would affect the behavior of prudent investors and potential inves-tors on the Indonesia Stock Exchange.
Second, the existence of noise and
overreaction phenomena affects trad-ing strategies employed by investors on the Indonesia Stock Exchange.
Benefits
This study provides some ben-efits for current and potential inves-tors to analyze their investment deci-sions. Information gained from the variability of stock price behavior dur-ing traddur-ing period on the Indonesia Stock Exchange is associated with the decision timing for their trading strat-egies. Another advantage of this study is that current and potential investors may search for information reliability of returns during trading period in ac-cordance with the investment decision timing.
Discussion Organization
The rest of discussion is arranged in the following order. Part 2 discusses theoretical backgrounds and hypoth-eses development. The hypothhypoth-eses are designed using main hypotheses and reexamined with other control bases. Part 3 discusses research methods uti-lized to examine all hypotheses. Part 4 discusses analysis and research find-ings. The final section, Part 5, dis-cusses conclusions derived from re-search findings and analysis.
Literature Review and
Hypothesis Development
Howe 1994). Consequently, high vola-tility occurs at the opening session in every trading day (Amihud and Mendelson 1987; Madhavan and Panchapagesan 2002; Guner and Onder 2002; Stoll and Whalley 1990); Jain and Joh (1988); Foster and Viswanathan (1993). Several theories are developed in order to explain higher price volatility at the opening session. One of them is trading method expla-nation (Amihud and Mendelson 1987). The theory suggests that the difference in trading method used on the New York Stock Exchange (NYSE) results in higher volatility at the opening ses-sion. NYSE adopts call market method at the opening session and price con-tinuous method at the closing session (Amihud and Mendelson 1989).
In addition to the differences in trading mechanism theory, there are monopoly power specialist theory and nontrading overnight period theory (Lam and Tong 1999). Since the Indo-nesia Stock Exchange does not adopt different trading method at opening and closing sessions, the high volatil-ity returns cannot suggest any evi-dence of the influence of trading method on the opening and closing prices. Furthermore, there is no mar-ket maker on the Indonesia Stock Ex-change such that the monopoly power specialists are not applicable either. It can be stated that higher price volatil-ity at the opening session is due to accumulated information during non-trading period. Informed traders who obtain information during non-trading
session overnight would conduct more aggressive trading after the market opens, especially when they assume that the obtained information would be published immediately (Foster and Viswanatahan 1993).
Chan et al. (2000) provide several assumptions about the occurrence of higher market activities at the opening session. First, this phenomenon oc-curs because of accumulated informa-tion during non-trading session over-night. Second, if the informed traders receive private information overnight and they assume that it will leak out the next day, they will immediately trade following the opening session. Third, the trading volumes at the opening and closing trading sessions indicate total trading volumes conducted by inves-tors to rebalance their portfolios be-fore and after non-trading session over-night. Fourth, open-to-open return vari-ance is greater than close-to-close re-turn variance for all stocks traded on the NYSE. It suggests that opening prices have higher price variances than do closing prices.
78
Gadjah Mada International Journal of Business, January - April 2009, Vol. 11, No. 1
(1985) conduct a study observing a six-month period from September 1971 to February 1972. They find negative autocorrelation between return inter-val at the day-end current trading and opening return interval of the day after the current trading day. They conclude that overall stock prices on every stock exchange always increase at the day-end trading.
Jain and Joh (1988) conduct a similar study on day-end effect. Their results also suggest that closing prices within one-hour interval for one year also significantly increase during 1982-1983 on the NYSE. Miller (1989) does more specific observation on stock prices behavior on the SEHK. He con-cludes that the increasing stock prices at the day-end trading session result from specialists’ actions that set higher prices in order to retain their positions at the next day opening. Miller (1989), in his research, introduces the influ-ence of trading mechanism that results in systematically increasing stock prices at the day-end trading period. Mcnish and Wood (1990) confirm the result using 1980-1984 data on the NYSE. Their findings are consistent with those of Wood et al. (1985).
Ho and Cheung (1991) observed day-end effect phenomenon for 1986 on the SEHK. Their results show that day-end effect occurs on emerging stock markets. Previously, Ho (1990) observed 11 capital markets in Asia Pacific, including Southeast Asia ex-cept Indonesia. His results show simi-lar evidence. Harris (1986a; 1989)
concludes that overall stock prices in-crease at the closing interval to the day-end trading. Both studies are con-ducted on the same market, NYSE, in different times. More specifically, an-other study suggests that the increas-ing stock prices in the latest one hour are due to increasing ask prices. Harris (1989) confirms that increasing prices at the day-end trading period are a pervasive phenomenon that occurs on every company in every trading day.
Cushing and Madhavan (2000) study return behavior on the Russian Stock Exchange over one year from June 1998 to July 1999. They empiri-cally find that stock returns increase in the latest five minutes interval at the day-end trading session. The occur-rence is caused by institutional traders having interests to affect overall stock return components. Meanwhile, Har-ris (1989) argues that the day-end ef-fect is caused by increasing frequency of stock demand at the day-end trading session. Nevertheless, Harris (1989) explicitly argues that the last trading session is often initiated by buyers. Miller (1989) argues that the day-end effect comes from trading mechanism. NYSE is a continuous market with specialists and dealers acting as mar-ket equilibrium makers. Undoubtedly, specialists are marketers who main-tain price continuity during trading day. They require that the opening prices must be as close as the previous day’s closing prices.
that the day-end effect occurs not only on the NYSE, but also on the Stock Exchange of Hong Kong (SEHK), which operates without specialists and dealers. The day-end effect returns only have a short-term impact, where positive and high returns at the day-end trading session will be automati-cally adjusted by the market at the next day’s opening session. Negative cor-relation between certain time interval returns at the day-end session and open-ing returns of the next tradopen-ing day indicates prices adjustment.
Mok (1988) conducts a study on day-end effect for emerging capital markets using intraday data on the SEHK. He finds that the day-end trad-ing for the last 15 minutes is always marked with significantly increasing stock prices. Using separated time of 30-minute interval, his findings show similar results. There are dominantly increasing prices at the end of trading period. Although Mok’s (1988) study only employs t-test, it has presented valid evidence showing that return dis-tribution is not perfect for daily return. Cheung (1995) and Sumiyana (2008) confirm that excessive positive returns at the last 30-minute interval on the SEHK and ISE, and the IDX indicate the influence of day-end trad-ing. Because the event is ex post, it can be concluded that the influence of in-vestor expectation on their trading as well as trading mechanism period at day-end trading affect the day-end ef-fect. The test results are supported more by sensitivity analysis using size,
trading volume, and bid-ask spreads. Sensitivity test results show that ex-cessively positive returns occur at the end of 30-minute interval that indi-cates the day-end effect.
High volatility on opening and closing prices on capital markets is also suggested by Wood et al. (1985) and Lockwood and Line (1990) who examine intraday stock returns. The volatility returns form a U-shaped pat-tern, in which the highest volatility returns are at the opening and closing sessions of the market (Chan et al. 1995). The high volatility can be caused by noise occurrences (Steeley 2001). The indication of noise is examined using autocorrelation test in subse-quent periods. Negative autocorre-lation value indicates the occurrence of noise, whereas zero or positive autocorrelation values indicate infor-mation attributed to volatility at the opening session. All these studies try to analyze the relation between open-ing returns and closopen-ing returns, which have negative autocorrelation with the next period returns. This negative cor-relation is caused by the noise occur-rences such that there is a difference in return behavior of opening and closing returns (Huang et al. 2000). It means that opening price inaccuracy could be adjusted at the next trading period.
80
Gadjah Mada International Journal of Business, January - April 2009, Vol. 11, No. 1
noise trading, the less liquid a market will be, meaning that there is no more trading that has the possibility of ob-serving prices. However, noise trad-ing, in fact, puts noises into prices. Stock prices reflect information from information-based traders whereas noise from noise traders. The noise put by noise traders into stock prices will be cumulative such that stock prices tend to revert to their fundamental values at all time. The farther the stock prices move from their values, the faster they tend to revert (Black 1986).
A number of financial market anomalies, including abundant vola-tility and average reversion in stocks prices, can be explained by the idea of noise trader. The behavior of profes-sional arbitrage is a response to noise trading, not to fundamental-based trad-ing. Most professional arbitrageurs fin-ish their resources check and spurious signal predictions followed by noise traders (Delong et al. 1990). Noise traders make inaccurate price estima-tion particularly regarding return dis-tribution variance of a particular asset. For such misperception, noise traders as a group not only create higher gains than do rational investors, but also survive in the case of long-term assets, even if they take excessive risk.
Traders based on noise strategy can potentially cause destabilization and push the prices away from funda-mental values when they form a herd. However, the prices will be stable when fundamental-based trading is strong enough to prevent the price movement
away from fundamental values and to respond to fundamental information. A study on grouping by mutual funds indicates that, as a whole, every ad-justment to observed stock prices after trading by a herd seems to be perma-nent, supporting the idea that herding by mutual funds will speed up the price adjustment process and not lead to destabilization (Wermers 1999).
If there is any noise, the increas-ing stock prices at tradincreas-ing period will be followed by price reversion at the next periods, and vice versa. There-fore, the noise occurrence is indicated by the occurrence of negative autocorrelation between opening prices and those at subsequent periods (Huang et al. 2000; Sumiyana 2007b). For that reason, a hypothesis is stated as follows:
H1a: Negative autocorrelation occurs between the first 30-minute in-terval of current opening return and opening returns for subse-quent periods.
H1b: Negative autocorrelations oc-curs between the first 30-minute interval of current closing re-turn and closing rere-turns for sub-sequent periods.
winner stocks will lead to abnormal returns, approximately about 15 per-cent. The winner-loser reversion is an impact of investor overreaction to new private information. Subsequently, the market carries out corrections during the next period through price rever-sion until the new equilibrium is achieved.
In market equilibrium, a security is expected to provide returns equiva-lent to the systematic risk. Investors, who initially try to avoid risk, decrease stock prices to below the level assured by the event. However, stock prices rise again due to the uncertainty of this information. Extreme changes in a certain stock price are followed by reversion. It means that investors react abundantly to the stock information such that stock prices tend to be incor-rectly estimated. Furthermore, the market usually adjusts through price reversion until the equilibrium is achieved (Debondt and Thaler 1985, 1987).
Overreaction hypothesis refers to the results of psychological applica-tion that states that human tends to be abundant (overreactive) to dramatic news or event (Claire and Thomas 1995). Market adjusts the pricing er-rors slowly. Debondt and Thaler (1987) divide portfolio into a portfolio group that consistently obtains earnings (win-ner) and the one that does not gain earnings (loser). The adjustment to the information occurs during the next period. If the adjustment conducted is short-term, significant, abundant, and
recurring, it is deemed to be overreac-tion. Nam et al. (2001) state that over-reaction does not occur in a long pe-riod of time; rather, it is partial or separate in its movement. Their results are consistent with Chen (1988) who argues that overreaction is not con-stant over time. Therefore, it can be hypothesized that.
H2a: Return reversion occurs be-tween winner and loser stocks after the first 30-minute inter-val of opening prices.
H2b: Return reversion occurs be-tween winner and loser stocks after the first 30-minute inter-val of closing prices.
Research Method
A set of sample is taken from companies in LQ45 index, from both first and second semesters of 2006. LQ45 comprises companies that have the highest liquidity. Consequently, companies included in this index can reduce the occurrence of not-traded stocks on trading days. The occur-rence of inactive stocks will deterio-rate the accuracy of this study. This sample is selected because Indonesia Stock Exchange is a thin capital mar-ket marked by numerous not-traded stocks.
Return
82
Gadjah Mada International Journal of Business, January - April 2009, Vol. 11, No. 1
logarithm of relative price Ri,30’,(t)= ln(Pi,30’,(t)/Pi,30’-1,(t)), where i indicates the company, [’] indicates minute, and
t indicates the day of each company. In order to calculate return for 30-minute interval for every company, price ar-rays on every trading day for every company are divided into 14 time in-tervals, and are formulated as follows:
Trading Time and Return
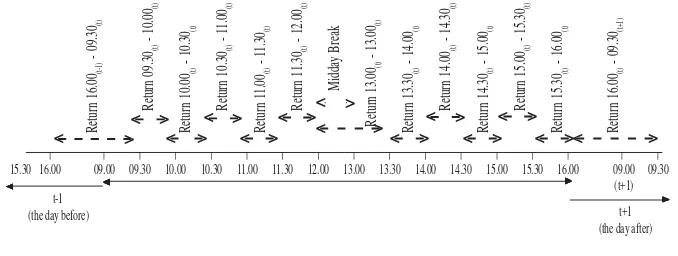
The trading time is different each day. The first trading session begins at 9:00 a.m. every day and closes at noon from Monday to Thursday, while on Friday the session closes at 11:30 a.m.
The second session opens at 1:30 pm from Monday to Thursday, and at 2:00
Interval return of 30’ of-01 : Ri,15.30(t-1)-16.00(t-1) = ln(/Pi,16.00(t-1) /Pi,15.30(t-1)) Interval return of 30’ of-02 : Ri,16.00(t-1)-09.30(t) = ln(Pi,09.30(t) /Pi,16.00(t-1)) Interval return of 30’ of-03 : Ri,09.30(t)-10.00(t) = ln(Pi,10.00(t) /Pi,09.30(t)) Interval return of 30’ of-04 : Ri,10.00(t)-10.30(t) = ln(Pi,10.30(t) /Pi,10.00(t)) Interval return of 30’ of-05 : Ri,10.30(t)-11.00(t) = ln(Pi,11.00(t) /Pi,10.30(t)) Interval return of 30’ of-06 : Ri,11.00(t)-11.30(t) = ln(Pi,11.30(t) /Pi,11.00(t)) Interval return of 30’ of-07 : Ri,11.30(t)-12.00(t) = ln(Pi,12.00(t) /Pi,11.30(t)) Interval return of 30’ of-08 : Ri,13.30(t)-13.00(t) = ln(Pi,13.30(t) /Pi,13.00(t)) Interval return of 30’ of-09 : Ri,14.00(t)-13.30(t) = ln(Pi,14.00(t) /Pi,13.30(t)) Interval return of 30’ of-10 : Ri,14.30(t)-14.00(t) = ln(Pi,14.30(t) /Pi,14.00(t)) Interval return of 30’ of-11 : Ri,15.00(t)-14.30(t) = ln(Pi,15.00(t) /Pi,14.30(t)) Interval return of 30’ of-12 : Ri,15.30(t)-15.00(t) = ln(Pi,15.30(t) /Pi,15.00(t)) Interval return of 30’ of-13 : Ri,16.00(t)-15.30(t) = ln(Pi,16.00(t) /Pi,15.30(t)) Interval return of 30’ of-14 : Ri, 09.30(t+1)-16.00(t) = ln(Pi, 09.30(t+1)/Pi,16.00(t))
Figure 1. Transaction Periods on the Indonesia Stock Exchange
>
p.m. on Friday. The second session closes at 4:00 p.m. daily. Figure 1 shows trading days and periods of trad-ing days related to the return for each 30-minute interval.
Basis Portfolio Adjustment and
Control
This study adjusts stock dividend, stock split, bonus share, and stock re-serve-split (left side and right side). Furthermore, this research creates port-folios for the test control to re-exam-ine the primary hypotheses. Market portfolio is created using equally-weighted method on daily basis.
Data Analysis
Data analysis is conducted with procedural steps as follows. First 14 price series are developed from intraday data that are priced based on the 30-minute time interval. Price in 30-minute disjointing deadline is used to calculate return. Second, return formed with Ri,30’,(t)=ln(Pi,30,(t)/Pi,30’-1,(t) is calculated; this is return at the period of 30-minute interval from the first until the 14th. Third 14 series of
30-minute interval returns are created from Monday to Friday to determine the sensitivity level to noise and overreac-tion occurrences. Examinaoverreac-tion is only focused on differentiating return for minute interval with the other 30-minute intervals. Fourth, days around dividend announcement are eliminated from the sample so as to avoid dra-matic price fluctuation (from three days
before to three days after). This study also adjusts dividend stocks, stock splits, stock bonuses, and reserve splits.
Fifth, autocorrelation between the first 30-minute interval for opening price return and 30-minute intervals for subsequent periods of opening price return is examined. Simultaneously, this research also tests autocorrelation between the 30-minute interval for closing price return and 30-minute in-tervals for closing price returns for subsequent periods. Sixth, sample is divided into three parts of portfolios according to opening price return, and three parts of portfolios based on clos-ing price return. Portfolios formed are those with the highest returns (winner stocks) at the percentile of 70 percent, middle returns at the percentile of 30 percent-70 percent, and the lowest re-turns (loser stocks) at the percentile of 30 percent. Next, the middle returns are elapsed from the analysis (DeBondt and Thaller 1985). Finally, t-test is conducted between winner and loser stocks to investigate the occurrence of price reversion.
Results and Analysis
The first part of this section ex-amines noise and overreaction by ana-lyzing return based on the 30-minute interval. The second and third parts
84
Gadjah Mada International Journal of Business, January - April 2009, Vol. 11, No. 1
Table 1. Descriptive Statistics
Return N Mean Std. Dev. Min. Max. Skewness
15.30(t-1)-16.00(t-1) 9,727 0.0042 0.0286 -0.7600 0.8300 1.3820 09.00-09.30 9,956 -0.0009 0.0182 -0.7000 0.3900 -12.5510 09.30-10.00 10,067 0.0005 0.0153 -0.5100 0.1200 -4.8460 10.00-10.30 9,202 -0.0006 0.0272 -1.3900 0.5100 -22.8740 10.30-11.00 8,661 0.0004 0.0312 -0.8500 1.4000 10.7550 11.00-11.30 8,329 0.0000 0.0275 -0.7600 0.8400 5.0960 11.30-12.00 6,483 0.0004 0.0180 -0.3700 0.5300 6.8910 12.00-13.30 6,694 -0.0005 0.0189 -0.9700 0.3400 -22.6490 13.30-14.00 9,415 -0.0004 0.0202 -0.4100 1.0100 12.7130 14.00-14.30 8,700 -0.0004 0.0361 -1.3900 0.8800 -17.0570 14.30-15.00 8,478 -0.0005 0.0398 -1.1200 1.3900 6.5380 15.00-15.30 8,820 -0.0003 0.0361 -0.7900 1.1200 8.4480 15.30-16.00 9,768 0.0042 0.0285 -0.7600 0.8300 1.3820 16.00-09.30(t+1) 9,956 -0.0009 0.0182 -0.7000 0.3900 -12.5510
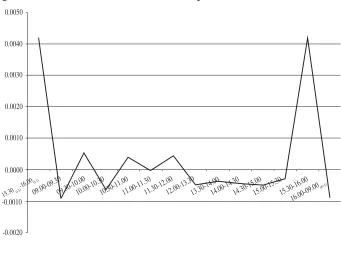
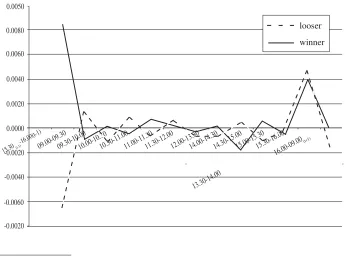
Figure 2. Mean ReturnBehavior - Full Sample
-0.0020 -0.0010 0.0000 0.0010 0.0020 0.0030 0.0040 0.0050
09.00-09.30 10.00-10.3010.30-11.0011.00-11.30 12.00-13.30
15.30 (t-1) -16.00(t-1)
09.30-10.00 11.30-12.00
16.00-09.00
(t+1)
Descriptive Statistics
Number of observations on each 30-minute interval is 10.845 except for returns at 12:00-1:30 p.m., which only have 8.820observations. This is caused by the difference in mid-day break on Friday. The observations are not entirely conducted, so some data have to be eliminated due to the ab-sence of transactions that cause low accuracy. Descriptive statistics indi-cate that the 30-minute intervals oc-curring in 2006 are highly varied. Mean of returns for the 30-minute interval with the lowest number residing in the closing prices of the day before 09:30 a.m. is equal to -0.00093. Mean of returns for the 30-minute interval with the lowest return is also located in the earliest 30-minute interval. The high-est mean of returns for the 30-minute interval residing at 3:30-4:00 p.m. is 0.00424. Conclusion inferred from this mean level has been shown on the basis of descriptive statistics: the high-est mean lays at the lathigh-est 30-minute interval on the final trading day. The findings show that returns increase dramatically on the end-trading day in comparison to all of other previous 30-minute intervals.
Standard deviation of each period of the 30-minute interval is estimated
in a relatively similar range. Minimum value, maximum value, and skewness, respectively, are presented in columns after the standard deviation column. Complete information is presented in Table 1. Returns increase at the day-end and the influence of trading day appears clearly in Figure 2. Mean of returns on the 30-minute interval on early trading day compared to that of the entire sample indicates that the first 30-minute interval has the lowest return. Meanwhile, mean of returns on the 30-minute interval during trading days compared to that of all sample indicates that in the latest 30 minutes, mean of returns increases dramatically and is the highest.
86
Gadjah Mada International Journal of Business,
January - April 2009, Vol. 11, No. 1
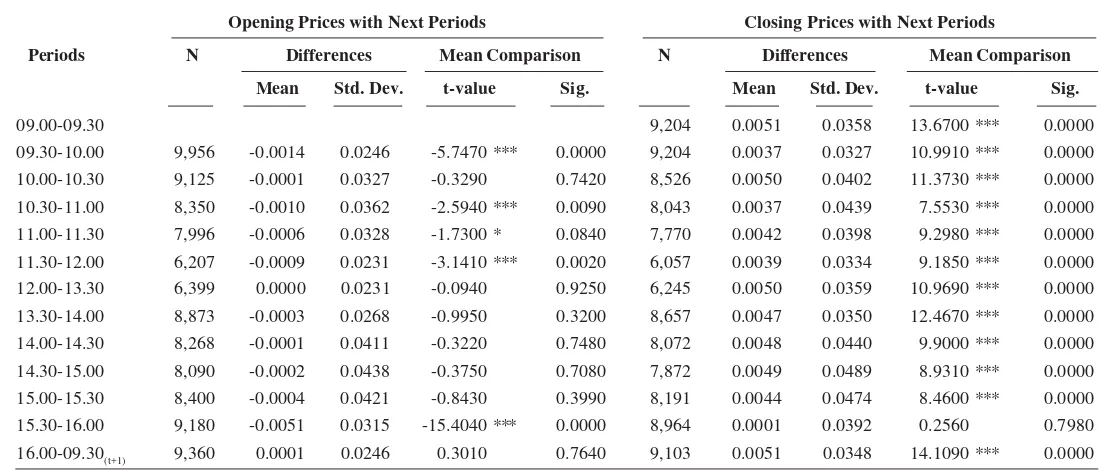
Table 2. Mean Comparison between Opening Prices and Closing Prices
Opening Prices with Next Periods Closing Prices with Next Periods
Periods N Differences Mean Comparison N Differences Mean Comparison
Mean Std. Dev. t-value Sig. Mean Std. Dev. t-value Sig.
09.00-09.30 9,204 0.0051 0.0358 13.6700 *** 0.0000
09.30-10.00 9,956 -0.0014 0.0246 -5.7470 *** 0.0000 9,204 0.0037 0.0327 10.9910 *** 0.0000
10.00-10.30 9,125 -0.0001 0.0327 -0.3290 0.7420 8,526 0.0050 0.0402 11.3730 *** 0.0000
10.30-11.00 8,350 -0.0010 0.0362 -2.5940 *** 0.0090 8,043 0.0037 0.0439 7.5530 *** 0.0000
11.00-11.30 7,996 -0.0006 0.0328 -1.7300 * 0.0840 7,770 0.0042 0.0398 9.2980 *** 0.0000
11.30-12.00 6,207 -0.0009 0.0231 -3.1410 *** 0.0020 6,057 0.0039 0.0334 9.1850 *** 0.0000
12.00-13.30 6,399 0.0000 0.0231 -0.0940 0.9250 6,245 0.0050 0.0359 10.9690 *** 0.0000
13.30-14.00 8,873 -0.0003 0.0268 -0.9950 0.3200 8,657 0.0047 0.0350 12.4670 *** 0.0000
14.00-14.30 8,268 -0.0001 0.0411 -0.3220 0.7480 8,072 0.0048 0.0440 9.9000 *** 0.0000
14.30-15.00 8,090 -0.0002 0.0438 -0.3750 0.7080 7,872 0.0049 0.0489 8.9310 *** 0.0000
15.00-15.30 8,400 -0.0004 0.0421 -0.8430 0.3990 8,191 0.0044 0.0474 8.4600 *** 0.0000
15.30-16.00 9,180 -0.0051 0.0315 -15.4040 *** 0.0000 8,964 0.0001 0.0392 0.2560 0.7980
16.00-09.30(t+1) 9,360 0.0001 0.0246 0.3010 0.7640 9,103 0.0051 0.0348 14.1090 *** 0.0000
Noise Tests
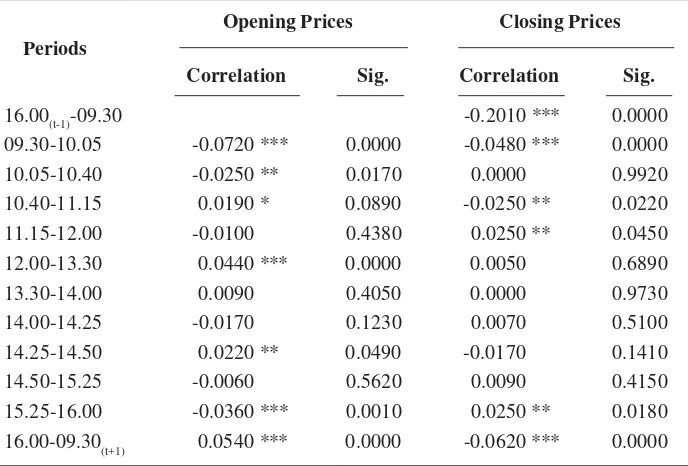
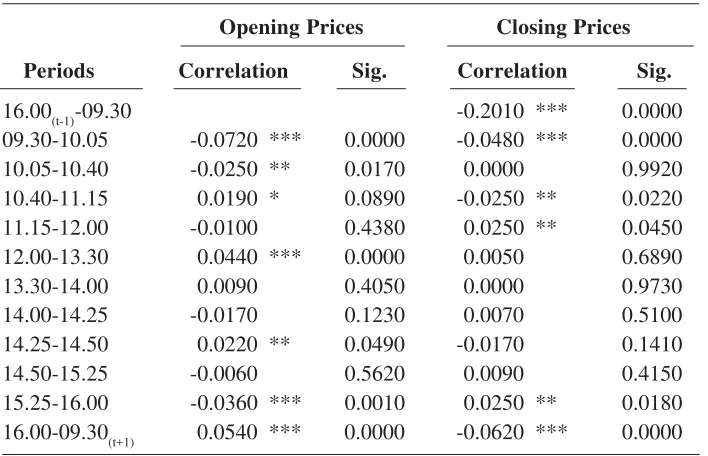
Noise analysis uses 14 series of returns. Furthermore, the series are added with opening or closing returns for the next days. Noise hypothesis defines that there is a difference in autocorrelation between opening pe-riod return and subsequent opening period returns. Negative autocorre-lation indicates noise occurrence whereas zero or positive autocorre-lation indicates information attributed to the volatility during the opening. The results of complete examination compared to entire sample are shown in Table 3.
Conclusion inferred from Table 3 is as follows. Opening price returns that have negative correlations are
shown by the 30-minute interval re-turns at 10:00 a.m., 12:00 p.m., 2:30 p.m., and 3:30 p.m. It means that there is price reversion of returns when com-pared to the first opening return. This indicates the occurrence of noise that takes place for opening prices auto-matically adjusted by investors in the subsequent periods. The hypothesis on the noise occurrence (H1a) for the opening return in correlation with cer-tain interval at subsequent periods is validly confirmed. Therefore, this re-search supports Steeley (2001). Mean-while, for the closing return, there is price reversion at the initial opening on the next day (return at 09:30 a.m.), 10:00 a.m., 3:30 p.m., and the next two-day opening period returns at 09:30t+1 (closing returns that are sym-Table 3. Noise Test Results for Opening Prices and Closing Prices
Opening Prices Closing Prices
Periods
Correlation Sig. Correlation Sig.
16.00(t-1)-09.30 -0.2010 *** 0.0000
09.30-10.05 -0.0720 *** 0.0000 -0.0480 *** 0.0000
10.05-10.40 -0.0250 ** 0.0170 0.0000 0.9920
10.40-11.15 0.0190 * 0.0890 -0.0250 ** 0.0220
11.15-12.00 -0.0100 0.4380 0.0250 ** 0.0450
12.00-13.30 0.0440 *** 0.0000 0.0050 0.6890
13.30-14.00 0.0090 0.4050 0.0000 0.9730
14.00-14.25 -0.0170 0.1230 0.0070 0.5100
14.25-14.50 0.0220 ** 0.0490 -0.0170 0.1410
14.50-15.25 -0.0060 0.5620 0.0090 0.4150
15.25-16.00 -0.0360 *** 0.0010 0.0250 ** 0.0180
16.00-09.30(t+1) 0.0540 *** 0.0000 -0.0620 *** 0.0000
88
Gadjah Mada International Journal of Business, January - April 2009, Vol. 11, No. 1
bolized with returns at 4:00t-1 p.m.).1
This indicates the noise occurrence in the correlation between closing return and closing returns for subsequent periods. Equally, hypothesis on noise (H1b) in the closing return in correla-tion with subsequent periods of 30-minute interval is validly supported.
Overreaction Test Results
Price reversion examination on winner-loser portfolios is conducted
by comparing return in formation pe-riod with return in test pepe-riod. Forma-tion period is the opening return (re-turn at 09:30 a.m.) and closing re(re-turn (4:00t-1 p.m.). Meanwhile, the exami-nation uses a comparison between opening price return or closing price return and the subsequent period re-turns for the 30-minute interval. If investors overreact, loser portfolio will outperform winner portfolio after the next formation period. Thus, it can be
1 The author is employ the mean comparison technique instead of regression. This study constructs paired data between opening price and closing price for all securities. Therefore, the regression technique could not be employed. However, the regression analysis for paired data, joined up between opening and closing for individual securities, could be read in “Noise as a Result of Trading Mechanism and Transaction Clearance Procedures: Substantive evidence from the Indonesia Stock Exchange,” forthcoming Journal of Indonesian Economy and Business, Faculty of Economics and Business, Universitas Gadjah Mada 24 (1) (January 2009)-publicly issued in July 2009.
13.30-14.00
Figure 3a. Return Behavior of Opening Prices of Winners and Losers
-0.0020 -0.0060 -0.0040 0.0000 0.0040 0.0060 0.0080 0.0050
09.00-09.30 10.00-10.3010.30-11.0011.00-11.30 12.00-13.30
15.30 (t-1) -16.00(t-1)
09.30-10.00 11.30-12.00
16.00-09.00
(t+1)
14.00-14.3014.30-15.0015.00-15.3015.30-16.00 0.0020
-0.0020
looser
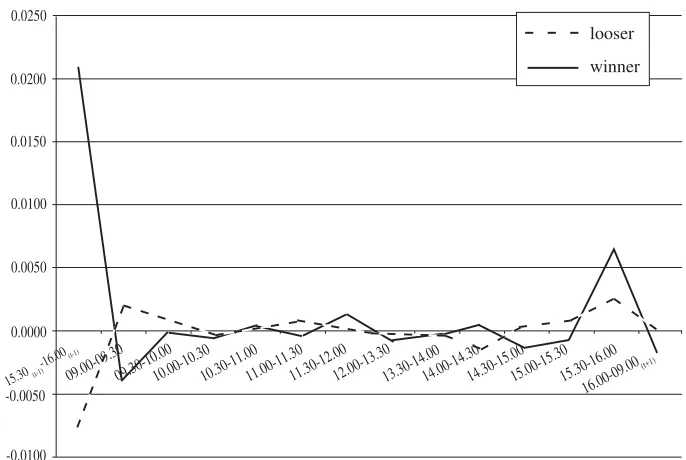
(0.0135) for the loser stocks and -0.0009 (0.0181) for the winner stocks. Posi-tive return differences are equal to 0.0022, indicating that there are big return differences for the loser stocks in comparison with the winner stocks. The test results for this period show that mean differences are statistically significant. Price reversion also oc-curs in the period of 09:30-10:00 a.m. caused by the higher prices of loser stocks in comparison with the winner stock prices. Besides the period of 10:00 a.m., price reversion phenom-enon also occurs in the periods of 11:00 a.m. and 2:30 p.m. Sequentially, price reversion phenomenon occurs in the return periods of 10:00 a.m., 11:00 a.m., and 2:30 p.m., which are the lowest winner stock prices in compari-Figure 3b. Return Behavior of Closing Prices of Winners and Losers
-0.0100 -0.0050 0.0000 0.0050 0.0100 0.0150 0.0200 0.0250
09.00-09.30 10.00-10.3010.30-11.0011.00-11.30 12.00-13.30
15.30 (t-1) -16.00(t-1)
09.30-10.00 11.30-12.00
16.00-09.00
(t+1)
13.30-14.0014.00-14.3014.30-15.0015.00-15.3015.30-16.00
looser
winner
concluded that RLos,T - RWin,T > 0. The statistical examination is conducted using the paired-sample t-test. Results of examination on each opening price and closing price returns are presented in Figures 3a and 3b.
90
Gadjah Mada International Journal of Business,
January - April 2009, Vol. 11, No. 1
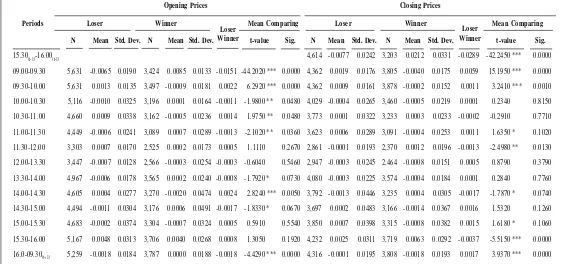
Table 4. Overreaction Test
Opening Prices Closing Prices
Periods Loser Winner Mean Comparing Loser Winner Mean Comparing
N Mean Std. Dev. N Mean Std. Dev. t-value Sig. N Mean Std. Dev. N Mean Std. Dev. t-value Sig.
15.30(t-1)-16.00(t-1) 4,614 -0.0077 0.0242 3,203 0.0212 0.0331 -0.0289 -42.2450 *** 0.0000 09.00-09.30 5,631 -0.0065 0.0190 3,424 0.0085 0.0133 -0.0151 -44.2020 *** 0.0000 4,362 0.0019 0.0176 3,805 -0.0040 0.0175 0.0059 15.1950 *** 0.0000 09.30-10.00 5,631 0.0013 0.0135 3,497 -0.0009 0.0181 0.0022 6.2920 *** 0.0000 4,362 0.0009 0.0161 3,878 -0.0002 0.0152 0.0011 3.2410 *** 0.0010 10.00-10.30 5,116 -0.0010 0.0325 3,196 0.0001 0.0164 -0.0011 -1.9800 ** 0.0480 4,029 -0.0004 0.0265 3,460 -0.0005 0.0219 0.0001 0.2340 0.8150 10.30-11.00 4,660 0.0009 0.0338 3,162 -0.0005 0.0236 0.0014 1.9750 ** 0.0480 3,773 0.0001 0.0322 3,233 0.0003 0.0233 -0.0002 -0.2910 0.7710 11.00-11.30 4,449 -0.0006 0.0241 3,089 0.0007 0.0289 -0.0013 -2.1020 ** 0.0360 3,623 0.0006 0.0289 3,091 -0.0004 0.0253 0.0011 1.6350 * 0.1020 11.30-12.00 3,303 0.0007 0.0170 2,525 0.0002 0.0173 0.0005 1.1110 0.2670 2,861 -0.0001 0.0193 2,370 0.0012 0.0196 -0.0013 -2.4980 ** 0.0130 12.00-13.30 3,447 -0.0007 0.0128 2,566 -0.0003 0.0254 -0.0003 -0.6040 0.5460 2,947 -0.0003 0.0245 2,464 -0.0008 0.0151 0.0005 0.8790 0.3790 13.30-14.00 4,967 -0.0006 0.0178 3,565 0.0002 0.0240 -0.0008 -1.7920 * 0.0730 4,080 -0.0003 0.0225 3,574 -0.0004 0.0184 0.0001 0.2840 0.7760 14.00-14.30 4,605 0.0004 0.0277 3,270 -0.0020 0.0474 0.0024 2.8240 *** 0.0050 3,792 -0.0013 0.0446 3,235 0.0004 0.0305 -0.0017 -1.7870 * 0.0740 14.30-15.00 4,494 -0.0011 0.0304 3,176 0.0006 0.0491 -0.0017 -1.8330 * 0.0670 3,697 0.0002 0.0483 3,166 -0.0014 0.0367 0.0016 1.5320 0.1260 15.00-15.30 4,683 -0.0002 0.0374 3,304 -0.0007 0.0324 0.0005 0.5910 0.5540 3,850 0.0007 0.0398 3,315 -0.0008 0.0382 0.0015 1.6180 * 0.1060 15.30-16.00 5,167 0.0048 0.0313 3,706 0.0040 0.0268 0.0008 1.3050 0.1920 4,232 0.0025 0.0311 3,719 0.0063 0.0292 -0.0037 -5.5150 *** 0.0000 16.0-09.30(t+1) 5,259 -0.0018 0.0184 3,787 0.0000 0.0188 -0.0018 -4.4290 *** 0.0000 4,316 -0.0001 0.0195 3,808 -0.0018 0.0193 0.0017 3.9370 *** 0.0000
Note: *significant at level 10.00%; **significant al level 5.00%; ***significant at level 1.00%
Loser Winner
son with loser stock prices.2 This shows
that investors overreact to the opening prices. Therefore, overreaction hypoth-esis (H2a) is validly supported.
For the closing price return, this phenomenon occurs at early trading (return periods of 09:30 and 10:00 a.m.), and is close to the nontrading period (return periods of 11:30 a.m. and 3:30 p.m.). The examination re-sults can be seen in Figure 3, showing loser stock returns in comparison with winner stock returns. If the actual dif-ferences are positives, it means that the overreaction phenomenon occurs. Therefore, hypothesis of overreaction (H2b) is also substantiated.
The results suggest that stocks that are losers at first show higher performance than do stocks that are winners at first. The reversal behavior indicates that there is overreaction caused by the return reversion phe-nomenon. Overreaction hypothesis reveals that market overreacts to all information. It means that market over-reacts to new information and disre-gards all the previous information. Hence, return reversion occurs when market realizes that it has incorrectly responded to the new information, and then corrects it in the next period.
Trading Days Sensitivity Tests
The occurrences of nontrading periods have an effect on opening price return (Lam and Barrel 1999). This is caused by the prevalence of unequal nontrading sessions among days (Fri-day closing until Mon(Fri-day opening). Rogalsky (1984) using NYSE data and Sumiyana (2007a) using Indonesia Stock Exchange data show that occur-rence of Monday effect really exists because of the prevalence of excessive negative mean returns from Friday clos-ing to Monday closclos-ing periods (non-trading weekend effect). Based on his study, nontrading weekend return dif-fers significantly from other returns during nontrading periods. Those stud-ies conclude that excessive negative returns during overnight nontrading session are caused by long duration of nontrading weekend effect. Therefore, analysis regarding this opening price return has to include trading day as a control variable.
Besides the opening price return, Cheung (1995) states that closing price return is also sensitive to day-end week-end effects. Investors desire to do more transactions on Monday relative to other trading days. Therefore, transac-tion activities on Monday are higher
2 The data employed for this examination also could not be incorporated by regression
92
Gadjah Mada International Journal of Business,
January - April 2009, Vol. 11, No. 1
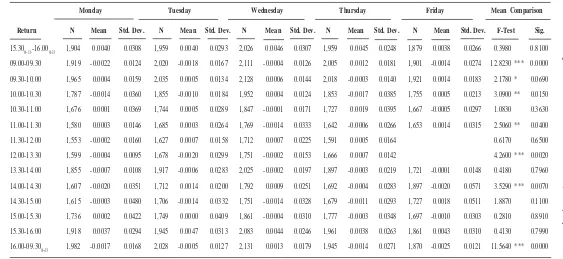
Monday Tuesday Wednesday Thursday Friday Mean Comparison
Return N Mean Std. Dev. N Mean Std. Dev. N Mean Std. Dev. N Mean Std. Dev. N Mean Std. Dev. F-Test Sig.
15.30(t-1)--16.00(t-1) 1,904 0.0040 0.0308 1,959 0.0040 0.0293 2,026 0.0046 0.0307 1,959 0.0045 0.0248 1,879 0.0038 0.0266 0.3980 0.8100
09.00-09.30 1,919 -0.0022 0.0124 2,020 -0.0018 0.0167 2,111 -0.0004 0.0126 2,005 0.0012 0.0181 1,901 -0.0014 0.0274 12.8230 *** 0.0000
09.30-10.00 1,965 0.0004 0.0159 2,035 0.0005 0.0134 2,128 0.0006 0.0144 2,018 -0.0003 0.0140 1,921 0.0014 0.0183 2.1780 * 0.0690
10.00-10.30 1,787 -0.0014 0.0360 1,855 -0.0010 0.0184 1,952 0.0004 0.0124 1,853 -0.0017 0.0385 1,755 0.0005 0.0213 3.0900 ** 0.0150
10.30-11.00 1,676 0.0001 0.0369 1,744 0.0005 0.0289 1,847 -0.0001 0.0171 1,727 0.0019 0.0395 1,667 -0.0005 0.0297 1.0830 0.3630
11.00-11.30 1,580 0.0003 0.0146 1,685 0.0003 0.0264 1,769 -0.0014 0.0333 1,642 -0.0006 0.0266 1,653 0.0014 0.0315 2.5060 ** 0.0400
11.30-12.00 1,553 -0.0002 0.0160 1,627 0.0007 0.0158 1,712 0.0007 0.0225 1,591 0.0005 0.0164 0.6170 0.6500
12.00-13.30 1,599 -0.0004 0.0095 1,678 -0.0020 0.0299 1,751 -0.0002 0.0153 1,666 0.0007 0.0142 4.2600 *** 0.0020
13.30-14.00 1,855 -0.0007 0.0108 1,917 -0.0006 0.0283 2,025 -0.0002 0.0197 1,897 -0.0003 0.0219 1,721 -0.0001 0.0148 0.4180 0.7960
14.00-14.30 1,607 -0.0020 0.0351 1,712 0.0014 0.0200 1,792 0.0009 0.0251 1,692 -0.0004 0.0283 1,897 -0.0020 0.0571 3.5290 *** 0.0070
14.30-15.00 1,615 -0.0003 0.0480 1,706 -0.0014 0.0332 1,751 -0.0014 0.0328 1,679 -0.0011 0.0293 1,727 0.0018 0.0511 1.8870 0.1100
15.00-15.30 1,736 0.0002 0.0422 1,749 0.0000 0.0409 1,861 -0.0004 0.0310 1,777 -0.0003 0.0348 1,697 -0.0010 0.0303 0.2810 0.8910
15.30-16.00 1,918 0.0037 0.0294 1,945 0.0047 0.0313 2,083 0.0044 0.0246 1,961 0.0038 0.0263 1,861 0.0043 0.0310 0.4130 0.7990
16.00-09.30(t+1) 1,982 -0.0017 0.0168 2,028 -0.0005 0.0127 2,131 0.0013 0.0179 1,945 -0.0014 0.0271 1,870 -0.0025 0.0121 11.5640 *** 0.0000
compared to the other days. Investors with higher motivation to sell than to buy stocks trigger stock prices to be lower. The lowest stock return occurs on Monday trading activities caused by long weekend effect. Investors tend to sell stocks instead of buying. On Monday, market usually faces surplus sell order, which is the accumulation of sell order during closed market on Friday weekend (Lakonishok and Maberly 1990). Therefore, trading day is used as a control variable.
Table 5 displays descriptive sta-tistics based on trading day’s sensitiv-ity. This table indicates that opening price returns at 09:00 a.m. in compari-son to other interval price returns are lower, with value of -0.0022. The low-est returns on Monday occur at 12:00 a.m., 2:00 p.m., and 2.30 p.m. It can be inferred that Monday effect phenom-enon occurs in the opening price re-turn. For the closing price return, Mon-day closing return is relatively lower in comparison with those for the other days, but the differences are not sig-nificant. Appendix 1 presents the mean comparison tests, indicating lower opening price return in comparison with those for the other periods and increasing closing price returns by the end of the trading day.
Appendix 2 indicates that noise occurs in opening price return on the Indonesia Stock Exchange. The noise occurrence is shown by negative cor-relation between opening price return and the next opening price returns.
94
Gadjah Mada International Journal of Business, January - April 2009, Vol. 11, No. 1
Based on trading day as a sensitiv-ity test, the examination on price re-version phenomenon between loser and winner stocks due to overreaction pro-vides evidence that loser stocks have the lowest returns in the opening and closing periods. Hereinafter, they be-come better in the next periods while the winner stocks could not get any higher. It means that winner stock re-turns are degraded in the next exami-nation periods. In other words, winner (loser) stocks at the closing and open-ing sessions become significantly lower (higher) in the opening price period in comparison with loser (win-ner) stocks in the next opening price. Examination results are presented in Appendix 3.
Appendix 3 shows the occurrence of price reversion phenomenon for opening and closing price returns be-tween loser and winner stocks using the 30-minute interval. On Monday, price reversion occurs in the return of 10:00 a.m. The difference is big enough for loser and winner stocks, which is equal to (t-value) of 0.0009 (0.0145) for the loser stocks and -0.0008 (0.0191) for the winner stocks. Mean return difference is positive (loser– winner) where returns in examination period are bigger for the loser stocks in comparison with those for the winner stocks. On Tuesday, price reversion occurs in return periods of 10:00 a.m., 1200 p.m., and 3:30 p.m. Wednesday’s price reversion occurs in return period of 10:00 a.m. Thursday’s price rever-sion occurs in return period of 10:00 a.m. Finally, Friday’s return reversion
occurs in return periods of 10:00 a.m. and 2:30 p.m. Those indicates that overreaction phenomenon on the In-donesia Stock Exchange prevails only in relatively short-term periods be-cause this phenomenon occurs at the time of opening price return followed by the return period of 10:00 a.m. In addition to the closing price, this phe-nomenon also occurs on early trading days. Overreaction always occurs at the first 30-minute interval of the trad-ing day.
Robustness Tests with Different
Interval
This study examines the re-sults of the first part with extension into a longer period of 35-minute in-terval. First of all, this study shows descriptive statistics for the longer period of 35-minute interval in Table 6. Morning trading returns are a com-posite of the periods of 9:30-10:05 a.m., 10:05-10:40 a.m., 10:40-11:15 a.m., and 11:15 a.m.-12:00 p.m. Mean-while, afternoon trading returns are a composite of two day-end periods of 3:25-4:00 p.m. and 2:50-3:25 p.m. It could be inferred that there are no dominant differences between 30-min-utes interval and 35-minute interval. In other words, they are relatively equal in means, standard deviations, mini-mum values, maximini-mum values, and skewness.
Table 6. Descriptive Statistics – 35-Minutes Interval
Return N Mean Std. Dev. Min. Max. Skewness
15.25(t-1)-16.00(t-1) 9,667 0.0033 0.0243 -0.5900 0.7400 3.6940
16.00(t-1)-09.30 9,956 -0.0009 0.0182 -0.7000 0.3900 -12.5510
09.30-10.05 9,924 0.0006 0.0153 -0.2900 0.1200 -1.5920
10.05-10.40 9,225 -0.0006 0.0254 -1.4000 0.3000 -27.5080
10.40-11.15 8,751 0.0004 0.0274 -0.7700 1.4000 20.4630
11.15-12.00 6,574 0.0000 0.0185 -0.8400 0.4100 -12.5450
12.00-13.30 6,694 -0.0005 0.0189 -0.9700 0.3400 -22.6490
13.30-14.00 9,415 -0.0004 0.0202 -0.4100 1.0100 12.7130
14.00-14.25 8,289 -0.0005 0.0350 -1.3900 0.8800 -19.8220
14.25-14.50 8,478 -0.0005 0.0398 -1.1200 1.3900 6.5380
14.50-15.25 8,464 0.0005 0.0431 -0.7200 2.7700 32.6220
15.25-16.00 9,711 0.0033 0.0243 -0.5900 0.7400 3.6970
16.00-09.30(t+1) 9,956 -0.0009 0.0182 -0.7000 0.3900 -12.5510
Table 7. Means Comparisons – 35-Minutes Interval
Opening Prices with Next Periods
Differences Mean Comparison
Periods N Mean Std. Dev. t-value Sig.
16.00(t-1)-09.30
09.30-10.05 9,814 -0.0015 0.0247 -6.1900 *** 0.0000
10.05-10.40 9,073 -0.0002 0.0315 -0.5210 0.6020
10.40-11.15 8,377 -0.0011 0.0326 -3.1140 *** 0.0020
11.15-12.00 6,296 -0.0007 0.0207 -2.7420 *** 0.0060
12.00-13.30 6,399 0.0000 0.0231 -0.0940 0.9250
13.30-14.00 8,873 -0.0003 0.0268 -0.9950 0.3200
14.00-14.25 7,882 -0.0001 0.0403 -0.1240 0.9010
14.25-14.50 8,090 -0.0002 0.0438 -0.3750 0.7080
14.50-15.25 8,049 -0.0011 0.0471 -2.1510 ** 0.0320
15.25-16.00 9,103 -0.0042 0.0297 -13.6570 *** 0.0000
96
Gadjah Mada International Journal of Business, January - April 2009, Vol. 11, No. 1
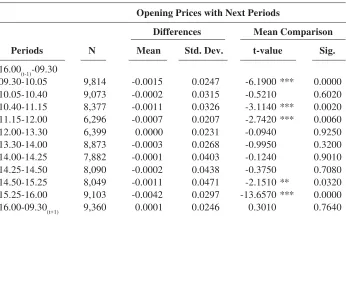
the lowest returns. The first in-terval’s opening price returns have differed significantly in comparison with open-ing price returns for the next periods at the intervals of 10:05, 10:40, and 11:15 a.m. Means comparison tests also show that closing price returns always in-creases at the end of the trading day. This study concludes that 35-minute interval examination results are con-sistent with those for 30-minutes inter-val. Therefore, descriptive statistics shows robustness test results.
Opening price returns that have negative correlations are shown by 35-minute interval returns at 9:30 a.m., 10:05 a.m., and 3:25 p.m. in Table 8. It means that there is price reversion in
these returns compared to the first open-ing return. This indicates that noise takes place in opening prices, and is automatically adjusted by investors in the subsequent periods. The hypoth-esis on the noise occurrence (H1a) that the opening returns are correlated with certain interval at subsequent periods is validly confirmed. Meanwhile, for the closing return, there is also price reversion. Equally, hypothesis on noise (H1b) that the closing returns are cor-related with subsequent periods of 35-minute interval is validly supported. This study concludes that noise test results with longer time interval are coherent with the results for the 30-minutes interval.
Continued from Table 7
Closing Prices with Next Periods
Differences Mean Comparison
Periods N Mean Std. Dev. t-value Sig.
16.00(t-1)-09.30 9,118 0.0043 0.0325 12.5880 *** 0.0000
09.30-10.05 9,118 0.0028 0.0289 9.3220 *** 0.0000
10.05-10.40 8,586 0.0039 0.0347 10.3100 *** 0.0000
10.40-11.15 8,178 0.0028 0.0361 6.9120 *** 0.0000
11.15-12.00 6,183 0.0034 0.0291 9.1660 *** 0.0000
12.00-13.30 6,186 0.0040 0.0288 10.8380 *** 0.0000
13.30-14.00 8,589 0.0039 0.0310 11.6170 *** 0.0000
14.00-14.25 7,747 0.0038 0.0414 8.0370 *** 0.0000
14.25-14.50 7,810 0.0038 0.0469 7.2610 *** 0.0000
14.50-15.25 7,903 0.0027 0.0482 4.9220 *** 0.0000
15.25-16.00 8,953 0.0001 0.0332 0.3010 0.7640
16.00-09.30(t+1) 9,033 0.0043 0.0315 12.8970 *** 0.0000
Table 9 shows the test results of overreaction with the 35-minute inter-val. During 09:30-10:05 a.m., price reversion phenomenon occurs in open-ing price return between loser and win-ner stocks by a formation period of the next 35-minute interval. Great return reversion for both loser and winner stocks is equal to 0.0014 (0.0142) for the loser stocks and -0.0006 (0.0173) for the winner stocks. Positive return differences are equal to 0.0021, indi-cating that there are big return differ-ences for the loser stocks compared to winner stocks, and they are statisti-cally significant at the level of 1 per-cent. Price reversion phenomenon also occurs in return period of 2:25-2:50 p.m. Sequentially, price reversion phe-nomenon occurs in return period of
3:25-4:00 p.m., which is lower for the winner stock prices than for the loser stock prices. This shows that investors overreact at the time of opening price on early trading day. Therefore, over-reaction hypothesis (H2a) is validly supported.
For the closing price return, this phenomenon occurs in early trading return periods of 09:30 and 10:05 a.m., and is close to the nontrading period of 4:00 p.m. Therefore, the hypothesis on overreaction (H2b) is also validly con-firmed. For all overreaction tests, this study concludes that overreaction test results are consistent both with 30-minutes interval and with longer inter-val. Therefore, overreaction tests show robust results.
Table 8. Noise – 35-Minutes Interval
Opening Prices Closing Prices
Periods Correlation Sig. Correlation Sig.
16.00(t-1)-09.30 -0.2010 *** 0.0000
09.30-10.05 -0.0720 *** 0.0000 -0.0480 *** 0.0000
10.05-10.40 -0.0250 ** 0.0170 0.0000 0.9920
10.40-11.15 0.0190 * 0.0890 -0.0250 ** 0.0220
11.15-12.00 -0.0100 0.4380 0.0250 ** 0.0450
12.00-13.30 0.0440 *** 0.0000 0.0050 0.6890
13.30-14.00 0.0090 0.4050 0.0000 0.9730
14.00-14.25 -0.0170 0.1230 0.0070 0.5100
14.25-14.50 0.0220 ** 0.0490 -0.0170 0.1410
14.50-15.25 -0.0060 0.5620 0.0090 0.4150
15.25-16.00 -0.0360 *** 0.0010 0.0250 ** 0.0180
98
Gadjah Mada International Journal of Business, January - April 2009, Vol. 11, No. 1
Table 9. Overreactions – 35-Minutes Interval
Opening Prices
Loser Winner Mean Comparison
Loser
-Periods N Mean Std. Dev. N Mean Std. Dev. Winner t-value Sig.
15.25(t-1)-16.00(t-1)
16.00(t-1)-09.30 5,631 -0.0065 0.0190 3,424 0.0085 0.0133 -0.0151 -44.2020 *** 0.0000 09.30-10.05 5,537 0.0014 0.0142 3,459 -0.0006 0.0173 0.0021 5.9160 *** 0.0000 10.05-10.40 5,075 -0.0004 0.0270 3,263 -0.0010 0.0258 0.0006 0.9950 0.3200
10.40-11.15 4,660 0.0003 0.0286 3,252 0.0006 0.0288 -0.0003 -0.4250 0.6710
11.15-12.00 3,368 0.0004 0.0157 2,537 -0.0003 0.0228 0.0007 1.3860 0.1660 12.00-13.30 3,447 -0.0007 0.0128 2,566 -0.0003 0.0254 -0.0003 -0.6040 0.5460
13.30-14.00 4,967 -0.0006 0.0178 3,565 0.0002 0.0240 -0.0008 -1.7920 * 0.0730 14.00-14.25 4,369 0.0003 0.0263 3,136 -0.0018 0.0471 0.0021 2.4750 ** 0.0130
14.25-14.50 4,494 -0.0011 0.0304 3,176 0.0006 0.0491 -0.0017 -1.8330 * 0.0670 14.50-15.25 4,468 0.0004 0.0337 3,192 0.0004 0.0565 0.0000 0.0130 0.9890
15.25-16.00 5,108 0.0043 0.0270 3,721 0.0025 0.0223 0.0017 3.3120 *** 0.0010
16.00-09.30(t+1) 5,259 -0.0018 0.0184 3,787 0.0000 0.0188 -0.0018 -4.4290 *** 0.0000
Closing Prices
15.25(t-1)-16.00(t-1) 4,903 -0.0064 0.0197 3,221 0.0178 0.0286 -0.0242 -42.0530 *** 0.0000 16.00(t-1)-09.30 4,608 0.0022 0.0173 3,875 -0.0044 0.0173 0.0065 17.3380 *** 0.0000 09.30-10.05 4,608 0.0015 0.0146 3,806 -0.0004 0.0161 0.0018 5.4810 *** 0.0000
10.05-10.40 4,330 -0.0007 0.0249 3,442 0.0000 0.0143 -0.0007 -1.4140 0.1570 10.40-11.15 4,089 0.0006 0.0253 3,239 -0.0002 0.0213 0.0008 1.4230 0.1550
11.15-12.00 3,068 0.0000 0.0202 2,370 0.0002 0.0192 -0.0001 -0.2660 0.7900
12.00-13.30 3,072 -0.0005 0.0239 2,486 -0.0005 0.0153 -0.0001 -0.1180 0.9060 13.30-14.00 4,322 -0.0001 0.0218 3,635 -0.0005 0.0198 0.0004 0.8430 0.3990
14.00-14.25 3,892 -0.0013 0.0429 3,058 0.0002 0.0285 -0.0015 -1.7010 * 0.0890 14.25-14.50 3,934 -0.0001 0.0472 3,196 -0.0012 0.0371 0.0010 1.0160 0.3100
14.50-15.25 3,970 0.0000 0.0293 3,140 0.0010 0.0613 -0.0010 -0.8310 0.4060 15.25-16.00 4,520 0.0029 0.0217 3,688 0.0045 0.0294 -0.0016 -2.7250 *** 0.0060
16.00-09.30(t-1) 4,583 -0.0002 0.0191 3,870 -0.0021 0.0191 0.0018 4.4040 *** 0.0000
Findings
This research examines returns on opening and closing prices on trad-ing days to test the validity of noise and overreaction occurrences. Results conclude that noise occurrence is indi-cated by negative autocorrelation val-ues. According to noise hypothesis, stock price behavior whose prices are not caused by fundamental values will move back to their fundamental values in the next periods. Therefore, return series would have negative correla-tions.
Noise occurrence is re-examined. The re-examinations are based on trad-ing day sensitivity tests. The test re-sults show that noise occurrence really exists, indicated by negative autocor-relations between opening price return (09:30 a.m.) and those for the next periods after the first 30-minute inter-val. Noise occurrence also exists for the negative correlation between clos-ing price return and those for the next periods after the first 30-minute inter-val. In general, noise correction occurs in return period of 10:00 am (period of 09:30-10:00 a.m.), except for Wednes-day anomaly where correction occurs in return period of 11:00 a.m. (10:30-11:00 a.m.). Meanwhile, for the clos-ing price return on tradclos-ing days, nega-tive autocorrelation values are statisti-cally significant for the relationship between closing price return and the next period returns on early trading day (return periods of 09:30 and 10:00 a.m.). Furthermore, the existence of noise indicated at the end of trading
day is always adjusted by investors on the next early trading day.
This study examines the re-sults to check for robustness by length-ening time interval into 35-minute in-terval. Noise really prevails for the negative correlation between opening price return at the first next 35-minute interval and subsequent intervals. Noise occurs at 9:30-10:05 a.m., 2:00-2:25 p.m., and 3:25-4:00 p.m. Noise for closing price return occurs at 9:30 a.m., 10:05 a.m., and 4:00 p.m. Fur-thermore, noise correction occurs in opening price return periods of 9:30-10:05 a.m. and 3:25-4:00 p.m., and in closing price returns at 9:30-10:05 a.m. and 4:00 pm (period of 4:00 p.m.-9:30(t+1) a.m.).
This research also finds the oc-currence of price reversion phenom-enon in portfolios after opening and closing sessions. Examination results of overreaction hypothesis support the hypothesis that there is return rever-sion phenomenon in comparison with the biggest loser stocks and winner stock returns at the first 30-minute interval on trading day. Additional evidence shows that return reversion phenomenon is also robust to the longer period. It is at the first 35-minute inter-val on trading day. Therefore, this phe-nomenon signifies that high contrarian profit strategies are chosen by inves-tors.
100
Gadjah Mada International Journal of Business, January - April 2009, Vol. 11, No. 1
actions for both phenomena occur at the first 30-minute interval on trading day. Investors have to behave conser-vatively at the first 30 minutes and at the end of the trading day. Further-more, re-examination using a longer duration, 35-minute interval, shows consistent results. It is proven that closing price and opening price re-turns indicate the existence of overre-action. Hence, research concerning stock prices shall not utilize opening prices or closing prices only. Both the opening and closing prices do not re-flect the fundamental values such that they have to be examined simulta-neously.
Conclusions and Limitations
This study finds that the pattern of noiseand overreaction always occurs in opening and closing prices. The noise occurrence is highlighted as there is information arrival on the Indonesia Stock Market. Detailed patterns are as follows. In the first pattern, noise and overreaction occur in the opening and closing prices during the initial 30-minute interval on the Indonesia Stock Exchange. In the second pattern, in-vestors act to adjust for both this noise and overreaction, and this processalso occurs at the initial 30-minute interval at the first trading session on every trading day. The results of noise and overreaction examinations using the 35-minute interval are coherent with the results of the first examination.
The results of this study have some implications for investors trading on
the Indonesia Stocks Exchange. They should be concerned about timing to buy and sell. After recognizing the noise and overreaction occurrences, investors have trade in a high alert at the first 30-minute interval during the first trading session. This study rec-ommends that because of the occur-rences of noise and overreaction dur-ing the first 30-minute interval, inves-tors should delay their transactions. They can execute trading only if they have private information. However, the best strategy for investor is the contrarian strategy by which they can sell winner stocks during the first 30-minute interval and then buy the stocks during the next 30-minute interval. In addition, they can buy loser stocks during the first 30-minute interval and then sell the stocks during the next 30-minute interval.
References
Admati, A., and P. Pflederer. 1988. A theory of intraday patterns: Volume and price variability. The Review of Financial Studies 1 (1): 3-40.
Amihud, Y., and H. Mendelson. 1986. Asset pricing and the bid-ask spread. Journal of Financial Economics 17: 223-249.
___________. 1987. Trading mechanism and stock return: An empirical investigations. Journal of Finance 42: 533-53.
___________. 1991. Volatility, efficiency and trading: Evidence from the Japanese Stock Market. Journal of Finance 46: 369-89.
Balduzzi, P., E. J. Elton , and T. C. Green. 2001. Economic news and bond prices: Evidence from the US Treasury Market. Journal of Financial and Quantitative Analysis 36 (4): 523-543.
Bery, T. D., and K. M. Howe. 1994. Public information arrival. Journal of Finance 49: 1331-1347.
Black, F. 1986. Noise.Journal of Finance 41: 529-543.
Blume, L., D. Easley, and O’Hara. 1994. Market statistics and technical analysis: The role of volume. Journal of Finance 49 (1): 153-181.
Chan, K., M. Chockalingam, and K. W. L. Lai. Overnight information and intraday trading behavior: Evidence from NYSE cross-listed stocks and their local market informa-tion. Journal of Multinational Financial Management 10 (3) (December): 495-509. Chan, K. C., W. G. Christie., and P. H. Schultz. 1995. Market structure and the intraday pattern of bid-ask spreads for Nasdaq Securities. Journal of Business 68 (1): 35-60. Chang, R. P., T. H. Hsu, N. K. Huang, and S. G. Rhe. 1999. The effect of trading methods on volatility and liquidity: Evidence from Taiwan Stock Exchange. Journal of Business Finance and Accounting 26 (1): 137-170.
Chen, C. R., D. A. Sauer. 1997. Is stock market overreaction persistent over time? Journal Business Finance and Accounting 24 (1): 51- 67.
Cheung, Y. L. 1995. Intraday return and the day end effect: Evidence from the Hong Kong equity market. Journal of Business Finance and Accounting 22 (7): 1023-1034. Claire, A., and S. Thomas. 1995. The overreaction hypothesis and the UK stock market.
Journal of Business Finance and Accounting 22 (7): 961-973.
DeBondt, W. F. M., and R. Thaler.1985. Does the stock market overreact? Journal of Finance 40: 793-807.
___________. 1987. Further evidence on investor overreaction and stock market season-ality? Journal of Finance 42: 557- 581.
De Long, J.B., A. Shleifer, L. H. Summers, and E. J. Waldmann. 1990. Noise trader risk in financial markets. Journal of Political Economy 98 (4): 703-739.
102
Gadjah Mada International Journal of Business, January - April 2009, Vol. 11, No. 1
Fama, E. F. 1970. Efficient capital market: A review of theory and empirical work. Journal of Finance: 25: 387-417.
___________. 1991. Efficient Capital Markets II. Journal of Finance 46 (51): 575-617. ___________, and French. 1992. The cross section of expected return.Journal of Finance
47: 427-465.
Foster, F D., and S. Viswanathan. 1993. Variations in trading volume, return volatility and trading costs: Evidence on recent price formations models.Journal of Finance: 48 (March): 187-211.
French, K. R., and R. Roll. 1986. Stock price variances: The arrival of information and the reaction traders. Journal of Financial Economics 17: 5-26.
Gibbons, M. R., and P. Hess. 1981. Day of the week effect and asset returns. Journal of Business 54: 579-596.
Guner, N., and Z. Onder. 2002. Information and volatility: Evidence from an emerging market. Emerging Markets Finance and Trade 36 (6): 26-46.
Harris, L. 1986a. A transaction data study of weekly and intraday patterns in stock returns. Journal of Financial Economics 8: 55-69.
___________. 1986b. Cross-security test of the mixture of distribution hypothesis. Journal of Financial and Quantitative Analysis 21: 39-46.
___________. 1989. A day-end transaction price anomaly. Journal of Financial and Quantitative Analysis 24: 29-45.
___________, and E. Gurel. 1986. Price and volume effects associated with changes in the SandP 500 lists: A new evidence for the existence of price pressure. Journal of Finance 16 (September): 815-829.
Ho, Y. K. 1990. Stock return seasonality’s in Asia Pacific market. Journal of Financial Management and Accounting 2 (1): 47-77.
________, and Y. L. Cheung. 1991. Behaviour of intra-daily return on Asian Emerging Market - Hongkong. Applied Economics 23 (6): 957-966.
Huang, Y-S., D-Y Liu, and T. W. Fu. 2000. Stock price behaviour over trading and non-trading periods: Evidence from the Taiwan Stock Exchange. Journal Business and Financial Accounting 51: 575-602.
Prem C. J., and G-H. Jon. 1988. The dependence between hourly prices and trading volume. Journal of Financial and Quantitative Analysis 22: 109-126.
Ko, K., S. Lee and J. Chung. 1995. Volatility, efficiency and trading: Further evidence. Journal of International Financial Management and Accounting 6 (1): 26-42. Lakonishok, J., and E. Maberly. 1990. The weekend effect: Trading patterns of individual
and institutional investors. Journal of Finance 45: 231-243.
Lam, P.H.L., and W. H. S. Tong. 1999. Inter daily volatility in a continuous order driven market.Journal of Business Finance and Accounting 26 (7): 1013-1036.
Miller, E. M. 1989. Explaining intraday and overnight price behaviour. Journal of Portfolio Management 15 (4): 10-16.
Mok, M. K. 1988. Opening and quarter-hour intraday seasonality’s in Hong Kong’s Stock Market: Pre- and post-market crash. Working Papers (WP-88-06). Hong Kong: Faculty of Business Administration, University of Hong Kong.
Nam, K., C. S. Pyun, and S. L. Avard. 2001. Asymmetric reverting behavior of short horizon stock returns: An evidence of stock market overreaction. Journal of Banking and Finance 25 (4): 807-824.
Odean, T. 1998. Volume, volatility, price and profit when all traders are above average. Journal of Finance 53 (6): 1887-1934.
Rogalski, R. J. 1984. New finding regarding day of the week return over trading and non trading periods: A note. Journal of Finance 34 (5): 1603-1614.
Steeley-C. 2001. Opening returns, noise and overreaction. Journal of Financial Research 24 (4): 513-521.
Sumiyana. 2007a. Monday effect: logical reasoning caused from psychological effect, nontrading period effect, or combination of both factors (empirical study based on intraday data, Indonesia stock exchange 1999-2005. Journal of Indonesia Econom-ics and Business Vol.: 22 (2): 133-161.
Sumiyana 2007b. Noise or information arrival: A specific phenomenon of stock price behavior in Indonesia Stock Exchange (empirical Study based on intraday data, Indonesia Stock Exchange 1999-2006. Journal of Indonesia Economics and Busi-ness 22 (3): 133-161.
Sumiyana. 2008. Day of the week and monday effect: Phenomena proved inconsistently in Indonesia Stock Exchange. Journal of Theory and Applied Management 1 (1): 1-29.
Wermers, R. 1998. Mutual fund herding and the impact on stock prices. Journal of Finance 54 (2): 581-622.
104
Gadjah Mada International Journal of Business,
January - April 2009, Vol. 11, No. 1
APPENDIX 1. Mean Comparison - Trading Days Sensitivity Tests
Opening Prices with Next Periods Closing Prices with Next Periods
Differences Mean Comparison Differences Mean Comparison
Monday || Return N Mean Std. Dev. t-value Sig. N Mean Std. Dev. t-value Sig.
09.00-09.30 1,776 0,0063 0.0339 7.7740 *** 0.0000
09.30-10.00 1,919 -0.0025 0.0213 -5.2020 *** 0.0000 1,776 0,0040 0.0346 4.8500 *** 0.0000
10.00-10.30 1,754 -0.0006 0.0384 -0.6460 0.5180 1,638 0,0056 0.0490 4.6210 *** 0.0000
10.30-11.00 1,587 -0.0019 0.0396 -1.9210 * 0.0550 1,539 0,0037 0.0504 2.8490 *** 0.0040
11.00-11.30 1,502 -0.0020 0.0184 -4.2150 *** 0.0000 1,467 0,0038 0.0353 4.0910 *** 0.0000
11.30-12.00 1,469 -0.0016 0.0196 -3.0890 *** 0.0020 1,445 0,0040 0.0356 4.2520 *** 0.0000
12.00-13.30 1,503 -0.0012 0.0144 -3.1200 *** 0.0020 1,480 0,0042 0.0333 4.9120 *** 0.0000
13.30-14.00 1,714 -0.0012 0.0170 -2.8300 *** 0.0050 1,682 0,0049 0.0321 6.2460 *** 0.0000
14.00-14.30 1,508 0.0006 0.0379 0.6200 0.5350 1,488 0,0061 0.0419 5.5920 *** 0.0000
14.30-15.00 1,516 -0.0016 0.0496 -1.2600 0.2080 1,492 0,0043 0.0544 3.0280 *** 0.0030
15.00-15.30 1,619 -0.0019 0.0445 -1.7100 * 0.0870 1,598 0,0032 0.0530 2.3770 ** 0.0180
15.30-16.00 1,755 -0.0056 0.0327 -7.1530 *** 0.0000 1,734 0,0006 0.0410 0.5700 0.5680