Emission estimation of fuel consumption and CO2 absorption by green
open space in Jakarta
Dessy Gusnitaa and Suaydhib
aAtmospheric Composition Division, Jl. Dr. Djundjunan 133, Bandung 40173, Indonesia bAtmospheric Model Division, Jl. Dr. Djundjunan 133, Bandung 40173, Indonesia
Abstract
The increase of vehicles and the industry activities due to population growth and economics in urban areas had an impact on the increase in consumption of fuel oil and also CO2 emissions, that caused global warming. The plant absorption play important role on reducing the emission, therefore Jakarta as a metropolis city, required a huge area of green open space. This paper aimed to analyze number of gas emissions CO2 that was produced from consumption of fuel oil and the absorbency of gas CO2 in the Jakarta city. The estimation method was used to calculate CO2 emissions based on consumption of fuel oil (gasoline and gasoil) in Jakarta city. Then the absorbency CO2 will also be counted related to green open space (GOS) in the Jakarta city. The Results will be used as input the POWER SIM model. that was used to this paper. This model aimed was to count emissions CO2 in the Jakarta city was based on the function of the absorption of emission CO2 by green open space (GOS). Result showed that in the Jakarta city territory, emissions CO2 that originated in consumption of the highest gasoline emitted in east Jakarta was totally 1.3x10⁹ ton/year. Whereas emission CO2 that originated in consumption of biggest gasoil emitted in North Jakarta total was 5.5x10⁸ ton/year. Results running the POWER SIM model showed the existence of the absorption of emission CO2 by green open space in the Jakarta city. The total remnant of emission CO2 after being absorbed by green open space in the Jakarta city during 2013 was big as 6.27x10⁹ ton/year. Results of prediction of the model till 2020 showed that emission CO2 in the Jakarta city will continue to increase through to as big as 26x109 ton/year.
Keywords emission, CO2, Jakarta city, POWER SIM model
1.
Introduction
The increase of population and the activity of community in urban areas will increase the energy requirement. Those activities will increase pollutant emissions and greenhouse gases to air, so that will reduced quality of as healthy life. The decline in the quality of the urban environment will have an impact on the decline in the health and the productivity of humankind. Therefore the quality of the city environment must become the main attention of the government. The energy for various needs was dominated by the use in various kinds of the fossil fuel. The consumption trend of energy increasingly increased was seen from the use of the fossil fuel, especially oil for the sector of the transport and diesel fuel for industry sector was seen 2000–2007 and it was estimated still continued to increase till at this time (SLHI 2010). In line with the growth in the sector of the transport that was projected around 6–8% per year, then the use of the fuel was in Indonesia projected improved of 2.1 consumption times 1990 during 1998, of 4.6 times during 2008, and 9 times during 2018 (Darwin, 2004).
SWUP
for the atmosphere environment. In the area of urban areas, the transport was the main pressure, beside the industry, commercial and domestic. CO2 (Carbon dioxide) was one of the
greenhouse gases. According to IPCC (2007), the activity of humankind was the biggest contributor greenhouse emissions especially from consumption of energy that was 26%. The source of energy that at this time was used was still using the fossil fuel, natural gas and coal. The increase in the number of population especially in the urban areas toward the increased consumption of energy. The impact of the development of transport means will like this be influential directly against emissions gas CO2 that was taken off to the environment. The
increase temperature was greenhouse gas effect. Increasing in temperature would cause further effects such as polar ice melting, watersea surface increasing, agricultural damage and indirectly can affect economic activities in acountry (Andriono et al., 2013). With this condition, the Jakarta city potential emitted CO2 that was high enough also. Effort that could
be followed in the city environment and urban areas to reduce gas emission CO2 was the
program and the reforestation of the city forest. Gas CO2 could be absorbed the city forest,
the city garden, roof the road, the paddy field, the garden and several forms of space were open green other. However in this period now green open space and the city forest continued to decrease because of being made the settlement and the area woke up other. Government policies are needed to be firmly implemented in order to support emission minimization efforts. After all those actions are expected to make a good sinergy in reducing greenhouse gas emission (Ikkatai, 2008).
Because of that this paper aimed carried out by the estimation of emissions CO2 that
was produced from consumption of good fuel oil diesel fuel and premium, as well as the potential size for the absorbency CO2 by green open space in Jakarta city that was the biggest
city in Indonesia, where the level of the growth of the population as well as consumption of energy was high enough.
2.
Materials and methods
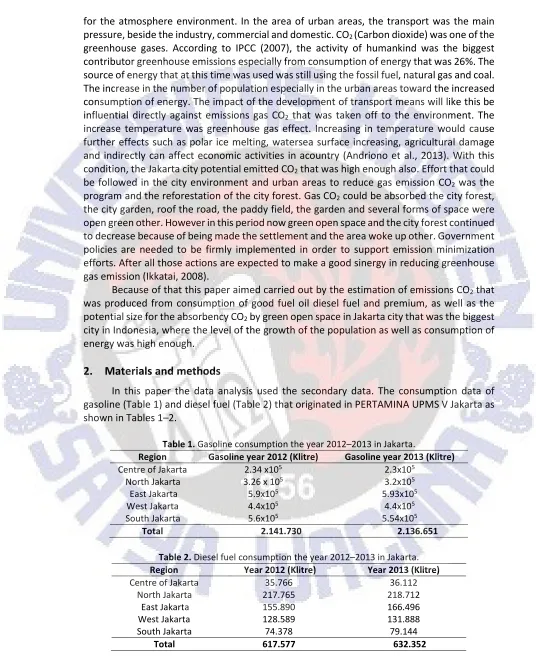
In this paper the data analysis used the secondary data. The consumption data of gasoline (Table 1) and diesel fuel (Table 2) that originated in PERTAMINA UPMS V Jakarta as shown in Tables 1–2.
Table 1. Gasoline consumption the year 2012–2013 in Jakarta.
Region Gasoline year 2012 (Klitre) Gasoline year 2013 (Klitre)
Centre of Jakarta 2.34 x10⁵ 2.3x10⁵
North Jakarta 3.26 x 10⁵ 3.2x10⁵
East Jakarta 5.9x10⁵ 5.93x10⁵
West Jakarta 4.4x10⁵ 4.4x10⁵
South Jakarta 5.6x10⁵ 5.54x10⁵
Total 2.141.730 2.136.651
Table 2. Diesel fuel consumption the year 2012–2013 in Jakarta. Region Year 2012 (Klitre) Year 2013 (Klitre)
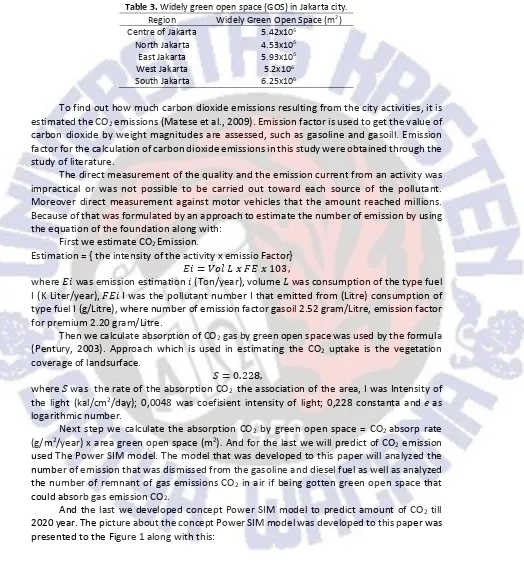
We used Widely green open space (GOS) data from Jakarta Parks and Public Service as shown in Table 3.
Table 3. Widely green open space (GOS) in Jakarta city.
Region Widely Green Open Space (m2)
To find out how much carbon dioxide emissions resulting from the city activities, it is estimated the CO2 emissions (Matese et al., 2009). Emission factor is used to get the value of
carbon dioxide by weight magnitudes are assessed, such as gasoline and gasoill. Emission factor for the calculation of carbon dioxide emissions in this study were obtained through the study of literature.
The direct measurement of the quality and the emission current from an activity was impractical or was not possible to be carried out toward each source of the pollutant. Moreover direct measurement against motor vehicles that the amount reached millions. Because of that was formulated by an approach to estimate the number of emission by using the equation of the foundation along with:
First we estimate CO2 Emission.
Estimation = { the intensity of the activity x emissio Factor} nÑ = ÖÇt Ü ! :n ! 103,
where nÑ was emission estimation Ñ (Ton/year),volume Ü was consumption of the type fuel I (K Liter/year),:nÑ I was the pollutant number I that emitted from (Litre) consumption of type fuel I (g/Litre), where number of emission factor gasoil 2.52 gram/Litre, emission factor for premium 2.20 gram/Litre.
Then we calculate absorption of CO2 gas by green open space was used by the formula
(Pentury, 2003). Approach which is used in estimating the CO2 uptake is the vegetation
used The Power SIM model. The model that was developed to this paper will analyzed the number of emission that was dismissed from the gasoline and diesel fuel as well as analyzed the number of remnant of gas emissions CO2 in air if being gotten green open space that
could absorb gas emission CO2.
And the last we developed concept Power SIM model to predict amount of CO2 till
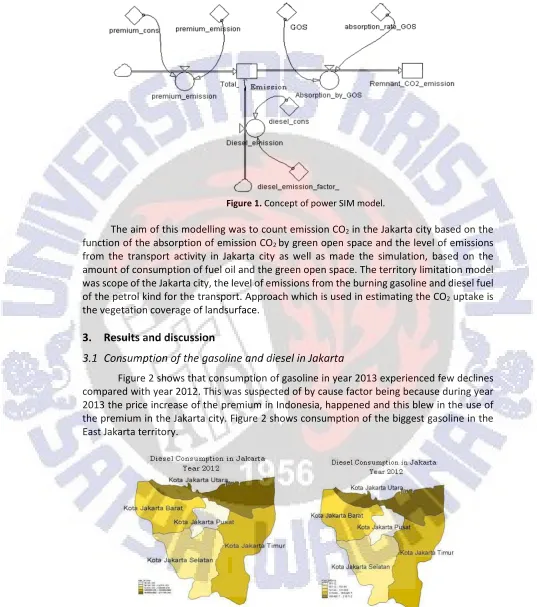
SWUP Figure 1. Concept of power SIM model.
The aim of this modelling was to count emission CO2 in the Jakarta city based on the
function of the absorption of emission CO2 by green open space and the level of emissions
from the transport activity in Jakarta city as well as made the simulation, based on the amount of consumption of fuel oil and the green open space. The territory limitation model was scope of the Jakarta city, the level of emissions from the burning gasoline and diesel fuel of the petrol kind for the transport. Approach which is used in estimating the CO2 uptake is
the vegetation coverage of landsurface.
3.
Results and discussion
3.1
Consumption of the gasoline and diesel in Jakarta
Figure 2 shows that consumption of gasoline in year 2013 experienced few declines compared with year 2012. This was suspected of by cause factor being because during year 2013 the price increase of the premium in Indonesia, happened and this blew in the use of the premium in the Jakarta city. Figure 2 shows consumption of the biggest gasoline in the East Jakarta territory.
Figure 2 presents map of consumption of gasoline in Jakarta 2012 till year 2013. From the below map showed that biggest consumption fuel gasoline in East Jakarta. This was suspected so many motor vehicles that consumption gasoline in this region. Vehicles are the important tools in supporting people mobilities. Therefore, increasing urban population have created demand of vehicles, especially motorcycles and private cars. It is also triggered by the behavior of urban family who have more than one or two motor vehicles.The increase number of vehicles, resulting in the increasing demand of fossil fuels. High demand for these fuels, causing the increase of gasoline and gasoil consumption. Gasoline and diesel fuel consumption is the largest contributor to the increase of CO2 emissions in Jakarta City
(Matese et al., 2009).
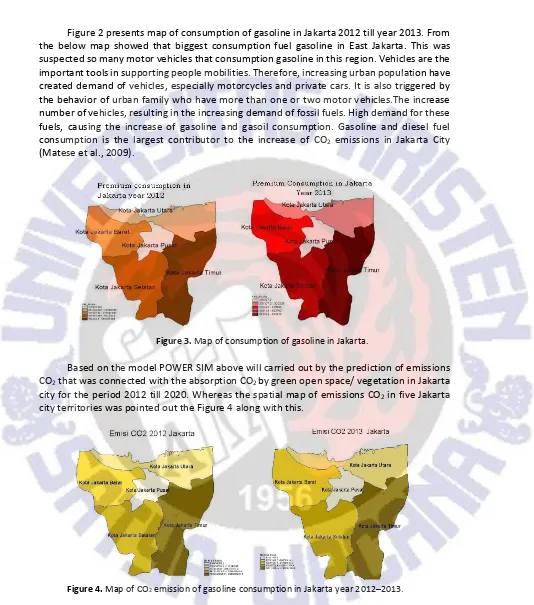
Figure 3. Map of consumption of gasoline in Jakarta.
Based on the model POWER SIM above will carried out by the prediction of emissions CO2 that was connected with the absorption CO2 by green open space/ vegetation in Jakarta
city for the period 2012 till 2020. Whereas the spatial map of emissions CO2 in five Jakarta
city territories was pointed out the Figure 4 along with this.
Figure 4. Map of CO2 emission of gasoline consumption in Jakarta year 2012–2013.
Figure 4 shows the spatial map of emissions CO2 in Jakarta year 2012 till 2013 that was
based on consumption of the gasoline in five territories in Jakarta city. Based on Figure 4, this was pointed out that emission CO2 biggest in the territory Jakarta Timur, with emissions
SWUP This was linear with the amount of consumption of the highest gasoline in Jakarta Timur territory has it of 589896.0 KLitre in 2012 and increased to 5931280.0 KLitre during 2013 year. This it was suspected originated in the sector of the transport that generally uses the premium as the motor vehicles fuel.
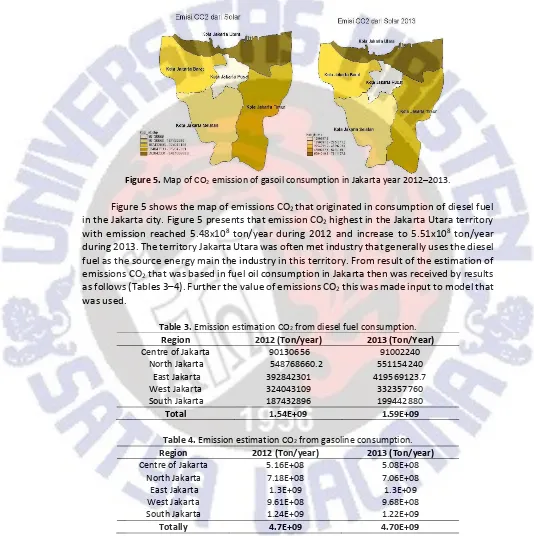
Figure 5. Map of CO2 emission of gasoil consumption in Jakarta year 2012–2013.
Figure 5 shows the map of emissions CO2 that originated in consumption of diesel fuel in the Jakarta city. Figure 5 presents that emission CO2 highest in the Jakarta Utara territory with emission reached 5.48x10⁸ ton/year during 2012 and increase to 5.51x10⁸ ton/year during 2013. The territory Jakarta Utara was often met industry that generally uses the diesel fuel as the source energy main the industry in this territory. From result of the estimation of emissions CO2 that was based in fuel oil consumption in Jakarta then was received by results as follows (Tables 3–4). Further the value of emissions CO2 this was made input to model that was used.
Table 3. Emission estimation CO2 from diesel fuel consumption.
Region 2012 (Ton/year) 2013 (Ton/Year)
Centre of Jakarta 90130656 91002240 North Jakarta 548768660.2 551154240
East Jakarta 392842301 419569123.7 West Jakarta 324043109 332357760 South Jakarta 187432896 199442880
Total 1.54E+09 1.59E+09
Table 4. Emission estimation CO2 from gasoline consumption.
Region 2012 (Ton/year) 2013 (Ton/year)
Centre of Jakarta 5.16E+08 5.08E+08 North Jakarta 7.18E+08 7.06E+08 East Jakarta 1.3E+09 1.3E+09 West Jakarta 9.61E+08 9.68E+08 South Jakarta 1.24E+09 1.22E+09
Totally 4.7E+09 4.70E+09
The POWER SIM model that was used, assumed that the amount of green open space and consumption of fuel of Jakarta territory was permanent. So as result running the model
will predict the estimation of emission CO2 from consumption of fuel oil, as well as emission
CO2 that emitted in Jakarta after the absorption by green open space in Jakarta. The
estimation of CO2 emission in Jakarta city was difference from emissions CO2 from activity of
consumption fossil fuel was reduced by emissions CO2 that was absorbed by green open
space.
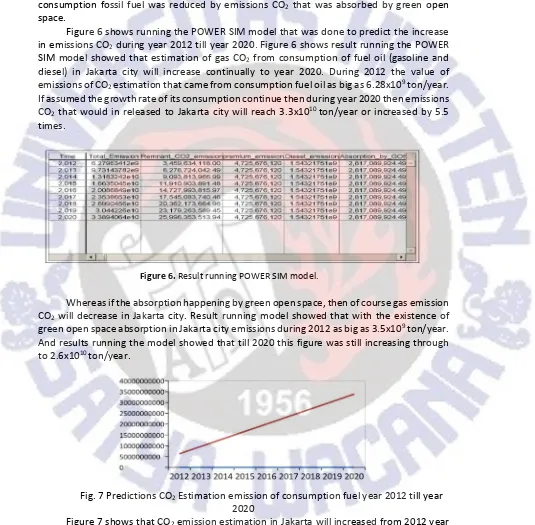
Figure 6 shows running the POWER SIM model that was done to predict the increase
in emissions CO2 during year 2012 till year 2020. Figure 6 shows result running the POWER
SIM model showed that estimation of gas CO2 from consumption of fuel oil (gasoline and
diesel) in Jakarta city will increase continually to year 2020. During 2012 the value of
emissions of CO2 estimation that came from consumption fuel oil as big as 6.28x10⁹ ton/year.
If assumed the growth rate of its consumption continue then during year 2020 then emissions
CO2 that would in released to Jakarta city will reach 3.3x10¹⁰ ton/year or increased by 5.5
times.
Figure 6. Result running POWER SIM model.
Whereas if the absorption happening by green open space, then of course gas emission CO2 will decrease in Jakarta city. Result running model showed that with the existence of
green open space absorption in Jakarta city emissions during 2012 as big as 3.5x10⁹ ton/year.
And results running the model showed that till 2020 this figure was still increasing through to 2.6x10¹⁰ ton/year.
Fig. 7 Predictions CO2 Estimation emission of consumption fuel year 2012 till year
2020
Figure 7 shows that CO2 emission estimation in Jakarta will increased from 2012 year
till 2020 significant. This model assumed that rate of consumption constant. In year 2013
totally CO2 emission 6.27x10⁹ ton/year, from prediction of Power SIM model will increasing
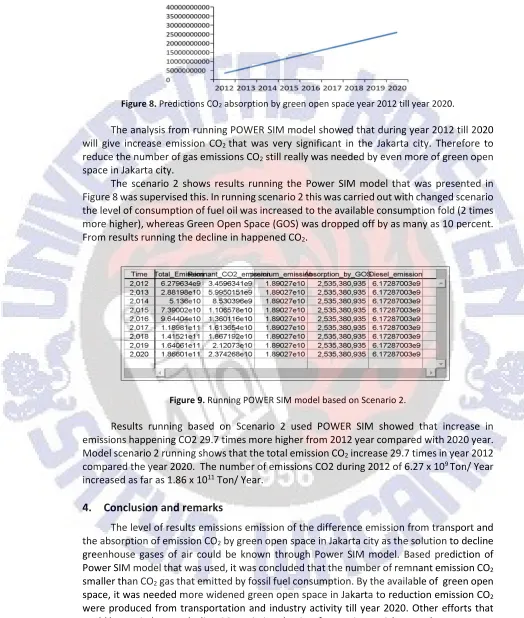
SWUP Figure 8. Predictions CO2 absorption by green open space year 2012 till year 2020.
The analysis from running POWER SIM model showed that during year 2012 till 2020 will give increase emission CO2 that was very significant in the Jakarta city. Therefore to reduce the number of gas emissions CO2 still really was needed by even more of green open space in Jakarta city.
The scenario 2 shows results running the Power SIM model that was presented in Figure 8 was supervised this. In running scenario 2 this was carried out with changed scenario the level of consumption of fuel oil was increased to the available consumption fold (2 times more higher), whereas Green Open Space (GOS) was dropped off by as many as 10 percent. From results running the decline in happened CO2.
Figure 9. Running POWER SIM model based on Scenario 2.
Results running based on Scenario 2 used POWER SIM showed that increase in emissions happening CO2 29.7 times more higher from 2012 year compared with 2020 year. Model scenario 2 running shows that the total emission CO2 increase 29.7 times in year 2012
compared the year 2020. The number of emissions CO2 during 2012 of 6.27 x 10⁹ Ton/ Year
increased as far as 1.86 x 10¹¹ Ton/ Year.
4.
Conclusion and remarks
Acknowledgement
We thank to Pertamina UPMS V Jakarta and Dinas Pertamanan DKI Jakarta, all of which have substantially data to this paper. This work was supported by Atmospheric Composition Division National Institute of Aeronautics and Space (LAPAN). We are also grateful to Prof. Evvy Kartini for supporting in this paper.
References
Matese, A., Gioli, B., Vaccari, F.P., Zaldei, A., & Miglietta, F. (2009). Carbon dioxide emissions of the City Center of Firenze, Italy: Measurement, evaluation, and source partitioning. Journal of
Applied Meteorology and Climatology, 48, 1940–1947.
Andriono, F., Hanafi, I., Yanuwiadi, B., & Soemarno (2013). Dynamic of green open space and temperature humidity index in Malang City. The International Journal Of Engineering and Science,
2(3), 26–32.
Darwin, R. (2004). Effects of greenhouse gas emissions on world agriculture, food consumption, and economic welfare. Journal of Climatic Change, 66, 191–238.
IPCC (2006). General guidance and reporting. Journal of IPCC Guidelines for National Greenhouse Gas Inventories, 1, 1–5.
Ikkatai, S., Ishikawa, D., Ohori, S., & Sasaki, K. (2008). Motivation of Japanese companies to take environmental action to reduce their greenhouse gas emissions: An econometric analysis.