CENTRE FOR
TOURISM PI.ANNING AND DEVELOPMENT INSTITUT TEKNOLOGI BANDUNG
ASrAN
JOURNAL
ON
HOS?TTALIW
AND
TOURIStr4
Volume
13,Number
1,June 2014
ISSNT4T2-207J
CONTENTS
Editorial
I
-
2Artef
Rosyidic, Chief
Editor
Tourism Lealmge
of
TheAccommodation Sector
inBali
3
-
18I
G A.
Oka
Suryawardani,I Komang
Gde Bendesa"Made Antara & Agung Suryawan llliranatha
Assessing
Ecotourism Economics
for
Livelihood
Intervention-
19-
32A
Casein
Nameri National Park
of
Assam
(India)
Niranjan
Das
&.Mrinmoy K. Sarma
Conceptualizing
Tburism
Relationship
Management
(Trm)
33
-
58Framework
andAssessing
ItsImpact on
TburismSemice
fuality,
Tburist Satisfaction
andDestination Loyalty
Arup
Kumar Baksi & Bivraj
"Bhusan
Parida
hsitors'Willingness
toPayfor
hsiling
59
-
68The
Patenga
Beach,Bangladesh
Mo
hammad Mahfuzar Rahman
Ecotourism
inDisaster-Prone
Conservation Areas
and
69
-
87
hs
Underlying
Govemance:
A
Case Studyin
The
Mount Merapi National
Park
Marwedhi
Nwratyo,Arief
Rosyidie
&
Constanza
Parra Novoa
TOTIRISM
LEAKAGE
OF
THE
ACCOMMODATION
SECTOR
IN BALI
I
G.A
Oka Suryarvardeni *1, I Komang G6e Bendesat, Made Antaral, Agung SuryawanWnnrthal
Touriw
has hean a drivins force of economic develornrent and ha-s hecome iheladinc
mnomic
secto'
in
Bali
Province.Howa'er,
lhe
eonomic inpacls
of
wrism
development have
not
beenfultv
berclicialfor
the Balinese communitv.Tarists'
eenditure
has not been totallv remaining in Bali's economv- Some of the expenditures bV tourists leak out of the destination. called tourismlukase
in the form of pawents for immrted nroductt and sen,ices. nawnent of waces for foreisn ennlovas. ond nrofits'
eansfqred to foreiSn owners . So far. tlrc anount of taurism leakaee in Bali has nol been
alailated.
Thertore
lhere is a need to ascertain the annent amount of leakare in Balitutrism.
This Wper ptimates the amoant of tourism lakase from the accommodalicns&r
ia
Bali
throusha
micro analvsis at the induseial level Therewqe
79 holelssdatd
as a samnle hased umna
narmsive nrohahilimn
size samnlins melhotl in {our main tourist dqfinations in Bali, namelv Kuto- Nusa Dua. Sangr and ubud. Four twes of aeommodation were considered in qtimalins tourism leakaee' Thersults
shc*red that the hiehest percentase of leakase was in the 4 & 5 Snr-rated chain hotels' Le 5 1'0%o of tatal revenue
It
was followed bv the 4&
5 Star-rated non'chain hotels (22.-7 %)'and I . 2
&
3 Star-rated hotels (t 2-0 961- Meanwhile- the lowqt leakase wais on the Nonstat-rsted hotets
6.8
otil.
Overall, the average tourism leakase on accommodationsetor in
Bali was 18.8%.
These results indicatetha
0
the hieher the levelof hotel clossifiqtions, rte more leakase will be: andfiil
accommodation which was ov'nei bv a -foreimer and/or manased bv an internationol chain had more leakase than other tvpes 'ofacmmmodatbt The more leakase- lherdore the l€l':s r€venue from louricm will he
direAlv received bv horel and undirectlv bv the local ammunily as tourism is the ntain source of economic da,elopment of Bali Province.
Eoeystem
Seirde,
tourism leakags, aommodationscor,
BalilINTRODUCTION
Bali is
one
of
the
rmst
populartourist
destinationsin
the world due
to its
cuftural activities and natunal scenery. Tourism has now becone the leading economic sector inBali. As Bali's
econom-vhas
been
developedrmstly
through
tourisn
the focus
of
econoric
developnrcnt
in
Bali
province
has
changed
from
the
prirnary
sector (agricuhure)to
the
tertiary sector
(tourism).The
contribution
of
the
printsry
sector (aEricutture)to
the
Gnoss Dorrrcstic Product(@P) of Ba[
has decreased drannticalty ii,om 61.21%in
1969to
l6.84ohn
2012, whilethe contribution
of
the
tertiary
sector (trade and tourism) has increased from9.52%in
1969 to 30.66%
n
2012 @ali StatisticalOm"",
2013). Meanwhile, the contribution of the secondary sectof (handicraft andothcl
indusirts)
ircreased
fiom 1.6'7"/oin
1969to
9.97Yoin
2010 (Frawan, 199,4n
Vy'imnatha, 2001; Bali StatisticalOffce,
2011).* Correspording author, email: [email protected]
Tounsm
m balr
has
been devenpeo slgnlucantryas
ualr us rGGil uw[.nunber
of
visiton
and tourism ftcilities. The nunberof
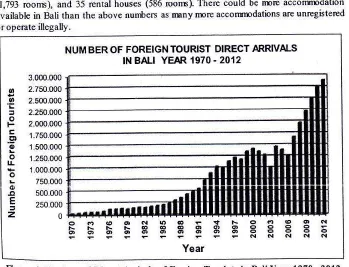
direct anivalsof
foreign touristsin
Bali increased dranatically from 23,340 touristsin
1970to
1,412'839tourists in
2000.Howevir, the tenorist
attack on Balion
12 October 2002 resulted in a decreasein
thenunber
of
foreigntourist
direct arrivals only 93.029in
2003, althoughit
then increasedagain
in
2004. Furthernpre, the secondtenorist
attackon
Baliin
2005led
to
anotherdicrease
in
foreign visitors in
2006 (seeFigure
l).
Efforts
were undertakenby
thegovemnpnt
andthe
tourism industryto
convince foreign tourists tovisit Bali
Cl'adual increases have been reported in the following years and reach the highest foreign tourist directanivals
n
2012, about 2.892.019 tourists (Bali C'ovenrnrnt Tourism Office, 2013).During
period 2007to
2012 the average growth rateof
direct foreigntourist
arrivals toBali
was 14.7 % peryear.As
a
world tourism
destination,Bali
is
supportedby
the availabilityof
infrastructure,including
an
intemational
airportwhich
provides easy accessto Bali
andnnin
roadswhich provide
accessto
various tourismfacilitbs
and tourism attractionswithin
theregion.
Accorrding
to
Bali
GovemmentTourism
office
(2013),there were
2,212accorrrrndation establishrrpnts
with a
total
of
.116,025roons
regbteredin
Balim
2012-These
included
156 star-rated hotels (20,269 roorm), 1,031 Non star-rated hotels(2l,ll4
roons), and
1,025 horrrcstays (d542 roons).Developnrnt of
registered acconrncdationsin
Bali during
period
of
2W2-2012is
shown
in
Figure 2.
However,Bali
Hotel
andRestaunant
Association
EHRI
Bali)
counted
3,346acconrrndation
establishnpnts(62407
roons) in Bali in
2011,that
consistedof
165 star-rated hotels (22,161 roons),1,371
Non
star-rated hotels (28,585roons),
1,760 hornestays (9,282 roons),l5
condotels (1,793roons), and
35 rental houses (586 roorm). There could be nnre acconxmdationavailable
in
Bali than the above nunbers as nBny nror€ acconxrndations are unregistered or operate illegally.NUM BER OF FOREIGN TOURTST DIREGT
ARRIVAS
o
o
Lo
F
g.9
o
o
l!
o
o.ct
E
z
3.000.000
2.750.000
2.500.000
2.250.000
2.000.000
1.750.000
't.500.000
1.250.000
1.000-000
750.000
s00.000 250.000
0
O ..t (9 O N lO @ - t l- I a'l lg O Gl
SbSSEBIEEEIEAEE
6lN$l(\l$lYear
[image:4.476.22.371.264.531.2]IN
BALI
YEAR
1970.2012
Figure
1.Number
of
Direct
Arrirals
of
ForeignTourists
in
Bali Yeal. 1970-2012
(Source: Bali
Tourism
Govemnpnt Office, 2013)(
l
I
I G. A. Oka Suryawardani" Komang Gde Bendesa, Made Annra & Agang Suryawan [iliranatha
DEVELOPMENT
OF
AGCOMMODAITON IN
BAII
YEAR
2A02-2012
(,
E
o
o
t
o
o
JI
E
z
.E
o
F
50.000 4s.000 40.000 35.000 30.000 25.000 20.000 15.000 10.000 5.000
0
r
Star+ated Hotel # Nonetar HoblI
Homestay [image:5.445.50.423.38.317.2]Year
Figure 2.
Number
of Rooms ArrailaHein
Bali
in2002-2012
(Source: Bali Tourism Crovemnrcnt Office, 2013)
Global economic crisis
in
2008did not
obviously have an effecton
foreigntourists to
Bali.
It
was provenby
the nunber of foreign tourists toBali
as outlined above, as well asthe
averagetheir
expenditures and lengthof
stay. The averagee4enditure
of
fbreign touristsper
penon
per day
increasedfromUS$
137.90in
20(Dto
US$ 158.87i:r
2011. The length of stay of foreign tourists also went up from 8.75 days in 20(D to {}.?"1 ti<tysin
2011(Bali
GovemnrcntTourism Office,2012).
Regaridingthe
growtlr
o{
tt.i,:j'',,
of,foreign
tourists
to
Bali,
it
seensthat
tourismin
Bali
will
keep being pronrbirrgas
a sourceof
household inconp for Balinese inhabitants, contnbute to the nationa-l creharrgenate as well as inprove
job
opportunities.Even
though tourism brings about developnrnt
for
Bali's
econonryfor
ma-rr3'' years,however,
the
economicinpacts
of
tourism developnrcnt hasnot
been convincedto
befully
benefiiial
for
Balinesecomrunity
(Dewi,
2009; Denrnwanin
Wiranatha, 2001). There is a phenonrcnon thattourists'
eryenditures have not beentota$r
beconre incomeof
Bali's
economy
because sonreportions
of
tourists'
eryendituresleak
out
the destination in the form ofpaynrnt forinported
products and services, payrnent of wagesfor foreign enployees, and
profits
transierto
foreign owners. According to I-undberg, et al. (1991), leakage occurs when industry irrportsboth
consunption and resources from other countriesto
support the growthof
industry. Bull
(1991) added thatin
economicterns, leakage .could be defined as losses from the national inconrc flow which have been generated during
the
transition fromthe local/national consunption inconp cycleto
the spending chain. Furthernnrc, Harrison (1992) pointed out thatinport
can be seen to be a leakagethat
limitsthe positive
inpact oftourist's ependiture
on a destination. Sothat,
there is a need
to
as certain the cunentarbunt
of leakage from tourism in Bali. Regarding the scope of tourismis relatively wide,this study focused on acconrmdationsectoronly,
as
npst of
foreigntourists'
eryenditures in Bali has been on acconrrpdation. Therefore,the
objective
of
this study
is
to
calculatethe anpunt
of
the
tourbm
leakage fromTourism
kakage
afThe Accommodation Sector inBali
acconrrpdation
sectorin
Bali- The resultsof
this research are erpectedto
give a bett€runderstanding,
awareness,and gaining posilive
responses&om
govemnrnt
and stakqholders in oriilertoinprove
economic inpacts oftourisrnonBalineseconrrunity.
A
studyby
Rodenburg (1980) is the only reference about iriportkaloge
from tourisminBali. The furport leakage was estinnted to be about 40olo forintematbnal standad hotels,
and
Zff/o
for
srnall
economy standardhotels.
The inport
leakagefrom
intemational standardhotels
was estimated fiom the Nusa Dua Projectin
1971,but
that from srmll economy standardhotsls
wasassunrd .
Therehas not
yet been any research about tourism leakagein
the tourist acconnmdation sectorthat has used a conbination analysisof
micro(industrial)
level and nacro (regional)level.
The focus of the analysis in this research was on the acconnndation sectorbecause the highest percentage of eryenditureby
foreign
tourists in
Bali
is on
accomnndation, i.e. 40.5% (BaliCnvemnrnt
Tourism Office, 2011).LIIf,RAT{JRE
REVIEWLeakage
in
Tourismkakage
has
long
been knownas
oneof
negative economic inpactsof
tourism (Bull,l99L
Hudrrnn
and llawkins,
1989;Irrndberg,
et.
al.,
191;
andMill
and
Monison,2009). Hudrnan
and
Hawkins (1989) definetourism
leakage as:(i) inport
goods
andservices
for
consurrption
or
investnpnt
in
tourisq (ii)
paynrnts for
foreign tour
opemtors
and
agencies;
(iii)
payrnentto
foreignersfor
nnnagenrnt contract
androyalties;
(iv) profits
which are paid to foreign stakeholden; (v) interest paidforesemal
credits
in
the tourismsectol
(vi)
exchange costs for tourism investnpnt; (vii) advertisingin intemational rrarketing and pronntion expenditures; (viii) comnissions paid to foreign banks, credit cards and foragency usedby tourists; (ix)savings offoreign enployees; (x)
education abroad
and
trainingcosts
of
tourism enployees; (xi) savingof
errployers,enployees, and entrepreneurs; and (xii) tarcs paid
to
gov€mnrent. The cause of inportedproducts entering a destination i.s incapability of a destinatbn in producing product
wfibh
fulfill
standardof
product quality needed by foreign tourists.In addition,lJnluonen, et. al.(2011)
said
that
savings delayed
the
transfonration
of
new
economic values intoinvestnrcnt. Moreover, they agreed that although ta:<es decreased the economic inpact
of
new dollars,
they
could be spent later. Finally, they pointed out that when conpared with savings and taxes,inport
inputs were the rnost inportant leakage itens, becauseirport
includes
eryenditures
that flow out
fiom the
localor
national economy. Furthemnre, Smith and Jenner (1992) stated that there is also anothertype ofleakage called'invisible'leakage.
The
'invisible'
leakage is the physical effects of tourisnq including the depletionor destruction
of
acountry's
infrastructure, natural habitats, environnpnts and historicalas well as cultural heritage that have a leakage effect on tourism receipts.
According
to
Meyer
(2N7), lealage
tendsto be
highest whenthe
local destinationeconomy
is
weak and
lackof
the quantity
andquality
of
inputs requiredby
tourismindustry. He said that a prevailing trend in
nnny
developing countries depends heavily oninports.
Ther<ifore,atterpt
had beennade
to
reduce leakageby
developing strong€r links between tourism and other sectors in the local economy. He added that govemnrcntpolicy needs to concentrate on strcngthening the economic linkages between tourismand
agriculture to support
inport
substitution.M
i nimizi n g L e a k a g e s fo r Op ti mizing To uri s m B e nejit sMill
andMorrison
(2009) suggested sonrc strategies in minimizing leakage, including: (i) reducinginported
food, goods and rnaterials, and encouraging the use of localproductsI V. A, UKIIDUTy(aWUrUUltt, LOtLUttE VW Det,u@tt' Ntusl
using traditional architecture concept and encouraging using local goods and nraterirl;;
(O
-aoing
effective
negotiation
with
rruhinational conpanies dealing
with
travelagencies and tour operatoa; and (iv) encouraging cultural tourbm with the authenticity
of
destinationsso
that
tourist love
localproducts. Furthembre,
leakageinpacts
onm,rltiplier effects
(Ilughes,
194).
Therefore, reducing leakageis
cruciallyinportant
toincrease economic
benefit
of
tourismin
a destination because leakagewill
reduce themrltiplier
effects of tourism(Unluonen, et.al-
20ll)'
Dwyir
and
Fonyth
(19%)said that
tourism rn"rltiplieris a
ratio
rneasuringthe
irripleefects of
tourist
spendingon
local economy.A
highermrltiplier
suggestsa
greaterinpact
of
tourist
expenditure on local econony. BuU (1991) observed tourismrnrltiplien
ranging from 2.5 (in Canada)
to
0.8 (in the Baharnas). He has found that largedivenified
economies
tend
to
have larger nultipliers, while developing countries andsnnll
islandstaies tend
to
have snnllermrltiplies
because of considerable leakage . Furthenrore,Kim
and
Jarnal (2007) reportedthat
tourisminconp nultipliers were
1.96(in
Turkey) and0.39
(in
Westem
Sanna).They
arguedthat
tourism
leakage weakensllie
tc'ildsm mrhiplier.Ilndberg,
et. al. (1991) supported these statennnts. He said that deereasingin
m.rhiplier leadsto
decreasingin
tourism benefitin
economic developnent.Mortot'er,
astudt
by Iacher and Nepal (2010) also found that by using prccise strategic basedor'
the authenticityofa
destination, economic leakage can bereduced-Mill
andMonison
(2009) said that there are three categories of tourismbenefits, rra.,',:ely:increasing inconre,.increasing
job
opportunity, and increasing foreign eirchange carr,ings.Tourist's
eryenditureswill
beconp
inconrcfor
the
destination economy'Thc inc'rne
generated from tourism sector
will
stirnuhte the infrastructure developnrcnt. Furthem:ore, iourism producesnany job
opportunities, direct and indirectenploynrnt.
The armrtritof
indirectirryloynrcnt
depends upon the erdentto
which tourismis integrated rvithtl,l'
rcstof
the local economy. Thenpre
integration and divenification occurs, therrrre
iiidirectenploynrnt
generatedftIughes, 194).
HoweYeqthe
largerhotel
properties are nrorelnc-ti"ia
to
uie
inported
labour
especiallyfor
nnnagerialposition
(Fridgen, 1996).Morcover, tourism
is
also away
to
increase foreign erchange earningsto
prednc'e theinvestnrent necessary
to
finance growth in other economy secto$. Fridgerr {tr99fi:'{pued that there is a dangerof oventating
thc foreign exchange eamings genetalerilif
ii"'i'ist,'
unless the inportant frctor, such as leakageb
known. The tourist's elpenditunc that l:,ali.cfrom destination's econony nnrst be subtracted from foreign e>change eamings i--, order
to
determine the true inpact. According to Fridgen (1996) andMill
and Morrison {2-009)'foreign ei<change eamings
will
be reduced as a resultof
of leakage. In otherwcrdi,
th::e*ent to
which a destination canmininiu
leakage will determine the sire of the foreignerchange eamings.
R.BSEARCH METHOD
The
researchwas
undertakenduring
periodof
April-June
2013at
four
nsin
tourist
destinationsin
Bali
Province i.e. Kuta, Nusa Dua, Sanur and Ubud.Iocations
of
thisresearch were selected purposively with consideration that the above destinations are the
nrain tourist destinations in Bali. Sample
Daign
Probability Proportional
to
Size (PPS)sanpling nnthod
proposedby
Kish
{1955:2'-14}Tourism Leakage ofThe Accommodation Sector in
Bali
NlF.I
where:n = sanple size
N = population fl =
eror
Three clusters
of
acconupdation werc chosen nanrely: (r)1,2 &.3
Star-ratedhotel
(ii) 4&
5 Star-rated hotels either chain hotel or non-chainhotel;
and (iii) Non-star rated hotel.Population
of
these three typesof
hotel can be seen in Tablel.
Using anernrrof
20olo(c={.2),
total
numberof
sanrples were 63 hotels (see Tablel).
Accordingto
Sevilla et. al. (1993)nnxirrum
error can be tolerant forsocial science is about 2fflo.Dua
Analyis
Method for calculating tourism leakage was constructed based on
thenndel
devebpedbyUnluonen,
et. al.
(2011),
but
it
was npdified
to
calculate touriSm
leakage onacconrmdation
sector only. The operational equations are outlined as follow:n
L
=tu
...(2)
i=l
where:
L
:
total leakageLi
:
the leakage iterns in a group i.fl :
3, whereLl
is
the import leakage group, 12 is the delayed leakage group. andIIi
isthe invisible leakage group.
(note:
in this study, the
delayed leakage(I2)
andthe invisible
leakage(3
)
were notcalculated).
In
this study, the
delayed leakage(I2)
and the invisible leakage0J)
are not calculated.Inport
leakage group (L1) is only leakage that is examined in this study, as follow:Ll:tllk
...(3)
k:
I
The nurrber
of
inTort
leakage iterns (v) was 8.where:
8
t
$
.
i$
,i
,$ ri
:,il
;
{
':l
i (1)
N
Tatle
SizeNo
Cluster
Pop{ation
(N)
Samge
Size(n)
Error
(a) Rcmarks
I
l,2&3Star-ratedhoteb
702t
t8%
2
4&5Star-ratedhotels
85 26 t7% 12 chain hotels14 non-chain hotels
3 Non-star rated hotels 1,563 32
t8%
Total Sarrple 1,718 't9
t8%
I G. A. Okasuryawardani, Komang Gde Bendsa, Made Annra & Agung &tryawan Wirttnatha
Lll
=
Total
payrrrcntsfof
the inport
of
goods and
servicesfor
consunqrtion atrti invesilrrcnt nnde byaccoffindation
sector-Lll
=
Total
paynrnts of
eaming ttansfers abrcad, forlicenses, technologytransfes,
roya$ies, patents, etc. in the acconrnodation soctor.
Ll3
=
Total percentage paynFnts to foreign banLrs for credit cards used by foreignem .Ll4
=
Total
savingsof
foreign enployeesin
acconunodatbn sector and thefiEtie)'
they send abroad.
L15
=
Paynrnts of
credit interest provided ftom abroadL16
=
Total payrrrcnt abroad fortraining personnel needed by accorffmdation sectorLl7
=
Paynrcnts for intemational nnrketing and prorrntion public sectorLl8
=
Paynrnts
for international nnrketing and promotion by acconrnodation sector Assunptions of the rmdel by Unluonen, et. al. (2011) are as follow:(i)
All inport
goods and services that are tourist-related are used in the country ofifqiort,
(ii)
The saving tendency of expatriates is equal to the saving tendency of citiiacns,(iif
Regadless
of
why and
by
whomthcy
are
don€,all
rmrketing and
profirrtionactivities
nnke
sonp contnlbution to the tourismdennnd in the country,(iv)
The dennnd genenated fr,om oneunit of
inport
input
i;s equal for both toudsts aiidresidents
Dxription
of VariablesBasically, variables in this study consist
of
inported products, foreign enployee, ltrn:ign sewices, and inconrcofthe
hotels.All
ofvariables are outlined below:(i)
Inported
productswelr
classified into inported foods, inported beverages,irrrlolted
equipnrcnt (utensils) and other inported goods and rnaterials related
to
design,funiiture
and decoration used in the hotel.
(if
Foreign enployee was the nunber of foreigners whowo*
in acconnnodation sectors as well as theirwages and salaries(paynrnt
for foreign erryloyees)'(iir) Foreign services inchrde
any
fees.rehtedto
the operational of hotels lttielri'1i':1:r-:;r ir.overscas,
such as
services abroad,and
paynrnts for
foreign prcductions,
6ircrseas education and training cos ts of touris m enployees.Details
of
the
variables relatedto
causeof
leakagethat
were usedin this stud;'
areoutlined
in
Table 2.All of
the above inported products, foreign enployees and foreignsewices were
calculatedin
all
types
of
acconrrpdation,nanrly: (i) Non-
star
ratedhotels;(ii)1,2&3Star-ratedhotels;(iii)4&5Star-ratednon-chainhotels;and(iv)4&
5 Star-rated chain hotels.
ated to Cause of
Leak
Table
2lndcators
anel Variables Re toNo Indicators Variables (unit/year)
I
Inported
foods a.Inported
nrat
(beee chicken, podL lamb).b.
Inported
fisheries (fish, prawn, lobsters,octopus,and squid)'c. Inrrorted food favour
2
Inported
beveragesa.
Inported
dairy products (fieshmift
yoghurt, juice)-b. Irnrorted wine, beer and alcoholic drinks.3
Inported
fruitsand vegetables
a.
Inported
varietiesof
fruits b. varietiesof
4
Inported
utensils a.Inported
hous ehold utensib (s tove, p an,frylng
i
3n, mixer'*
g 3€ E
i1
Tourism Leakage ofThe Accommodation Sector in
Bali
(201
l),
Zheng (201l).
Another variable was total r€venue
of
the hotels. Total revenue of a hotel was calculated based on the fornnrla as follow:n
Y=IV
i=l
Y=Yl +lA
+Y3
...
....
(4)where:
Y
= Annual revenueofan
hotelYl
=Revenue from roonsY2 = Revenue from selling foods and beverages
Yi :
Revenue from others (laundry, spa, telephone, intemet, business centre, etc.) Revenue fromroorns :
Room night sold x Room rate (Rupiah/day)Room night
sold
:
Average occupancy ra;te (%) x numberof
roons
x numberof
days in a yearTherefore, the percentage
of
tourism leakage of one hotel can be calculated as the total amountof
inported
products
and services dividedby
total
revenueof
the hotel, as equation below.10
No Indicators Variables (unit/year)
bhnder, coolg
ricrowave)
b. Inported plates, glass, cups, cutbries, and nugs.
5
Inported
goodsand materials
a. Lrported fu rniture (beds, tables, des*s, chairs, shelves, wardrobes).
b. Irmorted nnterials for buildins accessories.
6 Services abroad a. Pronption and advertising Indirect Pronntion and advertisenrent throu gh Media Channels (Televis ions, broadcas ting)
Direct prormtion through visiting
sonr
countries. b. Public Relation, publicity payrrents, foreigner operationalDavnronts
'l
Foreignpaynrnts
for foreign productions.
a. Transfer paynrent for conrnission of travel agents and
tour
operators. b.
Inport paynrnt.
c. C-ovemnrnt tax paynrcnt for
inpoded
goods and s ewices.d. Bchange costfor tourism
investnrnt.
e. Interest payment for extemal credits
in
the tourism sector.8
Payrrnt for
foreign enployees
a.
Nun$er
of forcign enployeesb. Total paynrnts for foreign enployees c. Transfer paynrnts for foreign enployees 9 Saving
of
foreignenployees
a.
Annunt
of foreign savingl0
Education abroad and training costs of tourismemployees
a. The nurnber ofoverseas training
staff
b.
Paynrnt
for overseas trainingstaff
I V. A. VKC DUtyAWUrAUnq LOmAnt ItUg DVIaA6U, MUge aftturu g A6Unt Dqt)/qwutt 'f .r u.tttttttt Peicentage ofleakage
Totalleakagc
x
100%...(5)
Total Rsvenue
Dmit$on aflhe
Modd
tinitatbn of
rmdel
in
this
study
is
that dehyed
leakage andinvisible
leakage were erchrded ftom this study due to difficulties on obtaining data relatedto
delayed leakage(ta:cs, and savings of entrepreneurs and enployees) and calcuhting the invisible leakage
(physical negative impacts
of tourisnl
destructionof
a country's infrastructure, natural habitats, environrnents and historical as well as cultural heritage).Another
limitationof
calculating leakage in this study is that saving of foreign enployees and the rmney they send abroadcould
not
be
obtainedin
this study.
So that,the above
variables were eycludedftomthe
nndel. Even though these variables were not included in the nodel,it
was
not
significantly affect
the
result (the
percentageof
tourism leakage), asall
of
wages/sahries
of
foreign enployees were already included in the hotels'erpenditure.It
was real situation that
the
sanpling hotels had never known about savingsof
foreign enployces as this kind of data was really confidential andrrpolrte
to be asked.RESTJUTS AI{D DISCUSSIONS Sourca ofTouism
Lufuge
In geneial the sources of leakage
in
acconnndation sectorwere as follow:(i)
Inported foods:all
inported foods that were used in hotels to serve theirguests.(it)
Inported
beverages: allinported
beverages that were used in hotelsto
servetheir
guests.
(iii)
Inported of fruits and vegetables: all inported fruits and vegetables that were usedin hotels to serve their guests.
(iv)
Inported
utensils and equipnrcnt:all inported
utensils andequipnrnt
that
were used in hotels.(v)
Overscas nnrketing and education:, all overseas activitics that were trndertakenby
hotel's penonnelto
inprove the abilityof
stafis and/or to inprove the perfonrnnceof
hotels. These activities includepronntion
andothernnrkcting
activities as wellas training
for
stafrs and hotel nnnagenrnt that was done in overseas.(vi)
Profit
transfer
for
foreign
owners:profit which
was
transferredto
owners
in overseas.(vii)
Paynrnt
for foreign enployees.(viii)Paynrnt
for booking fees that was paid to overseas travel agents.(ix)
Paynrnt
for online fees that was paidforonline
agent in ove$eas.(x)
Managenrcnt fees:paynrnt
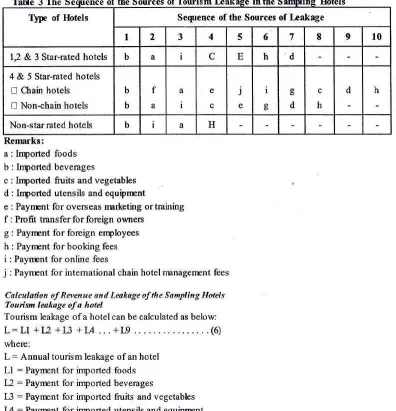
for the intemational chain hotel nanagenrcnt systemThe Sequence ofthe Sourca ofTouism Leakage
Based on the survey undertaken on 79 hotels, the sequence
ofthe
sources ofleakage were as follow:(i)
Overalt inported
beverages were thefirst
sourceof
leakage inalltypes
of hotels. Meanwhile, profit transferfor
foreign owners was also the nnin source of leakage in 4&
5 Star-rated chain hotels. This was the second sourceof
leakage afterirrportedE
F
,s
a3
ai:i
s
Tourism Leakage ofThe Accommodation Sector in
Bali
beverages.
In 4
&
5 Star-rated chain hotels, nenagernent fees paidto
intemationalchain rnanagenpnt r:irere the third source of leakage.
(it)
Inported
foods andpayrrnt
for online fees also played a crucialrole as the sourcesof
leakagein rrnstly
all type
of
hotels.h
4&
5 Star-rated chain and non-chainhotels, the
payrrrnt
forforeign enployees was also a significant source of leakage .(iii)
Inported fruit
and vegetables were also as sourceof
leakage especially for all Star-rated hotels.(iv)
I-astly,inported
utensils and paynrcnt for booking fee stated in the last rank of the source ofleakage.More detail
on the
sequenceof
leakage's sourcesin
eachtype
ofhotels
is
shown
in Table 3.TaHe
3The
Secmence of the Sources of'lburism
in theSamdins
HotelsTlpe
of
Itrotels Seqrenceofthe
Sources of LeakageI
2 3 4 5 6 7 8 9l0
1,2
&3
Star-rated hotels b a Ic
E h d4&5Star-ratedhotels
ll
Chain hotels U Non-chain hotelsb b
f
a
a e
c
J
e I o
o d
c h
d h
Non-star rated hotels b I a
H
Rernarks:
a
b c d
e
Irryorted
foodsInported
beveragesInpoded
fruits and vegetablesInported
utensils and equipnrcntPaynrnt for
overseas nnrketing ortrainingf
: Profit transfer for foreign owners g :Payrnnt for
foreign enployeesh : Paynrcnt
for
booking feesi
: Paynrcnt for online feesj
:Paynrnt for
intemational chain hotel rnanagenrcnt feesCalcularton of Revenue and Lea!,-age of the Sampling Hotels Tourism leakage of a hotel
Tourism leakage of a hotel can be calculated as below:
L=Ll+12+13+U...+L9.
...(6)
where:
L
:
Annual tourism leakage of an hotelLl
= Paynrcntfor
irported
foods12
:
Paymentfor inported
beverages13 = Paynrcnt
for
irrported fruits and vegetablesI-tl
:
Paynrcntfor inported
utensils and equiprrcntL5
:
Paynrcntfor
overseas narketing ortraining [image:12.442.37.433.213.624.2]I
G- A- Okasuryawardani, Komang Gde Bendesa, Made Antara & Agmg Surycwan lliranatha[,6
:
Paynrnt
for foreign erployeesL7 =
Paynrnt
for booking fees L8 =Payrrnt
for online fees L9 = Payrrpnt forrmnagenrnt
feesBased on the sources of tourism leakage" an exanple
of
calculationfor
annual leakageof
a sanpling hotel is as follow:
Type
ofhotel
:4
&
5 Star-rated chain hotelCode of sanpling
hotel:
3Calculation of the annual leakage of this hotel included:
(i)
Paynnnt for inported foods(Ll)
(ii)
Paynrcnt for inported beverages([2)
(iii)
Paynrcntfor
inportedftris
and vegetables(I3)
(iv)
Paynrnt
for inported utensils and equipnrent(I/)
(v)
Paynnnt for overseas nnrketingortraining
(I5)
(vi)
Paynrnt for
foreign enpbyees (16)(vii)
Paynrnt for
booking fees (L7)(viii)Paynrnt
for online fees (L8)(ix)
Paynrcnt for rrnnagenrnt fees (L9)The annual leakage
ofthis
hotel wasYl+ Y2
.-.
+ Y9Revenue ota hotel
Based
on
the
sourcesof
revenue,an
exanpleof
calculationfor
annual revenueof
asanpling hotel is as follow:
Type
ofhotel
;4
&
5 Star-rated chain hotelCode
of
sanpling hotel : 3=
Rph
12,582,810,6'18 = Rph 120,610,800,000=
Rph
112,512,000:
Rph
104,800,000=
R$,h
3,000,000,000=
Rph
1,500,000,000:
Rph
t39,9+)90
:
Rph
5,990,672,705:
Rph
6,112,931,332:
Rph 150,545,430,975:
Rph 213,952,596624=&h
?6,411,@1,651=
Rph
15,282,328,330= Rph 305,646,566,605 Calculation
ofthe
annual l€venue of this hotel included:(i)
Revenue from rooms(Yl)
(ii)
Revenue from selling foods and beverages (Y2)(iii)
Revenuefum
others: laundry, spa, etc.(B)
The annual rt:venue of this hotel wasYl+
\2
+Yf
Perceattge ofTourism leakage ota Hotel
Based
on the
calculationof
revenueand
leakageoutlined
above,the
percentageof
tourism leakageof
the sanpling hotel was:Percentageofkakage
:
Totalkakage x
lCI%
Total Revenue
Rph 150.545.430.975
x
100% Rph 305,646,566,605=
49.2s %Tourist
Iakage
ofAll
Sampling HotelsFurthenmre,
the
amountof
tourism
leakageof
all
sanpling hotels
for
eachtype
of
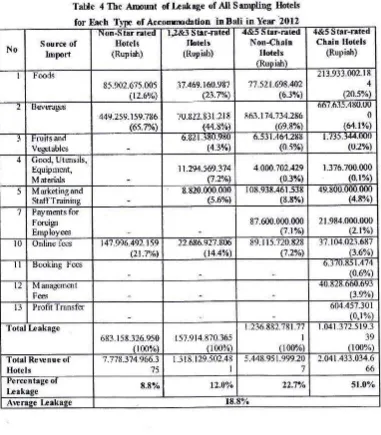
accomrndation is presented in Table 4.As
can be seen fromTable 4, the highest anrcuntTourism Leakage ofThe Acconmodatian Sector in
Bali
of
tourism leakageon
all types of acconrnodatbns was inported beverages. The anpuntof
inported
beverages was about 65%of
total bakageof
Non-star rated hotels; about45To
ef
1,2&3 Star-rated hotels; about7flo of4&5
Star-rated non-chain hotels; aod about&o/o
af
4&5
Star-rated chain hotels. Meanwhile,inported foods
werealso
inportant sourceof
leakageon
all
types of acconrrndatbns.Annng
all types of acconnmdatiorqthe highest
inported
foods were occurred onl)&3
star-rated hotels (about 24o/o oftotal
leatcage). Managenrcnt fee was one sourc€ of leakage in 4&5 Star-rated hotels as this type
of
accorrurpdation rnanagedby
intemational chain hotel managenrcnt. It was about 47oof
the total leakage of
4&5
Star-rated hotels. In addition, profit transferwas also occurred at4&5
Star-ratedhotels, as
oneof
the
sanplinghotels owned
by
foreigner. The profit transferwas about 0,17oof
total leakage of 4&5 Star-ratedhotels-Table
4 TheAmount
ofIrakage
ofAtlSanrytling
Hotelsfor Each
Type of AccomrnodationinBali
inYear
2012ri
No Source of Import
Non-Jtar r:ateo Hotels (Rupiah)
lrzdt3 star-rated
Hotels (Rupiah)
46.3
5Br-rat'
Non-Chain Hotels (Ruoiah)
4d.5 $tar-xlfed
Chain llotels
(Rupiah) Foods 85.902.675.005 (12.6%\ 37.469.160.987 (23.7%) 7't.521.698.442 (6.3%\ 213.933.002.18 4 (20.sYo) z Bwerages 449.259.159.786 (6s.7W 70.822.831.218 (44.8%\ 863.174.734.286 (69.8olo) oo/.oJ).46u.UU 0
tu.t%')
-t
rnlts
ano Veeetableso.ull.J6u.v6u (4.3V,)
o.), l r*0z!.266
(0.sold
. /J).J4lr.Uru
$2%)
4 uood, utenslls, Equipment, Materials 1t.294.569.374 (7.2%) 4.000-702.429 (0.37") 1.376.700.{n0 (0-r%) 5 Mrketmgand StaffTraining 8.820.m0.ux) (5.6010) 108.938.,161538 (8.87o) 49.UUU.ilru.{nru (4.8vo) Payments for
Foreigr Emplovees 87.600.000.000 {7.1'/"') 21.984.000.000
(2.rw
l0
Online fees t4 t.v96.492.t)vQt.7%\
22.686.927.8M (t4.4%\
89. I 15.720.E2E (7 2"/.)
37.104.023.687 (3.6%)
booKmg re€s o.J /u.6) l.r+ /+
(0.60/o)
t2 Managem€nt
Fe
4U.dt6.OOt.OvJ
(3.9o/o)
l3
Profit Transfer 604.457.301(0.r%) Total
hakage
683.158.326.950 (l00%) 157.914.870.365 (100%) t.236.882.781.77 I
(lm%)
1.04t.372.5t9.3 39 {100%) Total Rerenue ofHotels
7.778.374.966.3 15
I .318.129.502.48 I 5.448.951.999.20 7 2.041.433.034.6 66 Percentage ol
Leakase 8.8% 12.0o/o 22-7U" 51.00
Arerace l*akage
[image:14.448.31.412.209.644.2]I
G. A. Okasuryawardani, KomangGde Bendesa, Made Antara &Agung Suryawan WiranclhaThe results show that the highest percentage of iourismleakage
fiomthe
accotrrnrcd?.tiorsector
in
Bali was on the 4,5 Star-rated chain hotels (51.0 %).[t
was followedby
the 4,5 Star-rated non-chain hotels (22-? Yo), and 1"2,3 Star-rated hotels (12.0 %). Meanwhile,the
lOwestleahge
wason
theNon
star-rated hotels (8.8%), see Figure 3. The averagetourism leakage
of
all
typesof
acconrnodationsin
year 2012 was 18.8%. These rcsultsindicate
that
(i) the higherthehvel
of hotel classification, the nnre leakage rvill be; and(ii)
the accornmdations which are nranagedby
intemational chain hotel systen-s and/cr ownedby
foreigners have rrore leakage thanothertype
ofaccorurodations.
The rxrreleakage, therefore the less revenue from tourism
will be
directly receivedby
hotel andundirectly
by
the
local conrrunity as
tourism
is
the nain
source
of
economicdevelopnrnt of
Bali
Province .Flgure
3Arerage Tourism
I*akage
ofAccorunodation
Sectorin
Bali
There
is
a needto
minirire
tourism leakage ft,om acconrmdation sector partictriarlS' inthe
d5
Star-rated chain and non-chain hotelsby
reducing the useof inported
lrlaductsand
services.One opportunfiy
in
reducinginported
products isto
provide
subslitute productsfor irrported
products.Anotheropportunity in
reducing leakage isto
rnininrizethe nun$ef
of
foreign
enployeeshired
in
the
star-rated hotelsby
local
emirloyees. However, qualityof
products and hunnn r€sources are crucial to be addressed in order to minimize tourism leakage.Reducing tourism
leakage nrcansgiving nnre
opportunity
for
local products
to
beconsunrcd
by
tourists,
andproviding
nnrejob
opportunitiesfor
local people.Lr
otherwords, less
leakage nrcansnnrc
benefits
for
local
people ftomtourism
It
will
bring irrplicationst9
the
irrprovenpntof
quality
of
life of the conrrunity, rmintaining qualityo f
environnrnt,
and b etter quality ery eriences for tourists'
CONCLUSION
C-alculation
of
tourism leakageon
acconrrndation sector in Bali shows that tht', highesi percentageof
tourism leakage on acconrnodation s ector was on lhe 4&5 Star-rated chainhotels
(51.0%),
followedby
the4,5
Star-rated non-chain hotels (22.7 Vo), and 1,2&3tffi
W"
8(}96
7M
6ry6
5@5 AUo
3M" 2M" lMo
o%
r
LIAKAGEI
NON LEAKAGI:4,5 Star-rated
Chain
Hotels
4,5
Star-
1.2,3Sfer-
f'lonStar-mt€d
Non rated
tatedchain
llotels
HotelsHotels
Tourism
l*akage
ofThe Accommodation Sector inBali
Star-rated hotels (12.0 %)- The lowest tourism leakage was on the Non-star rated hotels (8.S %). Ovei:all,
the
average tourism leakageon
accormpdation sector in Bali was 18.8%.
Theseresults
indicatethat
thc
higher the
levelof
hotel
classifications,the
nnreleakage
will be;
and
acconrrpdationwhich
wasrnnaged
by
intcrnational chain hotelsystem and/or owned
by
foreigner had nrore leakage than othertypes of accornrnodation.The
rnre
leakage, therefore the less revenue from tourismwill
be directly received byhotel
andundirectly by
the localconrnrnity
as tourism is therBin
sourceof
economicdevelopncnt
of Bali
Province.The
nrain sourcesof
tourism leakagefrom
acconrmdation sector were irrported foodand beverages,
paynrnt
for booking fees, overseasnnrteting
and stafftraining,paynrnt
for
foreign
enployees,
and
nanagement fees. Payrnentfor profit
transfer
for
theownenhip of
the accormrpdation was also been found as a sourte oftourismleakage on4&5
Star-rated chainhotels-
Tourism leakage fi,om acconrnodation sector needsto
be minimized.Inplication
of
successfulin
minimizing leakageis
gainingbetter
qualityof
life
for localconrrmnity
in destination.SUGGESTIONS
A
further
researchcould
be
undertakento
includeall
factors
that
are used
in
thecalculation
of
tourismleakage as nrcntionedin
the rnodelof
Unluonen, et. al' (2011) in orrderto
obtain
npre
accurate results. Moreover,it
is
suggestedto
develop a holisticstrategy
to
reduce tourism leakage from acconnndationsector
For future developnrcntof
acconmrodation sector inBali priority
should be givento
accorrrndations which areowned and/or managed
by
local and national company in order to ninimize the leakage and tonnximizn
the benefitsforbcal
corrnnrnity'References
Antara,
M.
(1999). Dampak Pengeluaran Pemerintah dan lf/isatawan Terhadap Kinerja Perekonomian Bali: Pendekatan social accounting matrix(Inpactsof
Governnrent and Tourism
Bpenditures
onBalls
Economy Perfonrnnce:A
Social accountingnatrix
approach). Unpublis hed Ph.D. Thes is. Bo gor AgriculturalInstitute. Bogor.
Bali
StatisticalOffice.
2011.Bali
inFigure'
Denpasar. Bali'Bali
StatisticalOffice.
2013.Bali in Figure.
Denpasar. Bali.Bull,
A.
1991. TheEconomicsofTravel andTourism
SecondEdition.Pitnan
andWiley, Melboume. Aus tralia.
Dewi, N.G.A.S. (2009). Peran
BaliTourism
Developrrcnt Corporation @TDC) DalamPengentasan Kemiskinan di Desa Bualu dan Tanjung Benoa, Kawasan Pariwisata
Nusa Dua
-
Bcli (Ihe
Role ofBali
Tourism Developnrcnt Corporation (BTDC) in PovertyAlleviation
in theVllages
of Bualu and Tanjung Beno4 Nusa DuaTourism Area
-
Bali). Unpublished MasterThesis. UdayanaUniversity. Denpasar.Dwyer,
L
and Forsyth, P. 1994. Foreign Tourism Investnrcnt Motivation and Inpact. Annuals of Tourism Research,2l(3),
512-55'l .Fridgen, J.D. (1996). Dimensions ofTourism. Fducational Institute
ofthe
Arnerican Hotel&
Iodging
Association. The United States ofArrerica.Harrison,
D.
(1992). Pro-Poor Tourism:A
CritQue.
Third World Quarterly.29(5)' pp.8sl-68.
I
G. A. OknSuryawardan| Komang Gde Bendesa, Made Antara & Agung Suryawan WiranalhoIludnnn,
LE,
and Hawkins,D.E
(1989). Tourism in Contenporary Society, PrenticcI{all,
Brglewood, NJ.Hughes,Hl
(1994). TourismMultiplier
Studies: A rmrejudicious apprcach.Journalof
..
Tsuism Management, 15: 401406,Kirq
H.
andT.Janal
(2007). Touristic Questforexistential Authenticity. Annalsof
Touism Research,34(I):
l8l-20 I .Kish,
L
(1965). SurveySarpling.
C,opyright by John Wiley&
son,Inc.Lbrary
of
Congress. United State of Anprica.
Iacher,
R G,
and S.I(
Nepal. (2010). From Irakages to Linkages:Ilcal-level
Strategies for Capturing Tourism Revenue in l.Iorthem Thailand. Tourism Geographies Journal.
l2(l\'.
71 -99.Ilndberg, D,
Krishnannorthy, E.M., and Stavenga, M.H.
(l9l).
Tourism Economics,JohnWiby.
NewYork
MrlL
R
C., and A.M. Morrison. (2009). TheTourism System. Kendall Hunt Publishing Conpany. The United States of Anrerica.Meyer, D. 2007. Pro-Poor Tourisrn From
kakages
toIinkages. A
C,onceptualFranpwork for Creating Linkages between the Acconnrpdation Sector and "Poor' Neighbouring C.onuunities. Current Issues in Tourism Joumal.
l0(Q:
558-583. Rodenburg,E
1980. Evaluation of The Social Econonic Affects of the Three Scales.Annals of Tourism Research, 7(2):177
-196.
Departnrnt oiAnthropology
Univen
ity
of C.alifo m ia.USA.Sevilla, C.Cr"
JA.Ochava,T.G
Punsalar4 B.P. Regah andG.G. Uriarte. (1993). Research Method. University of Indonesia.Smith, C.
&
Jenner, P.(192).
The Ieakage of Foreign Erchange Eamings from Tourisrn EIU Travel & Tourism Analyst,No. 3,52-66.Suryawardani,
I.GA.O.
(1999).AMarketing StrategyforAustralianApples
andOrangesin Indonesia.Graduate School
ofManagenrnt.
Facultyoflbonomic
Business andIaw.
Unpublished MasterThesis. The Universityof
Queensland. Australia. Suryawardani,I.GA-O-
(2010). Branding StrategiesforAgnibusinessEnterprises.Joumalon Socio-Economics of Agricuhure and Agribusiness.Vol
l0
(l).
14 February 2010.Unluonen,IC, A.
Kiliclair
and S. Yukel. (2011). TheGhulation
Approach forkakages
of Intcmational Tourism Receipts : The Turftish C-ase. Touism Eco no mics Jo u rn al. 17
(4\.
7 85 -W2.Wiranatha, A.S. (2001). A Systerm Model For Regional Planning towards Sustainable
Devdopnnnt
in BalL Indonesia. Unpublished Ph.D. Thesis. Departnrcntof
Creographical Sciences and Planning. The University ofQueensland. Australia.Wiranatha, A.S. and
A.A.G.R Dalem
(2010).Inplenpntation
oflocal
Knowledge"Tri
Hita Karana" on Ecotourism Managenrent in Bali. Joumal on Socio-Economics
of
Agriculture andAgnbusiness.Vol 10 (1). 14 February 2010.
Yamane. (1973). Determining Sanple Size. Chapter 3. Methodology. [cited 2012 Jun. 6]. Available from URL:
www.thapra.lib.su.acth/objects/thesis/fulltexlthapra/ ...lchapter3.pdf.
Zheng,Z.
Q0l1\.
Strategies forMinimizing
Tourismleakages in Indo-ChineseDevelopnrcnt C-ountries, Asia
PacificJournalofTourism
Research. 5(2): 1l-20.