THE EFFECT OF APPLYING RUBRIC IN PROCESS OF ASSESSING STUDENT’S ANSWERS ON MATHEMATICS AT JUNIOR HIGH
SCHOOL IN KENDAL DISTRICT
PUBLICATION ARTICLE
Research Paper
Submitted as a Partial Fulfillment of the Requirements
For Getting Bachelor Degree of Education
in MathematicsDepartment
Proposed By:
ANIS SHIHAFIYATAL ABIDA A410102002
TEACHER TRAINING AND EDUCATION FACULTY MUHAMMADIYAH UNIVERSITY OF SURAKARTA
THE EFFECT OF APPLYING RUBRIC IN PROCESS OF ASSESSING STUDENT’S ANSWERS ON MATHEMATICS AT JUNIOR HIGH
SCHOOL IN KENDAL DISTRICT
Anis Shihafiyatal Abida1 and Idris Harta2 1
Student of the Mathematics Department of UMS, my_cats08@yahoo.co.id
2
Lecturer Staff of Mathematics Department of UMS, idrisharta@gmail.com
ABSTRACT
This study is aimed to determine whether there is or not applying effect of rubric in the assessment process to obtain more objective score on the learning outcomes of mathematics learning at junior high school in Kendal district. This research used experimental research with static group comparison approach. The research was conducted in Mathematics Teacher Organization (MGMP) of junior high school with the math teachers in Kendal as the research subject. Determining the subject of the research conducted by random sampling technique in which each math teacher was considered to have the same perceived last. The data collection techniques use the test method. It is used to obtain the data from a class VIII student of SMP N 3 Cepiring. The data was the result of the assessment process undertaken by teachers within the scope of the sample. The data were analyzed using quantitative analysis method using descriptive statistics and inferential. Descriptive statistics are statistics used to analyze the data by self-describing mean, variance and standard deviation. Inferential statistics using t-test by taking the test requirement consisting homogeneity and normality test. In the analysis process of data obtained tcount < ttable < 0.946 2048 and is strengthened by the value significance of the hypothesis test (0176) greater than 0.05 (α = 5). Based on these result, it can be concluded that there was no effect of applying rubrics in the assessment process to obtain a score of student's answers to be more objective on the outcomes of mathematics learning at junior high school in Kendal district.
Keywords : rubrics, assessment, outcomes of learning
INTRODUCTION
The mathematical skill of Indonesia students is generally low. It is
influenced by many factors, one of which is a factor of the teacher's competency.
Teacher's Competencies, one of the competencies required of teachers, including
the mathematics teacher, is the ability to assess.
Assessment is a general term that includes all methods used to assess the
ability of students. Assessment is an activity that is designed to measure
the level of student's achievement in the learning gained through the
implementation of specific teaching program in a relatively short time.
(Sudaryono, 2012: 38).
A scoring system is done properly and in accordance able to measure the
level of a student's competencies. Assessment should provide accurate data on
student's competency. Assessment in mathematics learning process can be done in
various ways, including through an essay test.
The essay test requires students to remember and organize ideas or things
that have been learned by writing down the idea forward in the form of
Description. This typical test is suitable to applicate in the assessment of the
mathematics learning process. because learning often requires mathematics an
extensive material reasoning to raise the possibility of students that have different
ideas in solving a problem. Although they have different ideas, all of the student’s
answers are basically developing competence and understanding.
The scoring of each idea is the most important part of an assessment process
on the essay test. In scoring process of essay test with various ideas often lead to a
halo effect. The Halo effect is a brief assessment that often follow include
elements that are not relevant so it tends to produce less objective assessment. But
less objective scoring can be minimized by applying rubrics.
Mimi Haryati (2013: 28) explains that the rubric is a guideline used in
assessing the performance or results of student work. Tomoliyus (2012)
in Scientific Journal of Sports and Science ISSN: 2252-337, explains that the
rubric is a scoring guide that describes the desire criteria in assessing teacher or
gives the student's work level. Use appropriate rubric can help teachers assess
student's answers consistently results based on the criteria used to assess each
Diane Rosis (2011: 39) defines a rubric is one way of communicating standards
articulated before, during, and after the lesson study units.
A well-designed rubric can be a tool to communicate the standards and
criteria for awarding grades/scores capabilities is to be desired by the teacher to
the students. In addition, the uses of rubrics to ensure teachers are able to perform
the differences more closely or more accurately to variations in performance or quality of the student’s work. So that it will always be consistent based on the criteria used to assess each student's work results and reduce subjectivity in
assessing teachers.
Departing from the description above, the issue is examined wither there are
any effect of applying rubrics in the assessment process to obtain
score of the student's answers to be more objective outcomes of learning
mathematics in junior high school in Kendal district.
RESEARCH METHODS
The type of research conducted an experimental study with static group
comparison approach aimed to determine whether or not the effect of applying
rubrics on the assessment process of the student’s answers to learning outcomes
learning method. Paradigm in experimental studies of this model can be described
as follows:
Control group t1 X1
Experimental group t2 X2
t1 : Assessment without using a rubric
t2 : Assessment using the rubric
X1 : Assessment of the control group
X2 : Assessment in the experimental group
The research was conducted in the Mathematics Teacher Organization
Kendal. Determining the subject of the research conducted by random sampling
technique in which each math teacher was considered to have the same perceived
characteristics. The samples are 30 mathematics teachers were divided into
15 people as the control group and 15 people as the experimental group.
The data collection technique uses the test method. The test method is used
to obtain the data from a class VIII student of SMP N 3 Cepiring. The data of
student outcomes of learning are the result of the assessment process undertaken
by teachers within the scope of the sample.
Data was analyzed using quantitative analysis method which consists of
descriptive and inferential statistics. Descriptive statistics are statistics used
to analyze the data by self-describing mean, variance and standard deviation
obtained from the assessment in the form of outcomes of learning student by both
groups of samples. Inferential statistics using a t-test was used to analyze the data
obtained from the sample and the results are applicable to the study population.
Before being analyzed using t-test, the data obtained necessary prerequisite test
consisting of homogeneity and normality test.
RESULTS AND DISCUSSION
In this study, the research activities carried out in the two objects that
student in the classroom and 30 mathematics teachers. At the beginning of the
activities carried out the process of testing on students. After conducting tests,
researchers gave a judgment on each student's answers. From the results of
These assessments selected a results of the student’s answers will be assessed by
the two groups of teachers in the research samples.
After receiving the responses of the students who will be judged by a group
of samples, the researcher selected 30 math teacher of junior high school who
came to the meeting from the MGMP randomly. Of the 30 teachers were selected,
the researchers divided them into two groups. Both of the groups, the data
obtained from the results of assessment of student’s answer without using rubric
and the results of assessment of student’s answer using the rubric that have been
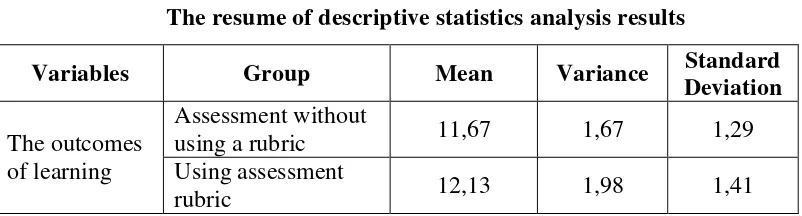
Descriptive statistics analysis used to analyze data by describing on the
research data have been obtained from two groups of samples. Data
distribution techniques used in descriptive statistics this is mean, variance and
standard deviation. The descriptive statistics analysis result was presented in
the following table:
Table 1
The resume of descriptive statistics analysis results
Variables Group Mean Variance Standard
Deviation The outcomes
of learning
Assessment without
using a rubric 11,67 1,67 1,29
Using assessment
rubric 12,13 1,98 1,41
Inferential statistics used to analyze data obtained from the sample and the
results are applicable to the research population. The analysis will be used in this
research is the t-test. Before analysis by using t-test, the data obtained research
results need to be first tested the prerequisite that consists of test homogeneity and
normality test.
The normality test is performed to determine whether the distribution of the
data is the result of learning the mathematics scores follow the standard
the normal distribution is the normal distribution or not. Analysis of the data
results obtained Lcount < Ltable which means the sample comes from a population that is normally distributed for each treatment group.
The normality test result was presented in the following table:
Table 2
The resume of normality test results
Variables Group Lcount Ltable Conclusion
The outcomes of learning
Assessment without
using a rubric 0.17 0.22 Normal Using assessment
[image:7.595.113.514.236.344.2]The result of the manual calculation above was reinforced by the results of
the normality test using SPSS. According to the Kolmogorov-Smirnov test and the
Shapiro-Wilk test, significance value of the data assessment without
using a rubrics 0.101. Then assessment using rubric have significant value
according to the Kolmogorov-Smirnov test is 0.127 and the Shapiro-Wilk test is
0.77. The significant value of two samples ware obtained
significance value > 0.05, it can be concluded that the two samples come from
populations with a normal distribution.
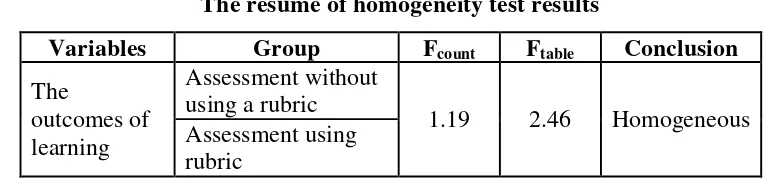
Homogeneity test was conducted to determine whether each group of
samples derived from a homogeneous population. Analysis of data
obtained results Fcount < Ftable which means each group of samples is derived from
a homogeneous population. The homogeneity test result is presented in the
[image:8.595.126.510.408.497.2]following table:
Table 3
The resume of homogeneity test results
Variables Group Fcount Ftable Conclusion
The
outcomes of learning
Assessment without using a rubric
1.19 2.46 Homogeneous Assessment using
rubric
The result of the manual calculation above was reinforced by the results of
the homogeneity test using SPSS. The homogeneity test used a significance
level of 0.05. Of the test obtained significant value for both samples, 0.924
so it can be concluded both samples come from populations having the same
variance or homogeneous.
After receiving the results of the prerequisite test (test for normality and
homogeneity tests) are eligible, and the results of assessment was made by
both groups of samples obtained from the data was later to be analyzed by t-test.
Analysis using t-test as a test of the hypothesis that gets results tcount < ttable is 0.946 < 2.048. It also was reinforced the hypothesis test with a significance value
(0.176) greater than 0.05 (α = 5%). It can be concluded that there was no effect of
answers to be more objective on the outcomes of mathematics learning at junior
high school in Kendal district.
From the results of the analysis, there was no significant difference between
the results of the assessment without using a rubrics and assessments using a
rubric. In this study, the mean of the results of the assessment without using a
rubric is 11,67, while the mean of the results of the assessment using the rubric is
12,13. This shows if the sample mean of the two groups only have
a bit difference.
Based on the results of the two samples of assessment there is no effect of
applying rubrics in the assessment process, so it is not in accordance with the
opinion of H. Purwanta, M. D. Roblyer and W. R. Wiencke, Adelaida
Ciudad-Gómez and Jesús Valverde-Berrocoso. H. Purwanta (2010) stated that through
the column prepared with clear and detailed as well as scoring on every item is
able to avoid the teacher of subjectivity during the assessment.
M. D. Roblyer and W. R. Wiencke (2003) states that current and anticipated
applications of the rubric include use by students as part of the post course
evaluations and by researchers and instructors as a tool to allow more
meaningful examination of the role of interaction in enhancing student
achievement and satisfaction in distance learning course. And Adelaida
Ciudad-Gómez and Jesús Valverde-Berrocoso (2014) revealed that rubric is a
reliable instrument for assessing the achievement attained by students through the
use of the criteria evaluated by the proposed activity.
The factors that cause no significant difference between the results of the
assessment without using a rubric with the results of using the rubric
assessment in this study is due to familiarity teacher assessment without using a
the rubric, so when using the rubric of teachers to be flexible in the process of
Irrespective of teachers to be flexible in the process of assessment,
the teacher discovered the benefits of using the rubric during assessments
using a rubric. The benefit is teachers to be more easily to analyze the industry of
each student so that the teacher can help students in understanding on these
aspects.
CONCLUSION
Based on the analysis and discussion that have been done in the previous
chapter, the researchers conclude that there is no effect of applying the rubric in
the assessment process to obtain a student’s answers scoring more
objective on the outcomes of mathematics learning in junior high school in
Kendal district. It can be based on analysis of data obtained tcount < ttable
is 0.946 < 2.048 and is strengthened by the value significance of the hypothesis
BIBLIOGRAPHY
Gómez, Adelaida Ciudad & Berrocoso, Jesús Valverde. 2014. “Reliability Analysis Of An Evaluation Rubric For University Accounting Students: A Learning Activity About Database Use” Journal of International Education Research–Special Issue Volume 10, Number 5.
Haryati, Mimin. 2013. “Model & Teknik Penilaian pada Tingkat Satuan
Pendidikan”. Jakarta: Gaung Persada.
Peraturan Menteri Pendidikan Nasional. 2007. “Peraturan Menteri Pendidikan Nasional Nomor 16 Tahun 2007 tentang standar kualifikasi akademik
dan kompetensi guru”. Jakarta: Departemen Pendidikan Nasional.
Purwanta, H. 2010. “Penggunaan Penilaian Berbasis Kelas Untuk Meningkatkan Kualitas Proses Dan Hasil Belajar Siswa Kelas IV SD Negeri Samirono Yogyakarta Pada Mata Pelajaran IPS”. Jurnal Penelitian Vol. 13, No. 2, Mei 2010, 147-168.
Roblyer, M. D., & Wiencke, W. R. 2003. “Design and use of a rubric to assess and encourage interactive qualities in distance courses”. American Journal of Distance Education, 17, 77–98.
Rosis, Diane. 2011. Assesmen sesuai Cara Kerja Otak. Jakarta: PT Indeks.
Sudaryono. 2012. “Dasar-Dasar Evaluasi Pembelajaran”. Yogyakarta: Graha Ilmu