EXTRACTION OF BENTHIC COVER INFORMATION FROM VIDEO TOWS AND
PHOTOGRAPHS USING OBJECT
-
BASED IMAGE ANALYSIS
M. T. L. Estomata a *, A. C. Blanco b, K. Nadaoka c, E. C. M. Tomoling a
a Environmental Systems Applications of Geomatics Engineering Research Laboratory, Dept. of Geodetic Eng‟g, College of Eng‟g, University of the Philippines, Diliman, Quezon City, Philippines – *[email protected], [email protected]
b Geodetic Engineering Faculty, College of Eng‟g, University of the Philippines, Diliman, QC, Phils. – [email protected] c Tokyo Institute of Technology, Ookayama, Meguro, Tokyo – [email protected]
Commission VIII, WG VIII/9
KEY WORDS: Marine, Oceans, Mapping, Bathymetry, Recognition, Object, Camera, Photography
ABSTRACT:
Mapping benthic cover in deep waters comprises a very small proportion of studies in the field of research. Majority of benthic cover mapping makes use of satellite images and usually, classification is carried out only for shallow waters. To map the seafloor in optically deep waters, underwater videos and photos are needed. Some researchers have applied this method on underwater photos, but made use of different classification methods such as: Neural Networks, and rapid classification via down sampling. In this study, accurate bathymetric data obtained using a multi-beam echo sounder (MBES) was attempted to be used as complementary data with the underwater photographs. Due to the absence of a motion reference unit (MRU), which applies correction to the data gathered by the MBES, accuracy of the said depth data was compromised. Nevertheless, even with the absence of accurate bathymetric data, object-based image analysis (OBIA), which used rule sets based on information such as shape, size, area, relative distance, and spectral information, was still applied. Compared to pixel-based classifications, OBIA was able to classify more specific benthic cover types other than coral and sand, such as rubble and fish. Through the use of rule sets on area, less than or equal to 700 pixels for fish and between 700 to 10,000 pixels for rubble, as well as standard deviation values to distinguish texture, fish and rubble were identified. OBIA produced benthic cover maps that had higher overall accuracy, 93.78±0.85%, as compared to pixel-based methods that had an average accuracy of only 87.30±6.11% (p-value = 0.0001, α = 0.05).
1. INTRODUCTION
1.1 Background of the study
Monitoring of coral reefs is the gathering of data and information on ecosystems or on those who use these resources (Hill & Wilkinson, 2004). The general process of monitoring is identifying the population of benthic components in a reef such as rock, rubble, algae and sand, dead or living coral (Kenchington & Hudson, 1984 as cited in Marcos, et al., 2008). Determining the benthic population is greatly dependent on the scale required for assessment (Marcos, et al., 2008). For areas of reef that need a resolution of not less than 25m2, the
typically-used monitoring methods are multi-spectral satellite imagery and aerial remote sensing (Mumby, et al., 2004). However, such methods require ground-truthing and acquiring such remotely-sensed images would require monetary costs. Also, reef monitoring in many countries cover a small and unrepresentative proportion, such that available data are insufficient for a quantitative assessment [18]. General visual monitoring methods are able to get information from broad to fine scale with the advantage of using inexpensive equipment, but these methods take a lot of time (Hill & Wilkinson, 2004). An alternative for monitoring is the use of digital equipment, which can greatly shorten the time in the field and reduce field expenses, since less time is required underwater as compared to visual methods (Hill & Wilkinson, 2004). The major drawback of using digital equipment is that data processing, such as digitizing, is very time consuming and equipment used are expensive (Hill & Wilkinson, 2004). Also, accurately and automatically mapping live benthic cover has remained extremely difficult to produce from multi-spectral images such as satellite images and aerial photographs, thus alternative methods of producing these maps still need to be investigated
(Bour, et al., 1996 as stated in [18]) such as the use object-based image analysis (OBIA). This method initially groups pixels into objects (also called segmentation) based on certain similarities (spectral information or external variable – such as height) (Addink & Coillie, 2010). Rules are then developed in order to automatically classify the image objects produced after segmentation. With the use of OBIA, the tedious task of digitizing and manually classifying benthic cover in the acquired videos and photographs may be eliminated.
1.2 Objectives and significance
Objectives. This research aims to develop an improved method of extracting benthic cover through OBIA with the use of underwater videos and photographs with corresponding bathymetric data. Applying the same theory used in a previous research (Levick & Rogers, 2006) to this study, the height component from the bathymetric data will aid in producing a benthic cover map with better accuracy as compared to pixel-based classification methods. The specific objectives of this research are as follows:
To investigate ways of georeferencing and mosaicking snapshots of the underwater videos, as well as means of rectifying the underwater video snapshots to the bathymetric data, given some constraints on data availability and quality;
To develop the OBIA rule sets for accurately and automatically classifying benthic cover;
To evaluate the performance of OBIA against commonly used pixel-based image classification algorithms.
Significance. Through this automated classification system, fast and frequent data acquisition of benthic cover such as living and non-living is possible to support reef studies that
require such information (Marcos, et al., 2008). Since precise data will be readily available, reef processes can be more realistically studied as well as serve as a quick aid in developing improved management strategies (Scopélitis, et al., 2010). Established Marine Protected Areas (MPAs) increase the importance of acquiring data from monitoring to determine if they are able to achieve their management goals (Hill & Wilkinson, 2004). MPAs in the Philippines will then be able to develop better management schemes, especially during these times of climate change when marine habitats are very vulnerable.
1.3 Scope and limitations
The main scope and focus of this research is to use object-based classification on underwater photos to extract cover information. Hence, the study mainly investigates the performance of OBIA vis-à-vis typical pixel-based spectral classifiers. It deals with the creation of rule sets necessary to obtain high classification accuracy using the OBIA approach. The chosen 50-meter transect was approximately 10 meters deep and the video used for producing the benthic cover map was taken at a 6-m depth, about 3-4 meters from the reef surface. Due to this distance of the camera from the reef and the absence of rocks, sea grass and other benthos, only a general classification was produced – coral, sand and rubble. Since a MRU nor a small bubble level were not available to ensure the vertical orientation of the underwater camera used during the fieldwork, georeferencing from one video snapshot to another lead to high root mean square error (RMSE), thus an uncontrolled mosaic (i.e. snapshots that were subjectively stitched together using Adobe Photoshop) was used as an alternative to create a panorama of the transect. An external motion sensor input for the MBES is the most important add-on because it compensates for roll, pitch and heave of the beams in real time but it was not available during the data gathering. Since corrections were not available and applied, the accuracy of the bathymetric data (vertical measurements) was not reliable enough for the underwater video snapshots to be georeferenced to it. Due to this, classification between elevated and non-elevated features could not be accurately performed. With the available MBES data, the uncontrolled mosaic was given only an approximate correction for scale and rotation, but its geographic location (horizontal measurements), through georeferencing to the relative depth of the MBES data, is accurate up to the centimeter level. A water level logger, which would record the rise and fall of tide, was also not available during the data gathering, thus a tide predictor program (WXTide) was used to supply tide information during the fieldwork. The data supplied by the program was used to generate corrections for the bathymetric data gathered by the MBES.
1.4 References
Acquisition and classification of underwater videos and photographs. Many studies have used video surveys and photographs to capture images of coral reefs, which were then used for classification. A study evaluated the different survey techniques used to validate maps derived from remotely sensed images and was able to conclude that among all survey techniques they evaluated, the best choice, if resources were unlimited and expertise was available, was the photographic transect, which was processed using the 1024 point analysis (Roelfsema, et al., 2006). Based on another study of these remotely sensed images, they said that manual delineation with
field validation resulted to the highest accuracy (Scopélitis, et al., 2010).
A research (Kaeli, et al., 2005) focused on deep water corals, which were present at around 30 – 100 meters, depths which are not reachable by SCUBA diving. Thus, the SeaBED Autonomous Underwater Vehicle (AUV) took the images, which were then analyzed using the existing random point method. They identified the Montastrea annularis complex, which was a dominant coral in their area and had a smooth texture. They also calculated the percent coverage of the coral upon classification.
Another study (Marcos, et al., 2008) which used underwater videos recorded them at a near-reef distance, where the video was approximately 30cm from the reef surface. The video was divided into 625 sub-images, which were then used to train the test set to classify between living (live coral and algae) and non-living (dead coral, sand and rubble). The classifier used was based on the Bayesian theory called linear discriminant analysis (LDA) and both color and texture features were inputs to the classifier system. 79% was the overall success rate of the near-reef videos and at shallower depths, like 3 meters, a recognition rate of 85% was acquired for the living and 75% for nonliving.
The neural network approach was also explored and used in a research (Marcos, et al., 2005).They captured the video at a constant range of 15-30 cm from the reef surface and the images that they classified were close-up of coral reefs. They used of a “feed-forward back-propagation neural network classification” to classify the images into three benthic categories: live coral, dead coral and sand. Color and texture features were inputs to the network and they were able to obtain 86.5% success rate for test images that were not included in the training set and 79.7% recognition rate for the same set of images.
A research (Scopélitis, et al., 2010) focused on satellite images and used three different classification methods – expertise-based, pixel-based and object-based. The expertise-based classification used ArcGIS 9.2 ® to apply visual analysis and manual delineation of polygons. These maps were the most accurate, based on the observation that sites for field validation were all classified correctly, thus they were used as reference so as to provide assessment of pseudo-error on the validity of the maps that were produced using pixel and object-based. All pixels of the reference image map were cross tabulated with the maps produced from object-based and pixel-based methods. The pixel-based classification was accomplished using ENVI 4.4®‟s maximum likelihood classification algorithm, which was trained using the sites which were known to be coral communities. Object-based classification used the software Definiens 7.0 ®, which divided the image to objects, which were then aggregated based on rules made by the user. The results of this research discovered that overall agreement of the object-based map with the expertise-based map was better than the pixel-based. Exploring the object-based classification method‟s capability in mapping benthic cover may lead to improved results such as higher accuracies and faster result acquisition.
Precision of multi-beam echo sounder. The precision of the use of multibeam echo sounding with high resolution, accompanied by positioning with high-accuracy was investigated in a paper (Ernstsen, et al., 2006). Repetitive bathymetric data of a shipwreck was measured using a high
resolution multibeam echo sounder (MBES) with a real-time long range kinematic (LRK ™) global positioning system. Four annual surveys were carried out and in a single survey, where seven measurements were acquired, revealed the precision of the MBES system, which was ±20 cm horizontally and ±2 cm vertically at a 95% confidence level. In contrast, a lower precision was produced when the four annual surveys were compared. The horizontal and vertical precision, at a confidence level of 95%, was only ±30 cm and ±8 cm, respectively. Still, it was concluded that the full potential of the MBES system did not correspond to the precision achieved in the study because these measurements could be improved through an increase in density of coverage (soundings/square meter) by reducing the vessel‟s survey speed.
Integration of high-resolution images with elevation data using OBIA. The fusion of RGB imagery and LiDAR with OBIA for classification as well as analysis of savanna systems were explored in a research (Levick & Rogers, 2006). They discovered that high resolution digital color imagery complemented with elevation data from Light Detection and Ranging (LiDAR) greatly enhanced the landscape‟s structural description by adding the factor of height. For the traditional pixel-based classification techniques (supervised classification, unsupervised classification, etc.), the complex system‟s heterogeneity at different scales was problematic. However, the object-based approach using the software eCognition was able to produce accurate classifications. Results from the study suggest that incorporating the component of height in classifying images as well as using OBIA increased the accuracy of resulting classification maps.
With this and with the possibility of acquiring very precise and reliable vertical and horizontal measurements from the MBES, exploring the possibility of combining bathymetric data acquired from the MBES and underwater photos may lead to higher accuracies in object-based classification. Though spatial resolution may vary between the underwater photos and the MBES data, the height information and their variation may still be used to enhance the classification. Investigating how to accurately georeference the underwater videos and mosaics to the bathymetric data must also be undertaken in order to get reliable results.
2. MAIN BODY OF TEXT
2.1 Study area &conceptual framework
Puerto Galera is a municipality in the northwestern part of the province of Oriental Mindoro, Philippines. Its location is at the Isla Verde Passage‟s southwestern end. Studies in the early 1980s, found that the Puerto Galera area has one of the highest number in the world in terms of marine species.1 The Coral
Garden is a dive spot that is 10 minutes away by boat from Puerto Galera mainland and its maximum depth is around 12 meters.
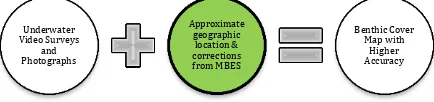
Figure 1 – Final concept applied for the study
1 Wikipedia <http://en.wikipedia.org/wiki/Puerto_Galera>
From the theory of combining RGB imagery and LIDAR data with OBIA (Levick & Rogers, 2006), combining high resolution bathymetric data and underwater photos with OBIA may produce a benthic cover map with higher classification accuracy. In this methodology, the videoed transect will also be given a geographic location through the bathymetric data, which may be very precise given a good set of echo sounding and positioning systems, with attachments such as a gyrocompass and a motion sensor. Figure 1 illustrates the final concept applied due to limitations of the available data.
2.2 General procedure
Figure 2 – General flow of procedure done in the research
Figure 2 illustrates the general flow of the procedure done in this research and will be discussed in more detail in the subsections to follow.
Data acquisition.Two scuba divers laid a 50-m tape along an area with various types of benthic cover and took a video at a distance of 3 meters from the reef surface. The recorded video, which was taken by swimming along the transect at a constant speed, was taken at around 10:00 – 12:00, which was within the time for best lighting conditions that is between 08:30 – 15:30 (Hill & Wilkinson, 2004). The instrument used to take photos and videos was a Canon S95 placed in an underwater casing, with the setting of the camera at video mode, automatic focus and the resolution setting was 1280x720 at 24 frames per second. The multibeam echo sounder ES3 was used to gather bathymetric data over a large area, which covered the transected line. It was setup on a boat, which moved at a slow speed in order to obtain data with high density. Two dual frequency antennas for the Trimble ® SPS461 DGPS (differential geographic positioning system – GPS)/Beacon Receiver were placed on each end of the boat to track the movement of the vessel as well as to give geographic location to the bathymetric data measured by the MBES. It was used in the mode real-time kinematic (RTK) satellite navigation, thus giving it a centimeter level accuracy. A high resolution QuickBird image was also used during the survey in order to double check the geographic location being recorded. Lastly, a hand-held GPS was used to record the location of the drop off point of the divers.
Pre-processing of handheld GPS and MBES data. The hand-held GPS data was re-projected using the re-project feature command of ArcGIS 9.3 in order to convert the point to UTM Zone 51N. A tide predictor program (WXtide47 [www.wxtide32.com]) was used to produce a tide chart that was used to compute tide correction values. These values were used to adjust and correct the data acquired by the MBES. An approximation of the length and width of the reference coral Underwater
Video Surveys and Photographs
Approximate geographic location & corrections from MBES
Benthic Cover Map with
Higher Accuracy
Data Gathering Pre-processing &
Corrections Georeferencing
Manual Delineation Classification
Methods Accuracy
Assessment
Comparison & Conclusion
was used to help locate it in the bathymetric data and the probable location of the transect line was determined by measuring a 50±5-meter distance from the reference coral. An XYZ format of the distribution points was exported and converted to elevation by inverting the depth values simply by multiplying each value with -1. A polygon was created to clip the bathymetric data points, which were then interpolated to raster using Inverse Distance Weighted (IDW). Neighborhood statistics (mean) using a circular neighborhood with different radiuses was applied to determine the mean value of pixels at a certain radius (1m, 7m, etc.). The neighborhood statistic results were subtracted from the original interpolation to determine the relative elevation, which were most probably corals if these areas are higher than its surroundings
Pre-processing of underwater videos. The underwater video used had good resolution and water clarity to sufficiently recognize features of organisms. This video was cut into snapshots, which had to have overlapping areas in order to reference one image to another. Four approaches for registration and georeferencing were applied to the photos and were the following: (1) sequential image registration, (2) control images to bathymetric data, (3) control images to tape distance and (4) uncontrolled mosaic to bathymetric data. The first three approaches resulted to extremely warped images and mosaics, since the video did not have corrections for pitch, roll and yaw, thus the fourth approach (uncontrolled mosaic to bathymetric data) was used for this research. Due to this difficulty with image registration and georeferencing, the snapshots were manually „stitched‟ together in Adobe Photoshop instead, to create a photo-mosaic, which was an alternative in order to obtain a dataset with better resolution and water clarity (Hill & Wilkinson, 2004). The snapshots used were those that were most parallel to the seafloor in order to get the most upright views of the features. Each photo was subjectively scaled and adjusted to fit with the first image used. Since no georeferencing was applied, mosaicking in ENVI 4.3 and ArcGIS 9.3 cannot be accomplished, thus, it was done instead in Adobe Photoshop. Auto blend was applied to the uncontrolled photo-mosaic to eliminate the lines made by the boundaries of each snapshot. Finally, linear stretching was applied using ENVI 4.3. The processes that were applied and used on the snapshots were done in order to end up with a photo mosaic that may not be accurately made but was useful for classification purposes.
Georeferencing. The locations of the corals in the relative bathymetry were determined based on its similarity with features present in the mosaicked photos of the transected area. Higher values represented the elevated features, which suggested that these were the corals, while lower values represented non-elevated features (most probably sand or rubble). Since the bathymetric data from the MBES had correct geographic location, the uncontrolled mosaic was then georeferenced based on it, to give the mosaic scale and rotation corrections. 33 control points, used to georeference the mosaic to the relative bathymetry, were evenly spread out through the entire photo gaining a root-mean-square error (RMSE) of 0.64185.
Masking: Before the georeferenced mosaic could finally be used for classification, a mask for the area outside the said image was built and applied on the mosaic such that areas that were not useful had a value of zero in order to remove the unnecessary parts of the photo during classification.
Pixel-based image classification: Four classifications were used on the unstretched and linear stretched mosaic, namely: supervised classification, unsupervised classification, unsupervised with supervised classification (also known as hybrid classification in remote sensing (Richards & Jia, 2006)) and OBIA. The supervised classification requires training pixels that have known spectral values and class. There are multiple algorithms under supervised classification (Richards & Jia, 2006) but the algorithm used in this research was the Maximum Likelihood where regions of interest (ROIs) were manually chosen and were used as training pixels to guide the algorithm in its classification. Five ROI classes were used and were the following: dark sand, light sand, dark coral, light coral and rubble. Two training classes were assigned for sand due to the lighting condition and shadows though linear stretching was somehow able to compensate for the attenuation by the water column. The spectral separability between chosen pairs of ROI for a given file was calculated using the Compute ROI Separability option of ENVI 4.3. The values ranged from 0 to 2.0, which indicate how statistically separate an ROI pair was. ROI pairs with pair separation values greater than 1.9 had good separability while those having values below 1 had very poor separability (ENVI User‟s Guide). Due to the very poor separability between rubble and dark sand (~0.1823), maximum likelihood was ran again using only 4 ROIs, excluding rubble to maintain a high pair separation.
Unsupervised classification determines classes purely on the spectral differences of features. The iterative self-organizing data analysis (ISODATA) computes for the class means, which are evenly distributed in the data space. It then clusters iteratively the rest of the pixels using minimum distance techniques (Richards & Jia, 2006). ISODATA was used on both mosaics, where it was programmed to produce 4 to 5 classes with five iterations. Combining of classes was applied in order to get 3 classes only.
Hybrid classification is the combination of unsupervised and supervised classifications (Richards & Jia, 2006) and was done to further explore which method would yield the highest accuracy. This was accomplished by creating a 5-iteration ISODATA classification set to produce 20 to 40 classes. The resulting 40 classes were then manually combined to form a classification map with three classes.
Classification using object-based image analysis: The last classification, object-based image analysis, was done using the software eCognition 8.7 by Definiens ®. The developed rule set was done through a Process Tree and had 4 general processes: image segmentation, classification, refining of classification and exportation. “Multi-resolution segmentation” was chosen as the method for image segmentation because the objects of interest in an image appear on different scales at the same time (Baatz & Schäpe, 2000). Segmentation settings and composition of homogeneity are all defined by the user and were replicated from eCognition Webinar, except for the scale parameter, which is an adjustable quantity that may be modified to meet the criteria for adaptability. In eCognition, the scale parameter is a measure of homogeneity and as it increases, the algorithm allows more merges and in turn, also lets the region become larger (Zhang & Maxwell, 2006). The image objects, produced during the image segmentation process were initially unclassified and went through the rule set for classification and refining of classification. The classification used spectral conditions (mean of blue and green bands) to remove the black boundary surrounding the image. It also used multiple spectral conditions (mean and standard deviation of different bands) to
initially separate the sand and coral classes and to further separate them, spectral and neighborhood conditions (distance to objects) were applied. To identify rubble from sand, standard deviation of the spectral information of the image objects were used. Additional rule sets were included in order to further refine the classification of the image. Shape (such as area) and neighborhood conditions (distance to another object) were ran in order to refine the classification between coral, rubble and fish. All unmerged objects of each respective class were then merged before finally exporting the classification map, which was Geocoded so as to inherit the projection of the georeferenced mosaic.
Manual Delineation:To accomplish an accuracy assessment, a reference benthic cover map was produce by manually digitizing features such as corals, sand, rubble and fish based on the mosaic with the use of the editor tool in ArcMap 9.3. The assigning of benthic cover on the features was based on an expert‟s knowledge as how he/she interpreted the features in the mosaic.
Accuracy assessment: Confusion matrices produced by ENVI 4.3 gave results such as the overall accuracy, the errors of omission and commission, the producer‟s and user‟s accuracy and the kappa statistic. The overall accuracy was acquired by dividing the number of correctly classified pixels by the total number of pixels. The problem with overall accuracy is that it does not show if some classes are good or bad classifications. This is where the user‟s and producer‟s accuracy as well as the errors come in and help determine which classes are problematic and which ones are good enough. Errors of commission (incorrectly classified pixels divided by the total pixels claimed to be in the classification) occur when pixels of a class were incorrectly identified to a different class. On the other hand, errors of omission (sum of the non-diagonal values of a column divided by the total number of pixels) occur when pixels were simply unrecognized and not identified to belong to a certain class. To compute for the user‟s accuracy, simply divide the number of correctly classified pixels by the total number of pixels claimed to be in that class. Meanwhile, the producer‟s accuracy was computed by dividing the number of correctly identified pixels by the total number of pixels that were actually in the said reference class. The user‟s accuracy related to the commission error or inclusion, while the producer‟s accuracy associated with omission error or exclusion. Cohen‟s (1960) kappa statistic (k) may be used to represent as a quantity of agreement between reality and the model predictions (Congalton, 1991).
Comparison and conclusion: The final step was to compare the performances of the different classification methods and to finally conclude which method was most capable of classifying benthic cover maps.
3. RESULTS & DISCUSSIONS
Georeferencing and mosaicking: The difficulty with image registration and georeferencing lead to manually „stitching‟ together of the snapshots in Adobe Photoshop to create an uncontrolled mosaic. The snapshots selected were those that were most parallel to the seafloor and were subjectively scaled and adjusted to fit with the first image used.
Performance comparison of classification methods: Based on the average overall accuracies (and average kappa statistic), object-based image analysis resulted to the best accuracy with an average of 93.78% (0.8754), followed closely by hybrid
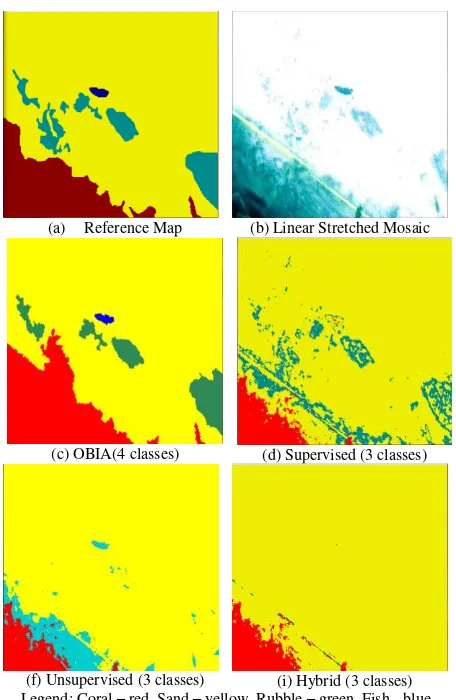
classification with 92.69% (0.8495). Supervised classification performs well when the rubble class is not included in the training classes and behaves averagely when the said ROI class is included (about 85% and 0.7308 on the average). Unsupervised classification resulted to the lowest accuracies (average of 84.59% and 0.7119); depending on which classes were combined and on what masking was used. Figure 3 illustrates the classification maps of different algorithms of a sample area.
(a) Reference Map (b) Linear Stretched Mosaic
(c) OBIA(4 classes) (d) Supervised (3 classes)
(f) Unsupervised (3 classes) (i) Hybrid (3 classes) Legend: Coral – red, Sand – yellow, Rubble – green, Fish - blue
Figure 3. Classification maps of the different algorithms of a sample area
The trend of accuracies of the different classifications was dependent on the classes being identified. All classifications were able to perform well when only 2 classes were being distinguished, while supervised and unsupervised classifications got lower accuracies when rubble was included. Hybrid classification, though it was able to obtain high accuracies even with the inclusion of rubble, was very tedious due to the manually combining of classes. OBIA, which was automated, was also able to get high overall accuracies regardless of the number of classes (even including fish) being identified. The average producer‟s and user‟s accuracy for OBIA were the following: coral – 95.00% and 92.86%, sand – 94.23% and 96.56%, rubble – 17.38% and 27.39%, and fish – 37.16% and 50.24%. The low user‟s accuracy for both fish and rubble is due to the over mapping of the classes, where more pixels are included in the class (Rossiter, 2004). More pixels though, would mean higher chances of them being a part of the actual ground truth class, but if they are not part of that reference class, it leads to lower Producer‟s accuracy as well. Clearly, the rule sets will need to be improved to acquire better
accuracies for fish and rubble. Still, even with such low producer/user‟s accuracies, the overall accuracies obtained were still high, unlike in the pixel-based classification.
Advantages of OBIA approach: The developed rule set is transferrable and applicable to similar aims of obtaining benthic cover maps. With a little tweaking of the rule sets, similar outputs may be obtained quickly.
Potential improvements: Aside from improving the rule sets, use of more accurate bathymetric data and image ratioing (blue/red and green/blue rations) will further increase the accuracy of OBIA classification.
4. CONCLUSIONS & RECOMENDATIONS
Georeferencing and mosaicking: The generated uncontrolled mosaic was able to produce an acceptable replica of the actual transected area and registration to the bathymetric data was able to yield good results. Therefore, in such cases where limitations of the available data hinder the production of a useful photo-mosaic, Adobe Photoshop is a useful and capable alternative.
Performance of OBIA against pixel-based image classification: Pixel-based classification methods are capable of classifying underwater photos to benthic cover maps with high accuracy as long as only a general classification is required of off them, such as living (coral) or non-living (sand) classes. Inclusion of other classes, such as rubble and fish, confuses the classification methods such as supervised and unsupervised classifications. Hybrid classification was the only pixel-based algorithm that was able to perform well even with orders of classifying more than 3 classes. As for the object-based classification, which was capable of automatically identifying 4 classes, it was able to perform significantly better than the individual classifications, which were supervised (p-value = 0.0152, α = 0.05), unsupervised (p-value = 0.0005, α = 0.05) and hybrid classification (p-value = 0.0377, α = 0.05). Against all pixel-based classifications, OBIA was significantly able to generate more accurate results (p-value = 0.0001, α = 0.05). Therefore, OBIA is a method capable of automatically and accurately classifying benthic cover other than living (coral) and non-living (sand).
Recommendations: Geotagging by GPS coordinates collected by a snorkeler swimming directly on top of the diver doing the video capture can provide approximate coordinates to the video, which may be enough for some applications and will also facilitate the matching of photos with the MBES data. But more accurate georeferencing and mosaicking (or mosaicking and georeferencing) is needed for accurate monitoring of reef conditions. In order to obtain the full potential of OBIA, accurate bathymetric data and underwater videos would be required. To minimize errors in the recorded underwater videos and to be able to record at any depth, an AUV with a motion sensor may be a better alternative in recording transects. If motion sensors are not available for the underwater camera, a bubble level may be used instead to maintain the vertical orientation of the video to the seafloor. If this level is still not available, recording should just be done in such a way that the camera is always perpendicular to the seafloor so as to obtain images that are directly beneath the camera‟s lens. This way, georeferencing and image to image registration will have minimal distortions and occlusions. Controlled lighting during image acquisition is also recommended to minimize variations in the spectral characteristics of the images. Stereo pairs, as done in photogrammetry, may also be attempted in order to fully model and recreate image acquisition geometry and to
obtain relief information of the reef, which can also be used to identify elevation of benthic cover. With such information, height may be used in the rule sets in order to identify elevated and non-elevated features. For this case, however, ground controls are needed for absolute orientation but can be very difficult to provide.
5. REFERENCES
Addink, E. & Coillie, V., 2010. “Object-based Image Analysis,” GIM International:
http://www.gim-international.com/issues/articles/id1469-Objectbased_Image_Analysis.html (28 Jan. 2010).
Baatz, M. & Schäpe, A., 2000. Multiresolution Segmentation: an optimization approach for high quality multi-scale image segmentation.
In: Strobl, J., Blaschke, T., Griesebner, G. (Eds.),
AngewandteGeographische Informationsverarbeitung, vol. XII.
Wichmann, Heidelberg, p. 3.
Cohen, J., 1960. A coefficient of agreement of nominal scales. In:
Educational and Psychological Measurement, pp. 3-5
Congalton, R.G., 1991. A review of assessing the accuracy of classification of remotely sensed data. In: Remote Sensing Environment, p. 40. ENVI User‟s Guide
http://geol.hu/data/online_help/DefiningRegionsOfInterest.html
Ernstsen, V., Noormets, R., Hebbeln, D., Bartholoma, A. & Flemming, B., 2006. Precision of high-resolution multibeam echo sounding coupled with high-accuracy positioning in a shallow water coastal environment. In: Geo-Marine Letters, Vol. 26, Issue 3, pp. 141-149.
ES3PT including ES3 Operating Software User Manual v.1.4 http://www.odomhydrographic.com
Hill, J. & Wilkinson, C., 2004. Methods for Ecological Monitoring of Coral Reefs. Australian Institute of Marine Science, pp. 1-100
Kaeli, J., Singh, H. & Armstrong, R., 2005. Morphological Image Recognition of Deep Water Reef Corals.
Levick, S.R. & Rogers, K.H., 2006. LiDAR and Object-based Image Analysis as Tools for Monitoring the Structural Diversity of Savanna Vegetation. In: Int’l Archives for the Photogrammetry, Remote Sensing and Spatial Information Sciences, Vol. 34, Part XXX, 6 pp.
Marcos, M.S.A.C., David, L.T. & Soriano, M.N., 2008. Area-Calibrated Automation of Coral Classification for Near and Subsurface Reef Videos. In: Proceedings of the 11th International Coral Reef Symposium
, Ft. Lauderdale, Florida, Session 16, pp. 1-5.
Marcos, M.S.A.C., Soriano, M. & Saloma, C., 2005. Classification of coral reef images from underwater video using neural networks. In: Opt. Express, Vol. 13, Issue 22, 13:8766–8771
Mumby, P.J., Skirving, W., Strong, A.E., Hardy, J.T., LeDrew, E.F., Hochberg, E.J., Stumpf, R.P., & David, L.T., 2004. Remote sensing of coral reefs and their physical environment. In: Marine Pollution Bulletin, Vol. 48, pp. 219-228.
Richards, J.A., & Jia, X., 2006. Remote Sensing Digital Image Analysis: An Introduction 4th Edition, Springer-Verlag Berlin Heidelberg, Germany, pp. 193-263 & 295-302
Roelfsema, C.M., Phinn, S.R. & Joyce, K.E., 2006. Evaluating Benthic Survey Techniques for Validating Maps of Coral Reefs Derived from Remotely Sensed Images. In: 11th Int’l Coral Reef Symposium, Okinawa, Japan, Int‟l Coral Reef Society, 10 pp.
Rossiter, D.G., 2004. Technical Note: Statistical methods for accuracy assessment of classified thematic map. In: Technical Report ITC, Enscheda, NL, April 2004, 46 pp., also available online at http://www.itc.nl/personal/rossiter/teach/R/R_ac.pdf
Scopélitis J., Andrefouët S., Phinn S., Arroyo L., Dalleau, M., Cros, A., Chabanet, P., 2010. The next step in shallow coral reef monitoring: combining remote sensing and in situ approaches. In: Marine Pollution Bulletin, 2010, 60 (11), p. 1956-1968. ISSN 0025-326X
Trimble SPS 461
http://gps-is.com/main/page_marine_gps_sps_series_sps461.html
Wilkinson, C., 2008. Executive summary of status of coral reefs of the world: 2008. Australian Government, Australian Institute of Marine Science (AIMS), Townsville, p. 10.
Zhang, Y., & Maxwell, T., 2006. A fuzzy logic approach to supervised segmentation for object-oriented classification. In: ASPRS 2006 Annual
Conference, Reno, Nevada, May 1-5, 2006
6. ACKNOWLEDGEMENTS
This research was supported by CECAM project, funded by ERDT-DOST and had full guidance from Dr. Ariel C. Blanco.