GROUND DEFORMATION MONITORING USING RADARSAT-2 DINSAR-MSBAS AT
THE AQUISTORE CO
2STORAGE SITE IN SASKATCHEWAN (CANADA)
Magdalena Czarnogorska*a, Sergey Samsonov*a, Don Whiteb a
Canada Centre for Mapping and Earth Observation, Natural Resources Canada, Ottawa, ON, Canada,
*Email: [email protected], [email protected], bGeological Survey of Canada, Natural Resources Canada, Ottawa, ON, Canada
Commission I, WG I/2
KEYWORDS: satellite radar interferometry, DInSAR, MSBAS, ground deformation, Aquistore, Saskatchewan, Canada
ABSTRACT:
The research objectives of the Aquistore CO2 storage project are to design, adapt, and test non-seismic monitoring methods for measurement, and verification of CO2 storage, and to integrate data to determine subsurface fluid distributions, pressure changes and associated surface deformation. Aquistore site is located near Estevan in Southern Saskatchewan on the South flank of the Souris River and west of the Boundary Dam Power Station and the historical part of Estevan coal mine in southeastern Saskatchewan, Canada. Several monitoring techniques were employed in the study area including advanced satellite Differential Interferometric Synthetic Aperture Radar (DInSAR) technique, GPS, tiltmeters and piezometers. The targeted CO2 injection zones are within the Winnipeg and Deadwood formations located at > 3000 m depth. An array of monitoring techniques was employed in the study area including advanced satellite Differential Interferometric Synthetic Aperture Radar (DInSAR) with established corner reflectors, GPS, tiltmeters and piezometers stations. We used airborne LIDAR data for topographic phase estimation, and DInSAR product geocoding. Ground deformation maps have been calculated using Multidimensional Small Baseline Subset (MSBAS) methodology from 134 RADARSAT-2 images, from five different beams, acquired during 20120612-20140706. We computed and interpreted nine time series for selected places. MSBAS results indicate slow ground deformation up to 1 cm/year not related to CO2 injection but caused by various natural and anthropogenic causes.
1. INTRODUCTION
The research objectives of the Aquistore CO2 storage project are to design, adapt, and test non-seismic monitoring methods for measurement, and verification of CO2 storage, and to integrate data to determine subsurface fluid distributions, pressure changes and associated surface deformation. The test area is located west of the Boundary Dam Power Station in southeastern Saskatchewan, Canada. Several monitoring techniques were employed in the study area including advanced satellite Differential Interferometric Synthetic Aperture Radar (DInSAR) technique, GPS, tiltmeters and piezometers.
DInSAR technique was first applied for monitoring CO2 injection-related ground deformation at the In Salah field in Algeria where vertical rate of about 5 mm/year was measured. DInSAR data, gathered over the In Salah CO2 storage project showed that that this advanced Earth Observation (EO) method is an effective tool for monitoring the geological storage of CO2 [Vasco et al., 2010]. In this paper, we performed DInSAR-MSBAS analysis to recognize and assess the ground stability of the Aquistore injection site for the 2 years from June, 2012 to July, 2014, when CO2 injecting process have not started, yet. Calculated DInSAR deformation maps will be used as background information to assess the ground stability of the site during the on-going monitoring of CO2 injection procedure, the associated subsurface pressure perturbations and the storage. DInSAR deformation maps will be used as an independent data source for validation of geomechanical monitoring.
2. LOCATION
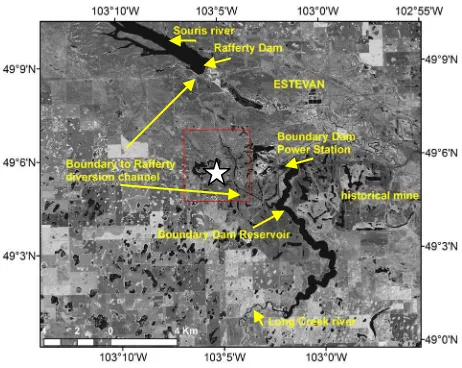
Aquistore site is located near Estevan in Southern Saskatchewan on the South flank of the Souris River. The Souris River rises in the Yellow Grass Marshes north of Weyburn, and passes Saskatchewan and Manitoba provinces and goes downstream to North Dakota. The river is about 700 km in length and drains about 61,100 km2. Much of its drainage basin is fertile silt and clay deposited by former glacial Lake Souris. Aquistore site is located both in the Boundary Dam Power Station property and the historical part of Estevan coal mine – Figure 1. In the Estevan surrounding area large open mining operation has been carrying in the south and east of the city since 1892. The part of the test area is an old open pit coal mine reclaimed to a depth of ~20-25 m. The ground elevation ranges from about 530 m in the Souris river channel area to about 593 m in the west south in post mining area, and resulted by both morphological processes related to the last glaciation and surface mining in the last century. Around Aquistore site there are located two earth fill dams as Boundary Dam built in 1957 on the Long Creek river and Rafferty Dam built on the Souris River in 1991. There is 10-kilometre diversion channel connecting Boundary and Rafferty which allows water to be diverted from Long Creek into Rafferty Reservoir.
Figure 1. RapidEye satellite image dated 12/08/2012 (DD/MM/YYYY) showing an overview of the Aquistore site marked by red square and surrounding area. Aquistore injection site is marked by star.
3. GEOLOGICAL SETTING
The Deadwood and Winnipeg formations are the deepest sedimentary units in the Williston Basin, and are below all oil producing and potash-bearing formations in the region [Norford et al. 1994]. They lay on granite and metamorphic rocks similar to those of northern Saskatchewan’s Precambrian Shield which are dense, hard rocks that have no storage potential. The Deadwood and Winnipeg formations are simply sandstone formations that are more than 3000 m deep, and are filled with very saline water. While these formations are defined as aquifers because they contain water, they do not contain drinkable water, or water that could be used for any agricultural purpose; this water is four to five times saltier than the ocean. These formations cover a vast area in west-central North America. In the targeted area they have no currently identified economic potential, other than as storage units for greenhouse gases. Together the Deadwood and Winnipeg formations create a very deep saline geologic package known as a flow unit [Bachu and Stewart, 2002]. Similar deep saline formations are found elsewhere in western Canada, throughout North America and in the world. The rocks in these formations provide the best targets for geologic storage of CO2 because they are highly porous and permeable, have huge volumes, and have effective barriers and geologic seals that can retain CO2.
4. SAR DATASET
The C-band RADARSAT-2 data has been collected since June 2012 in order to map background deformation over the study area. The RADARSAT-2 data revisit period is 24 days. For this project we have collected data from five beams presented in Figure 2 and Table 1: ascending and descending geometries of Spotlight with very high resolution of 1.6x0.8 m, ascending and descending geometries of Wide Ultra-Fine with moderate resolution of 1.6x2.8 m and descending geometry of Fine Quad-Polarization with coarse resolution of 5.2x7.6 m, in range and azimuth directions. Such acquisition configuration allowed us to increase image frequency to 6 days on average in order to
achieve nearly continuous temporal SAR coverage. Here, we provide updated DInSAR-MSBAS results based on over one hundred RADARSAT-2 images acquired during June 2012 - July 2014.
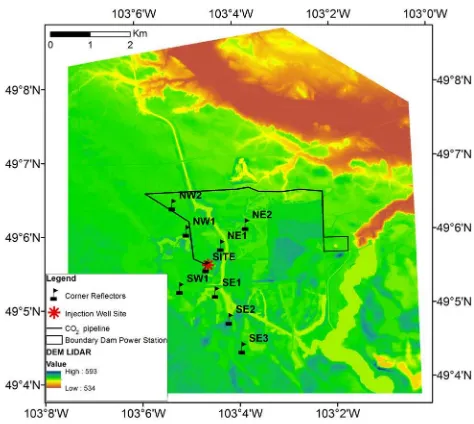
Figure 2. Location of the Aquistore project study area (denoted by orange asterix), southeastern Saskatchewan. Ascending and descending RADARSAT-2 frames used in the study are outlined in black. Background is 30m ASTER Digital Elevation Model. Test injection site is covered by 1m LiDAR Digital Elevation Model.
Table 1. RADARSAT-2 dataset used in the study: beam, time span (in format YYYYMMDD), azimuth (Θ), incidence angle
Light Detection and Ranging (LiDAR) was used to produce continuous elevation data of the Earth’s surface and overlying features with high accuracy and precision. The technology is similar to radar but measures distance by illuminating a target with a laser pulses instead of radio waves and combined with GPS to create a three dimensional set of points (point cloud).
LiDAR robust technology can create a number of mapping products as Digital Elevation Models (DEM), Digital Terrain Models (DTM), and other contour and slope maps [Axelsson, 1999].
We used LiDAR elevation data initially for topographic phase estimation, and then for DInSAR product geocoding (transformation of SAR coordinates into WGS84). LiDAR elevation data was acquired during two acquisition flights dated 20111111 and 20111112 (YYYYMMDD) covering an area of 80.1 km2 (Figure 3). Horizontal accuracy of LiDAR data is 45 cm and fundamental vertical accuracy on flat hard surfaces is 30 cm. We used 1m Grids (32 bit GeoTIFF) Bare Earth digital format deliverable reprojected to WGS84.
Figure 3. Detailed location of Aquistore injection site. The background is LiDAR DEM. Corner reflectors are marked with a flag and named: SITE (Aquistore injection site), NE1-NE2, NW1-NW2, SE1-SE3 and SW1.
Complete calibration on two LiDAR acquisition flights has been performed and data was acquired over a calibration site flown with two passes in opposite directions, before and after the flight. Any error which has been observed in the attitude of the aircraft (roll, pitch and heading) was corrected. To statistically quantify the accuracy, the LiDAR data was compared with independent surveyed ground points. Geodetic survey was done using a GPS mounted truck which has collected data while driving on an open road. The kinematic positions on the road were post-processed from a nearby base station, common to the aerial survey.
6. CORNER REFLECTORS
For mitigating temporal de-correlation and for improving precision of DInSAR measurements during the winter months when ground is covered by snow, paired corner reflectors were installed at nine monitoring sites suitable for ascending and descending imaging (Figures 3 and 4). Monuments depth is 4 m and monument height above ground is 2 m. Two GPS antennas also were installed on two DInSAR monuments (SITE & SE03) to evaluate relative stability of shallow monuments with respect to deep ones [Craymer et al., 2013].
Figure 4. (On the left photo) Instalation works of corner reflectors, (on the right photo) corner reflector suitable for ascending and descening imaging with GPS receiver.
7. DINSAR TECHNIQUE
DInSAR is an advanced tool for measuring ground deformation with sub-centimeter precision and high spatial resolution and coverage [Massonnet and Feigl, 1998, Rosen et al., 2000]. Classical DInSAR is used to calculate interferogram which is performed from two SAR images acquired by identical space- and/or air-borne sensors and gathered at different times showing ground deformation. Spatial resolution of the recent SAR sensors ranges from 1 to 20 m over areas from 10 × 10 km to 300 × 300 km, and the repeat cycle ranges from one day to a few weeks, but the typical repeat cycle for a single satellite mission ranges from 24 to 41 days.
Repeatedly acquired SAR data from a single sensor are used to obtain the Line-of-Sight (LOS) time series of ground deformation [Berardino et al., 2002, Ferretti et al., 2001, Usai, 2003, Hooper, 2008, Samsonov et al., 2011]. The final result of this classical technique, however, is limited to the time period of the particular data set and does not distinguish horizontal and vertical motion.
In order to overcome limitations facing classical DInSAR techniques we developed the Multidimensional Small Baseline Subset (MSBAS) technique [Samsonov and d’Oreye, 2012] that combines multiple DInSAR data into a single dataset with improved characteristics, lower noise and higher temporal
resolution. Assuming that individual ascending and descending data sets overlap in time, the MSBAS produces a single time series with uninterrupted temporal coverage. This methodology addresses data redundancy and multidimensionality problems by decomposing LOS DInSAR measurements into the vertical and horizontal (mainly east–west) time series of ground deformation using ascending and descending DInSAR data. The MSBAS technique was successfully applied to register coal-mining related subsidence in the Greater Luxembourg region [Samsonov et al., 2013a] and potash-mining related subsidence in Saskatchewan [Samsonov et al., 2013b]. The MSBAS time series analysis revealed, with remarkable accuracy, seasonal oscillations at summit of Vesuvius, 2005–2013 inflation of Campi Flegrei [Samsonov et al., 2014] and pre-eruptive deformation at Nyamulagira volcano [Smets et al., 2014].
8. DINSAR PROCESSING
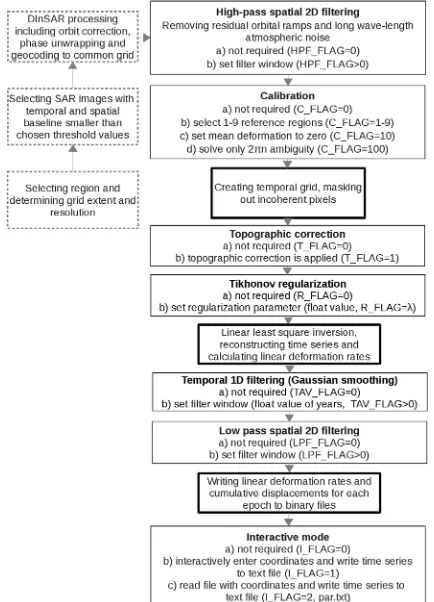
Detailed theoretical derivation of the MSBAS technique was described in Samsonov and d'Oreye [2012]. The steps constituting the MSBAS processing are presented in the flow chart diagram in Figure 5. The first three processing steps in the left column, outlined with dashed line, were performed outside of the MSBAS software. The three processing steps, outlined with a thick line, are mandatory and cannot be manipulated. The remaining processing steps, outlined with the thin boundary, can be manipulated by specifying appropriate processing flags (_FLAG).
In order to compute the two-dimensional time series of ground deformation at least two sets of DInSAR data, one from the ascending and one from the descending orbits, are required. Standard DInSAR processing was performed outside of the MSBAS software using GAMMA Remote Sensing package [Wegmüller and Werner, 1997] and consisted of the following steps: slave to master image coregistration and resampling; interferogram calculation and removal of the topographic phase reconstructed from the 1 m LiDAR DEM, adaptive filtering [Goldstein and Werner, 1998]; phase unwrapping [Costatini, 1998]; orbital error correction; and geocoding, then resampled to a common grid. Final interferograms were obtained in metric (cm) units, which were preserved during the MSBAS processing. Then, pre- and post-processing steps included: offset estimation or calibration (C_FLAG) for compensating temporal and spatial variations of atmospheric parameters, including pressure, humidity, temperature, and the total electron content in the ionosphere, as well as variation in the satellite location during acquisitions; topographic correction (T_FLAG) produces a joint inversion that solves for the residual topographic signal and 2D displacements and the interactive mode (I_FLAG) allows selecting and saving 2D time series of ground deformation for selected pixels to a text file. The Tikhonov regularization was controlled by R_FLAG, and applied with the regularization parameter equal to 0.25.
Figure 5. Flowchart diagram of MSBAS processing algorithm.
9. RESULTS AND CONCLUSIONS
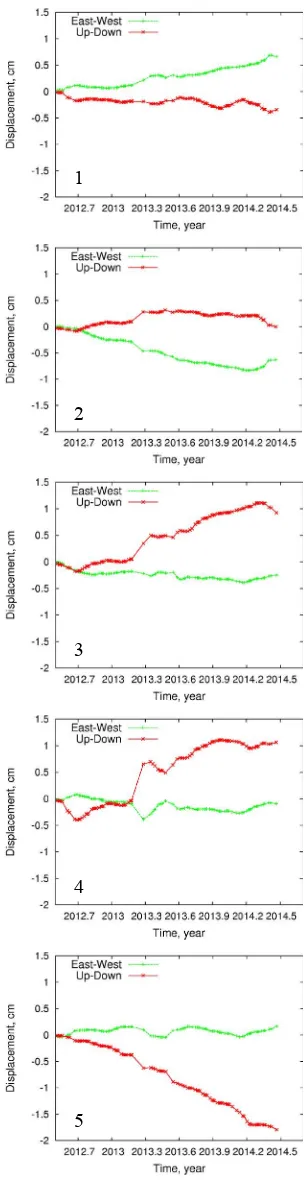
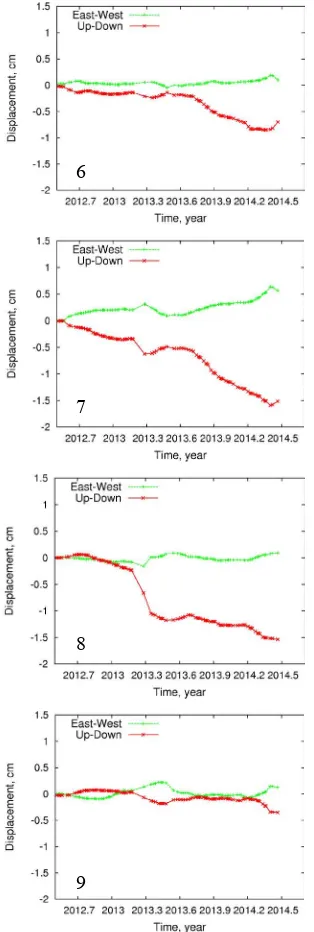
Deformation maps for Aquistore site were calculated from over four hundred RADARSART-2 interferograms using five different beams of RADARSAT -2 satellite. DInSAR-MSBAS results revealed ground deformation up to 1 cm/year for the two years, June 2012 – July 2014 - Figure 6. Horizontal motions were noticed along the Boundary – Rafferty diversion channel (time series 1 and 2) - Figure 7. Uplift was registered particularly around Souris river channel (time series 3 and 4). Subsiding motions were identified along the diversion channel (time series 5, 6) as well as in the mining area (time series 7, 8). Aquistore injection well site vicinity is stable, however, some seasonal changes are registered (time series 9). Surface motions registered by DInSAR-MSBAS technique are not related to CO2 injection but caused by different natural and anthropogenic processes, such as snow melting surface moisture fluctuations, ground and surface water level changes and post mining activities [Samsonov et al., 2013c].
Figure 6. (A) Horizontal MSBAS linear deformation rate map for June 2012 - July 2014, (B) Vertical MSBAS linear deformation rate map for June 2012 - July 2014. MSBAS reference point is marked by magenta dot and labeled REF, location of Aquistore injection well site and labeled SITE as well as corner reflectors are marked by yellow. DInSAR time series sites are numbered from 1 to 9 by magenta. The background is RADARSAT-2 Spotlight image.
A
B
1
2
3
4
5
Figure 7. Time series for selected sites located in Figure 5 and numbered from 1 to 9.
10. REFERENCES
Axelsson, P., 1999, Processing of laser scanner data - Algorithms and applications, ISPRS Journal of Photogrammetry & Remote Sensing, 54, 138 – 147.
Bachu, S., and Stewart, S., 2002, Geological sequestration of anthropogenic carbon dioxide in the Western Canadian Sedimentary Basin: suitability analysis, Canadian Journal of Petroleum Technology, 41 (2), 32-40.
Berardino, P., Fornaro, G., & Lanari, R., 2002, A new algorithm for surface deformation monitoring based on small baseline differential SAR interferograms, IEEE Transactions on Geoscience and Remote Sensing, 11, 2375– 2383.
Costantini, M., 1998, A novel phase unwrapping method based on network programming, IEEE Transactions on Geoscience and Remote Sensing, 36, pp. 813–821.
Craymer, M.,R., Henton, J.,A., Piraszewksi, M., Silliker, J., Lavergne, J.,C., Samsonov, S., 2013, Preliminary results continuous GPS monitoring of surface deformation at the Aquistore underground CO2 storage site, AGU Fall Meeting, San Francisco, December 9-13, G43A-0964. Ferretti, A., Prati, C., & Rocca, F., 2001, Permanent scatterers
in SAR interferometry, IEEE Transactions on Geoscience and Remote Sensing, 39, 8–20.
Goldstein, R. and Werner, C., 1998, Radar interferogram filtering for geophysical applications, Geophysical Research Letters, 25, pp. 4035–4038.
Hooper, A., 2008, Amulti-temporal InSAR method incorporating both persistent scatterer and small baseline approaches, Geophysical Research Letters, 35, 16302. Massonnet, D., and Feigl, K., 1998, Radar interferometry and
its application to changes in the Earth surface, Reviews of Geophysics, 36, pp. 441–500, .
Norford B.S. et al. Middle Ordovician to Lower Devonian Strata of the Western Canada Sedimentary Basin; in Geological Atlas of the Western Canada Sedimentary Basin, G.D. Mossop and I. Shetsen (comp.), Canadian Society of Petroleum Geologists and Alberta Research Council, (1994):URL<http://www.ags.gov.ab.ca/publications/wcsb_a tlas/atlas.html>, [access 2014-10-16]
Rosen, P., Hensley, P., Joughin, I., Li, F., Madsen, S., Rodriguez, E., and Goldstein, R., 2000, Synthetic aperture radar interferometry, Proceedings of the IEEE, 88, pp. 333– 382.
Samsonov, S., Koij van der, M., and Tiampo, K., 2011, A simultaneous inversion for deformation rates and topographic errors of DInSAR data utilizing linear least square inversion technique, Computers & Geosciences, 37, 1083-109.
Samsonov, S., and d’Oreye, N., Multidimensional time series analysis of ground deformation from multiple InSAR data sets applied to Virunga canic Province, 2012, Geophysical Journal International, 191, pp. 1095–1108.
Samsonov, S., d'Oreye, N., & Smets, B., 2013a, Ground deformation associated with post-mining activity at the French–German border revealed by novel InSAR time series method, International Journal of Applied Earth Observation and Geoinformation, 23, 142–154.
Samsonov, S., González, P. J., Tiampo, K., and d'Oreye, N., 2013b, Modeling of fast ground subsidence observed in southern Saskatchewan (Canada) during 2008–2011, Natural Hazards and Earth System Sciences Discussions, 1, 5881–5910.
Samsonov, S., V., White, D., Craymer, M. R., 2013c, Time series of ground deformation for the Aquistore CO2 Storage site located in SE Saskatchewan (Canada) and computed from five beams of RADARSAT-2 data combined using the MSBAS methodology, Proceedings of Multi-Temp 2013: 7th International Workshop on the Analysis of Multi-temporal Remote Sensing Images, Banff, AB, Canada, June 25-27.
Samsonov, S., González, P. J., Tiampo, K., Camacho, A., & Fernández, J. 2014, Spatiotemporal analysis of ground deformation at Campi Flegrei and Mt Vesuvius, Italy, observed by Envisat and Radarsat-2 InSAR during 2003– 2013, Mathematics of planet Earth (Lecture Notes in Earth System Sciences), Springer, 377–382.
Smets, B., d'Oreye, N., Kervyn, F., Kervyn, M., Albino, F., Arellano, S., et al. 2014, Detailed multidisciplinary monitoring reveals pre- and co-eruptive signals at Nyamulagira cano (North Kivu, Democratic Republic of Congo), Bulletin of Volcanology, 76, 1–35.
6
7
8
9
Usai,S., 2003, A least squares database approach for SAR interferometric data, IEEE Transactions on Geoscience and Remote Sensing, 4, 753–760.
Vasco, D. W., A. Rucci, A. Ferretti, F. Novali, R. C.Bissell, P. S. Ringrose, A. S. Mathieson, and I. W. Wright., 2010, Satellite-based measurements of surface deformation reveal fluid flow associated with the geological storage of carbon dioxide, Geophys. Res. Lett., 37, L03303.
Wegmüller, U., and Werner, C., 1997, Gamma SAR processor and interferometry software, in: The 3rd ERS Symposium on Space at the Service of our Environment, Florence, Italy, pp. 1687–1692.
11. ACKNOWLEDGEMENTS
We thank the Canadian Space Agency for providing RADARSAT-2 data. Images were plotted with ESRI, GMT and GNUPLOT.