IMAGE-BASED 3D MODELING FOR THE KNOWLEDGE AND THE
REPRESENTATION OF ARCHAEOLOGICAL DIG AND POTTERY: SANT’OMOBONO
AND SARNO PROJECT’S STRATEGIES
S. Gianolio a-b – F. Mermati c – G. Genovese c
a ARESlab, University of Rome “La Sapienza”, Italy ([email protected]) b ArcheoDigital Srls, Rome, Italy ([email protected])
c ARESlab, University of Rome "La Sapienza", Italy ([email protected])
Commission V, WG V/2
KEY WORDS: Photogrammetry, Laser Scanning, image-based 3D modeling, 3D cataloguing, Cultural Heritage
ABSTRACT:
This paper presents a “standard” method that is being developed by ARESlab of Rome’s La Sapienza University for the documentation and the representation of the archaeological artifacts and structures through automatic photogrammetry software. The image-based 3D modeling technique was applied in two projects: in Sarno and in Rome. The first is a small city in Campania region along Via Popilia, known as the ancient way from Capua to Rhegion. The interest in this city is based on the recovery of over 2100 tombs from local necropolis that contained more than 100.000 artifacts collected in “Museo Nazionale Archeologico della Valle del Sarno”. In Rome the project regards the archaeological area of Insula Volusiana placed in Forum Boarium close to Sant’Omobono sacred area. During the studies photographs were taken by Canon EOS 5D Mark II and Canon EOS 600D cameras. 3D model and meshes were created in Photoscan software. The TOF-CW Z+F IMAGER® 5006h laser scanner is used to dense data collection of archaeological area of Rome and to make a metric comparison between range-based and image-based techniques. In these projects the IBM as a low-cost technique proved to be a high accuracy improvement if planned correctly and it shown also how it helps to obtain a relief of complex strata and architectures compared to traditional manual documentation methods (e.g. two-dimensional drawings). The multi-dimensional recording can be used for future studies of the archaeological heritage, especially for the “destructive” character of an excavation. The presented methodology is suitable for the 3D registration and the accuracy of the methodology improved also the scientific value.
1. INTRODUCTION: OBJECT OF STUDY
In the past few years the use of Image-Based Three Dimensional (3D) Modeling (IBM) has greatly increased in different areas. Many important applications of this technique are in the Culture Heritage documentation (Remondino and El-Hakim, 2006; Pavlidis et al., 2007; De Reu et al., 2013). This paper describes a method to catalogue in 3D the pottery from Sarno’s project and how this methodology is suitable for the documentation, conservation and presentation of heritage information. We present also some discoveries made during the excavations at Sant’Omobono - Insula Volusiana complex in Rome.
These projects were carried out by ARESlab of University “La Sapienza” of Rome, in agreement with Soprintendenza per i Beni Archeologici di Salerno, Avellino, Caserta e Benevento for Sarno and in concession by Ministero per i Beni e le Attività Culturali e il Turismo (and Sovrintendenza ai Beni Archeologici del Comune di Roma) for Rome.
The aim of the Sarno’s project is to study over 2100 tombs in the local necropolis dating back to IX to VI cen. BC. In these tombs were discovered more than 100.000 pieces like pottery, faience, amber and metal objects. In Rome, the archaeological dig has revealed a district of ancient city between the Janus Quadrifrons Arch and the sacred area of Sant’Omobono, on the left bank of Tiber. The first part of the excavation in 2013 has caused the appearance of a forge datable to V-VI cen AD. The archaeological area is inside the modern building of “XII Dipartimento Lavori Pubblici del Comune di Roma” that surround it.
Few data about these areas are present in literature. More than 10 years of researches were scheduled by ARESlab to complete the study and the documentation of Sarno’s tombs. In Rome the goal
will be to reach the archaic-early republican level in archaeological dig.
2. METHODOLOGY
All the images have been acquired with a Canon EOS 5D Mark II and a Canon EOS 600D; two lenses have been used, as shown in the table 1.
Camera / Lens Specification
Canon EOS 5D Mark II 21MP, CMOS sensor size of 36 x 24 mm (Full Frame) Canon EOS 650D 18MP, CMOS sensor size of
22,3 x 14,9 mm (APS-C) Canon EF 17-40mm f/4L Focal lenght: 50mm (on
600D)
Canon EF 24-70mm f/2.8L Focal lenght: 50mm Table 1 Specifications of cameras and lenses
The focal length is selected to avoid the geometric distortion of the lenses. The purchase of fixed lens instead of zooms is scheduled, but in this case, the great quality of construction do not move the focal length’s ring. The equipment also included four LED lights and two tripods. The photos were taken in RAW+JPEG format to achieve a better sharpening, lossless compression and to enhance the radiometry in post-production. The images were developed and treated with color-managed workflow and exported in TIFF format at 8bit with Adobe Lightroom. At the end of the shoot session, before removal of the subject, JPEG image was used to control matching and sparse cloud generation in image-based modeling software.
between Photoscan and laser scanner in S. Omobono project. The comparison was performed with Z+F 5006h and Autodesk ReCap Pro was applied to align points clouds. The 3D surveying, which followed the classical surveying with total station (a SOKKIA Set 650RX), was performed in 2013 during the first season of dig.
3. SARNO VALLEY PROJECT
ARESlab’s ideas for a 3D database of Sarno pottery and archaeological artifacts grew out of his work on a project they began in 2014 at “Museo Archeologico Nazionale della Valle del Sarno” in Palazzo Capua in Sarno.
Fig. 1 Typical workflow for image-based 3D modelling.
Inside the museum the objects were stored on mobile brackets of different size suitable for the shooting of the lower part of the vessels. To date all objects, a standard workflow and
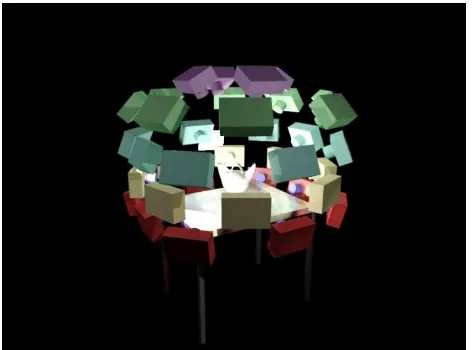
technological pipeline have been used in this project (fig. 1). In the fig 2 is presented the typical setup that consists in a series of ellipsis around the object. For each subject we obtained in total 36 images due to the camera movement from bottom to top. The camera’s distance from subject was about 70 cm, the focal length was 50mm and an aperture of f/11 gives a Depth of Field (DoF) of 12 cm.
Fig. 2 Designed camera positions with lights.
The Ground Sampling Distance (GSD) for digital cameras is calculated with the following formula:
GSD = d / f x CMOS pixel size
Where: d = distance from subject f = focal length
The sensor size is defined in pixels: 5616 x 3744 for the 5D Mark II, 5184 x 3456 for 600D. Due to the different sensors in the cameras (Full Frame for the first and APS-C for the last), the pixel size changes from 6.4 micron to 4.3 micron. A Circle of Confusion (CoC) of 0.03 mm is common accepted for 35 mm camera; 0.019 mm CoC’s for “crop sensor” is a reasonable value. Using the formula written above the values of GSD are:
5D Mark II = 0.09 mm 600D = 0.06 mm
Fig. 3 Focus vs Distance chart for 5D Mark II camera.
distance (blue line) and the point at which Rayleight diffraction limits resolution (green line), alias Airy Disk Diameter, calculated in 0.014 mm. The red line represents the value of CoC. To have a perfectly focused image, focus distance and subject distance should be the same, in this condition no blurring is present. The Depth of Focus is 0.0355 cm.
Fig. 4 Depth of Field parameters for 5D Mark II.
Fig. 5 Focus vs Distance chart for 600D.
The chart in fig. 5 shows a DoF of 7.63 cm for crop sensor of 600D. In this case the Depth of Focus is 0.0225 cm.
With these results in hands we decided to use Full Frame for the project.
Fig. 6 Depth of Field parameters for 600D.
Data capture and post-processing
The project was started after the capture design: each object required 2 hours so the maximum data recorded in 3D, during 1 day, were approximately 5. This part of the project was performed by Dr. Simone Gianolio and Dr. Maria Grazia Giuliano. The RAW processing enhanced the radiometry of photos as mentioned before.
10 minutes is needed for the alignment in Photoscan on Intel Core i7 920 @ 3,4Ghz and a nVidia Quadro 2000, half hour for cloud generation, meshing and texturing.
Fig. 7 Raw development example: top image open in Lightroom, bottom image exported by Lightroom.
Due to the reflection of the pottery exposed in the Museum, the best choice was the use of a polarized light to obtain a texture without spots light. An example of this technique is present in fig. 8.
Applying this schema capture and correct workflow treatment for photos, a good pottery model was obtained with Agisoft Photoscan as IBM software. The use of “aggressive” as depth filtering value is highly recommended in the case of an object with numerous small details. The aim of this project is the application of IBM for digital visualization and virtual reconstruction, for this reason, no metric comparison with range-based technique was performed up to now.
In another case, the use of Photoshop Auto-Blend Layers command was choosen i) to enhance the Depth of Field and ii) to increase the results in Photoscan. The Askos from T596 is 22 cm length from lip to tail, where the DoF is 12 cm: one of the lip and the tail is blurred in some photos. From the same point of shoot, we captured two images with different level of focus: post-processed in Lightroom and imported in Photoshop.
saved TIFF has a no blurred areas: the image size is the same of the original photo for every blended images.
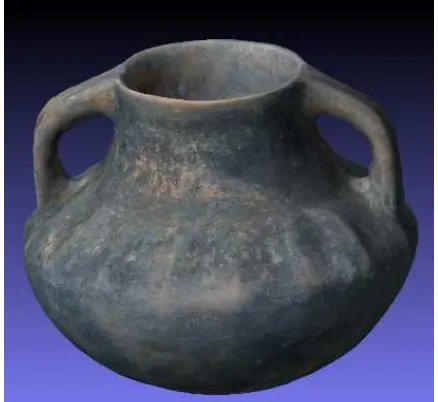
Fig. 8 An example of shoot with polarized light of a little amphora from Tomb 596.
Fig. 9 The schema applied to same small amphora from T596.
Fig. 10 Model exported from Photoscan in OBJ with texture and imported in Meshlab for visualization and X3D production.
Fig. 11 Top image show the small DoF for this askos. Bottom image show the Auto-Blend area.
Figura 13 The Askos from T596 inside Meshlab.
The fig. 13 shown the results after elaborations (figg. 11-12). Meshlab software was used to export the 3D model in X3D format for web-based visualization.
4. INSULA’S VOLUSIANA PROJECT
Insula Volusiana is an archaeological area at south of the temples of Fortuna and Mater Matuta on the Forum Boarium. The dig started in the autumn of 2013 for a total of 6 weeks within 3 areas have been investigated. The total dimension of Insula Volusiana area is around 700 m2. The archaeological remains is constituted by complex architectures distribution of the two buildings separated by a street (width around 3 m).
We began the work with a photographic documentation and the general 3D model of the site was obtained with IBM technique. An archaeological map of the site was realized with a traditional total station approach using standard CAD procedures: the employed total station is a Sokkia SET 650RX, and 8 station points were chosen to acquire more than 800 points. The documentation was then integrated performing a complete acquisition (fig. 14) with TOF-CW Z+F IMAGER® 5006h laser scanner (which guarantees a very high sampling step, fast scanning operations and good geometric accuracy: San José Alonso et al., 2011). This range-based technique gave the possibility to collect over 500 million points with 55 station points necessary to avoid the occlusions. The nominal resolution for the nearest station is “high” at “normal quality” while for the most distant scanner position was chosen a “super high” resolution at “high quality”.
Technique Instrument Data
TLS Z+F Imager® 5600h 55 scans 500 mil. points
Photogram. Canon EOS 5D Mark II
257 images 45 “oblique” 212 “terrestrial”
Total station Sokkia SET650RX 8 stations over 800 points Table 2 Terrestrial surveying of the archaeological area of S.
Omobono – Insula Volusiana.
The camera and the lens used in the project are the same mentioned in the previous paragraph: Canon EOS 5D Mark II, f/11, ISO 100; Canon EF 17-40mm @ 24mm.
Data capture
The photogrammetric process was divided into two steps. A “relief journal” (De Luca 2011) was compiled for every step and group of architectures.
Fig. 14 Range data acquisition and elaboration in ReCap Pro.
In the first step (summer 2013), 45 photos were shooted from the second floor of the modern building with a calculated distance between 13-20 m. Using the medium (16.5 m) for the GSD, 4.5 cm was obtained. This value can not be considered suitable for a good accuracy. The angle of the inclination of the camera had an angle of about 60°. The metric validation of orientation was calculated with the De Luca’s rule: if we assume an intrinsic error of 5 pixel, the scaling of this error according to measured distance is:
For example, the fig. 15 shows one shot for the area A in which we measured a 871 pixel for the sill that in reality was 251 cm.
The margin error is: 5 x 251 / 871 = 1.44 cm
Fig. 15 A particular of image from S. Omobono: pixel distance and measured distance from the center of original photo.
Fig. 16 Derived camera poses (257 images) in Photoscan and 3D model for the Insula Volusiana.
To have a faster 3D documentation process in the second step we focused our attention on the relevant strata: a Medieval collapse of walls (UUSS 204-205), the forge plan (US206) and the final plan of the dig.
To extract absolute metrical information from the model, reference distances were recorded with total station so the model can be scaled in an absolute way and accurate measurements could be achieved.
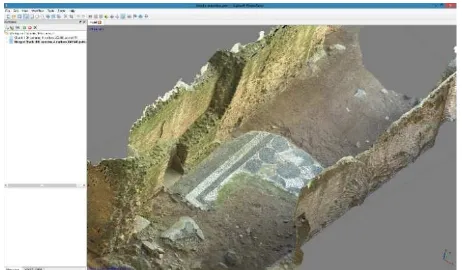
Fig. 17 Archaeological dig in Sant'Omobono: ortophotos of entire site from fig. 15, blended with post-dig ortos from
excavated area.
Fig. 18 A Medieval collapse of walls, a 12 mq area, documented with Photoscan for digital preservation and digital relief.
Fig. 19 A geometric detail of a image-based 3D model of late antique strata, visualized as colour mode.
Fig. 20 Image-based 3D model of mosaic floor and wall in area called C3, visualized as colour mode.
Fig. 21 A geometric detail of a image-based 3D model wall, shaded in Meshlab.
Data analysis
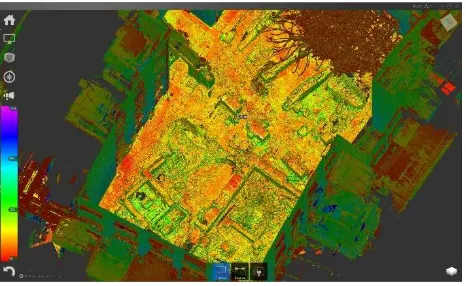
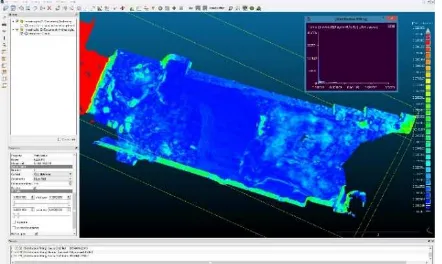
Fig. 22 Cloud to Cloud distance evaluation between dense cloud of Photoscan and point cloud of laser scanner about mosaic floor at Insula Volusiana: “fixed scale” function is disabled.
The minimum distance set at 0.000019 cm is represented with blue color while the maximum set at 0.10 cm with red (this area doesn’t exist in point cloud). The “approximate mean distance” calculated by software was 0.05 cm, the “approximate minimal distance” 0.0038 cm, the sigma value was 0.167 cm. Main area for archaeological documentation was mosaic colored in blue. In a second comparison, using the “fixed scale” function in the alignment process is not possible to realize good results as the previous ones (fig. 23).
The approximate mean distance calculated by software was 0.052 cm, the approximate minimal distance 0.0037 cm, the sigma 0.162 cm: in this case the mosaic’s area is colored with a gradient from blue to light blue in which the distance is more than 0.02 cm.
Fig. 23 Cloud to Cloud distance evaluation between dense cloud of Photoscan and point cloud of laser scanner about mosaic floor at Insula Volusiana: “fixed scale” function is enabled.
Fig. 24 Cloud to Cloud distance evaluation between dense cloud of Photoscan and point cloud of laser scanner about architecture
at Insula Volusiana: “fixed scale” function is disabled.
The second case is an architectural prospect in area A (fig. 24). Same parameters are used: approximate mean distance 0.029 cm, approximate minimal distance 0.0037 cm, sigma 0.07 cm. This result is not completely reliable because some areas of dense cloud and point cloud do not overlap due to the different technique used in various moments of the dig. The theoretical error given by intrinsic error pixel of camera is a good and conservative value to determine the final accuracy of model. The figures 22-24 above show a value less than 0.01 cm, this error is acceptable for archaeological documentation.
The CAD relief obtained is plotted at scale 1:20 / 1:50 in which the tolerance value (0.004 / 0.01 cm) can be calculated with the following formula
E = s x n
Where: E = uncertainty of measured distance in cm s = thickness of the line drawn (typical 0.2 mm) n = map scale
It is possible to plot the photos at 300 dpi because 1 pixel = 0.0084 cm:
1 pixel = 1 / (300 / 2.54)
Where: 1 = measured distance of 1 cm 300 = dot per inch
2.54 = cm or 1 inch
This resolution is ideal for map scale of 1:50; for a scale of 1:20 the resolution should be increased to 635 dot per inch, where 1 pixel = 0.004 cm. Inside Photoscan the default value for pixel size in Export Orthophoto corresponds to ground sampling resolution to achieve highest resolution. For the model shown in fig. 15 the value is set to 0.0017.
5. CONCLUSION
In this paper we have described how the use of image-based technique for 3D surveying and the fast documentation of archaeological area and pottery allow the generation of very realistic 3D results and 3D models for studies, analyses and digital representation. The aim of this article is to show that the IBM technique is very impressive about speediness and accuracy if planned correctly (Rizzi et al. 2011). The main results are i) accurate 3D model for informative and educational purposes, ii) 3D surveying and IBM techniques comparison in terms of final accuracy, iii) metric and accurate results for archaeological purposes (plans, orthoimages, innovative techniques of visualization).
Using the mentioned photogrammetric method we recorded complex strata in Sant’Omobono, the same structures to be manually surveyed would have required very long processing time. 3D data, in Sarno, allow the acquisition of photographic textured pottery models that can be considered very important for the preservation, the exhibition and the virtual reconstruction. The generation of the same models with computer vision 3D modeling is time consuming and it is not so accurate, especially for texturing.
REFERENCES
De Luca L., 2011: La fotomodellazione architettonica. Rilievo, modellazione, rappresentazione di edifici a partire da fotografie, Palermo 2011.
De Reu J., Plets G., Verhoeven G., De Smedt P., Bats M., Cherretté B., De Maeyer W., Deconynck J., Herremans D., Laloo P., Van Meirvenne M., De Clercq W., 2013: “Towards a three-dimensional cost-effective registration of the archaeological heritage”, Journal of Archaeological Science, Vol. 40, 1108-1121.
Fiorillo F., Jiménez B., Remondino F., Barba S., 2013: “3d Surveying and modelling of the Archaeological Area of Paestum, Italy”, VAR, Vol. 4 (8), 55-60.
Remondino F., Menna F., 2008: “Image-Based surface measurement for close-range heritage documentation”, Int. Archives of the Photogrammetry, Remote Sensing and Spatial Information Sciences, Vol. 37 (B5), Beijing, 199-206.
Rizzi A., Baratti G., Jiménez B., Girardi S., Remondino F., 2011: “3D recording for 2D delivering - The employement of 3D models for studies and analyses”, Int. Archives of the Photogrammetry, Remote Sensing and Spatial Information Sciences, Vol. 38 (5/W16), Trento (Italy).
San José Alonso J.I., Martinez Rubio J., Fernàndez Martin J.J., Garcia Fernàndez J., 2011: “Comparing time-of-flight and phase-shift. The survey of the royal pantheon in the basilica of San Isidoro (León)”, Int. Archives of Photogrammetry and Remote Sensing and Spatial Information Sciences, Vol. 38 (5/W16), Trento (Italy).
Verhoeven G., 2011: “Taking computer vision aloft e archaeological three dimensional reconstructions from aerial photographs with Photoscan”, Archaeological Prospection 18 (1), 67-73.
Vianna Baptista M. L., 2013: “Documenting a complex modern Heritage building using multi image close range photogrammetry and 3D scanned point clouds”, Int. Archives of the Photogrammetry, Remote Sensing and Spatial Information Sciences, Vol. 40 (5), Strasbourg, 675-678.