AUTOMATED RECONSTRUCTION OF HISTORIC ROOF STRUCTURES FROM POINT CLOUDS – DEVELOPMENT AND EXAMPLES
M. Pöchtrager a,b , G. Styhler-Aydın a, M. Döring-Williams a, N. Pfeifer b a Institute of History of Art, Building Archaeology and Restoration, TU Wien, Austria -
(markus.poechtrager, gudrun.styhler, marina.doering-williams)@tuwien.ac.at
b Department of Geodesy and Geoinformation, TU Wien, Austria – [email protected]
Commission II
KEY WORDS: historical timber structures, LiDAR, point clouds, digital reconstruction
ABSTRACT:
The analysis of historic roof constructions is an important task for planning the adaptive reuse of buildings or for maintenance and restoration issues. Current approaches to modeling roof constructions consist of several consecutive operations that need to be done manually or using semi-automatic routines. To increase efficiency and allow the focus to be on analysis rather than on data processing, a set of methods was developed for the fully automated analysis of the roof constructions, including integration of architectural and structural modeling. Terrestrial laser scanning permits high-detail surveying of large-scale structures within a short time. Whereas 3-D laser scan data consist of millions of single points on the object surface, we need a geometric description of structural elements in order to obtain a structural model consisting of beam axis and connections. Preliminary results showed that the developed methods work well for beams in flawless condition with a quadratic cross section and no bending. Deformations or damages such as cracks and cuts on the wooden beams can lead to incomplete representations in the model. Overall, a high degree of automation was achieved.
1. INTRODUCTION
The deformation-accurate survey and detailed documentation of historic timber structures still represents a challenge for building surveys and involves labour-intensive procedures. At the same time, the analysis of historic roof structures is always an important task in the field of e.g. adaptive re-use planning for idle attic lofts, development of sustainable preservation strategies for monument protection or the calculation and verification of efficient and resource-friendly structural consolidation. Although from a structural point of view, historic wooden roof structures are predominantly regular constructions with a high number of repetitive linear elements, they are complex in terms of their specific spatial geometry and their traditionally manufactured joints.
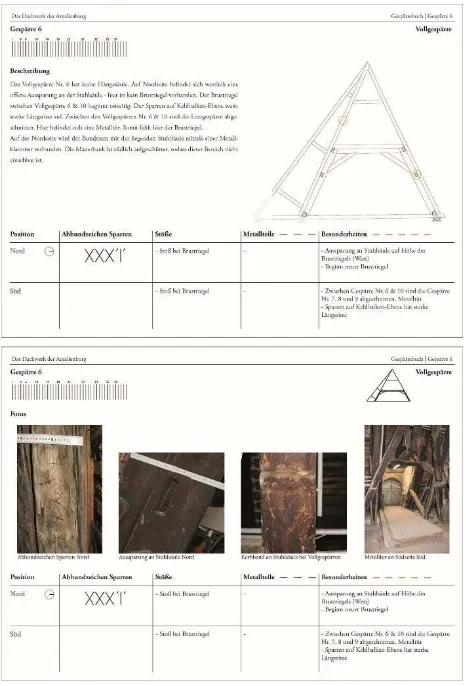
Current survey practice usually involves a combination of high-tech and traditional documentation high-techniques such as tachymetry, 3-D laser scanning and hand-measurement. The resulting documentation consists of detailed 2-D and 3-D drawings such as a deformation-accurate set of plans of the construction showing its current status, digital models of the structure, detailed information about the joints, reconstruction of the process of assembly, mappings of e.g. construction phases, carpenters’ marks, and the position of dendrochronological samples. In addition, the catalogue of rafters contains a compilation of detailed information on all assemblies and sub-assemblies including joints, in the form of a systematic description of all geometrical and mechanical features of the roof structure (see Fig. 1).
Recent interdisciplinary research activities extended the above-mentioned methodology for the documentation and analysis of historic wooden roof structures into the field of structural assessment using modern engineering software (Hochreiner et al., 2016). Thus, numerical structural models are produced on the basis of architectural survey data. The process requires information beyond the scope of architectural documentation, such as the allocation of crack formations due to shrinkage, degradation due to moisture, displacement of joints, etc. (Eßer et al., 2016a; Eßer et al., 2016b).
The current modeling approach for roof constructions comprises several consecutive tasks. To begin with, the terrestrial laser scanner data from multiple scan positions needs to be orientated. An accurate registration and orientation of scans from different scan positions can be achieved by the use of well-known target points that are visible in multiple scans. Several scan positions may be required to capture all details for angled constructions due to the resulting scan shadow. In a next step, 2-D slices of the scans are selected manually, according to the roof structure. After that, dimensional modeling is carried out on the 2-D slices for each pair of rafters. However, this method is very labour intensive.
Laser scanning technology allows fast, accurate, and automatic measurement of millions of points. It operates by emitting a signal in the visible or infrared part of the spectrum. This signal is strongly collimated and its 2-way run-time from sensor to object and back again is used to infer the distance between laser scanner and object in the direction of the beam. The beam is scanned across the field of view while measurements are performed at a rate of hundreds of kHz (e.g. 500,000 measurements per second). The result is a point cloud in the scanner coordinate system. Multiple scans can be transformed into a superior coordinate system using tie-points or the object surfaces (Glira et al., 2015). This results in a 3-D point cloud, which covers the objects visible from the laser scanner positions with a dense set of points. In the case of historic roof structures, distances between neighboring points can typically be in the order of a few millimeters. However, beams and their axes and joints are objects which are only implicitly contained in the raw 3-D point cloud.
Figure 1: Section of the catalogue of rafters of the north-east wing of the Amalienburg (© A. Domej, N. Hamader, B. Kapsammer, all TU Wien, 2015).
2. PROBLEM STATEMENT AND RELATED WORK The various applications for the architectural and structural analysis of existing roof structures define requirements in terms of the nature and quality of the digital roof structure reconstruction. For architectural documentation we expect a survey accuracy of 1 cm, which reflects a scale of 1:50 in the deformation-accurate plan record.
In order to plan the adaptive re-use of a roof, it is necessary to model the forces acting on the beams. Thus, a model composed of beam axes and joints has to be derived. Together with the beam dimensions, the nature of the joints, and parameters of the beam material, the forces present in the roof structure can be determined. This is the basis for planning adaptation to the structure.
Both architectural documentation and axes extraction require a very high degree of completeness. Thus, a practical tool will need to integrate manual additions and corrections, in order to guarantee the completeness of the final model. Incomplete modeling can have various causes, such as scan shadow, for example. In addition, the separation of relevant (e.g. beam) and irrelevant (e.g. floor) objects needs to be considered, but strongly depends on the specific task.
Thus, our aim was to develop a set of methods and corresponding tools that automatically processes point clouds derived from laser scanning. The requirements can be formulated for the measurement and for the object. It is assumed that the point clouds are dense (e.g. distance of neighboring points below 5 millimeters). Typical laser scanning accuracy of, e.g., 2 mm, is assumed for the standard deviation of each point (coordinate
direction). It is further assumed that each beam is represented at least by two adjacent faces in the point cloud. The visible parts of those faces in the point cloud must share a common edge. Furthermore, the beams are assumed to have a rectangular cross section. And finally, it is assumed that they are straight, i.e. not bent. Slight bending of beams is counteracted by using threshold values.
Automatic surface reconstruction using unorganized point sets (Hoppe et al., 1992, Attene et al., 2000, Kazhdan et al., 2006), is a related problem. The aim is to find an interpolating (or approximating) surface through all points, e.g. in the form of a TIN (Triangular Irregular Network). Some of the approaches provide an oriented 2-D manifold, i.e. a surface for which “inside” and “outside” can be defined. An application in the cultural heritage context, using a combination of tacheometric surveying, laser scanning, and images for obtaining the 3-D point cloud, with the additional use of bump maps for representing local detail, is described in Dorninger et al. (2013). In comparison, our aim is the reconstruction of individual objects, i.e. beams. Additionally, overall information on the shape of the objects is available, e.g., the rectangular cross section or the minimum and maximum length of such a beam. Symmetry of the objects can help to complete the model, even if no points were determined in some regions.
Classification of point clouds for architectural analysis was, e.g., studied by Zhang and Zakhor (2014) for classifying window areas. While planarity is important for reconstructing beams, their elongated shape and connectedness between beams suggests to consider previous work on piping installations. The automatic reconstruction of piping installations from point clouds has been performed by several authors (Rabbani et al., 2007; Lee et al., 2013). In a first step, the point cloud is split into groups using segmentation, clustering, and/or skeletonization. Then, using voting schemes such RANSAC or the Hough transform, cylinder parameters are estimated, which can be refined using, e.g., least-squares parameter estimation. A cylinder has 5 parameters (4 axis parameters and the radius), but is not confined along its axis. Unless top and bottom surface are also covered by points, the first and last points along the axis, respectively, are used to confine the cylinder. In comparison, a beam with rectangular cross section has 7 parameters. The problem of the top and bottom surface is the same, but all four sides, pairwise parallel, have to be covered by points in order to reconstruct the cross section. For cylinders, a small surface patch is, in theory, enough to determine its 5 parameters. If the curvature is determined in one point, the direction for the principal curvature with a value of 0 is the direction of generators, while the other principal curvature is the inverse of the radius.
Tree reconstruction involves elongated, but not straight, objects (Thies et al., 2004, Raumonen et al., 2013, Wang et al., 2016a). These approaches often use the idea of following the form by advancing and adapting a base model to the given point cloud. For modeling the irregular cross section, splines or harmonic basis functions can be used to adapt to the deviation from an ideal cross section shape (Pfeifer el al., 2004, Wang et al., 2016b). Currently, our approach assumes a higher regularity, but these models may become important if the deviations from the ideal beam form need to be modeled. Historic roof structures typically do not exhibit an ideal beam form. Deviations can occur in the form of a more complex cross section because of the chamfer or an irregular cross section due to timber irregularity, or because of bending in the longitudinal direction. Additionally, cracks occur in timber constructions, and these may require more than a geometrical model.
industrial context, the shapes are more precisely planar. In addition, occlusions are more abundant in historic roof structures than in Chida et al.’s examples. Furthermore, end sides are normally not visible in roof constructions, as they occur in the beam joints. Jung et al. (2014) use a similar approach, but suggest to concentrate on a semi-automatic method, in which outlines of planar faces are determined automatically, and are used for subsequent manual modeling for the as-built BIM (Building Information Modeling). Volk et al. (2014) discusses as-built BIM and Murphy et al. (2013) especially historic BIM (HBIM). Baik et al. (2015) demonstrate the reconstruction of complex facades using point clouds in a BIM (Autodesk Revit). An overview of “automatic geometry generation from point clouds for BIM” in the context of room walls, windows, and floor are given by Thomson et al. 2015. Specific methods are suggested by (Xiong et al., 2013).
3. METHOD 3.1 Overview
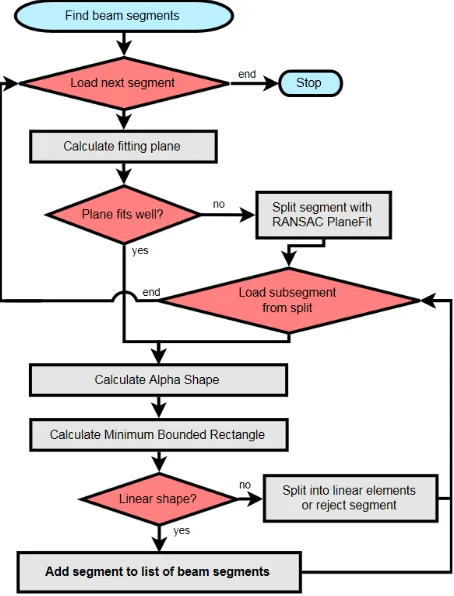
The proposed processing chain (see Fig. 2) for an automated reconstruction of the roof structure requires a registered point cloud as input data. The first step in the processing is to import the point cloud using the module-based software OPALS (Pfeifer et al., 2014). The module opalsImport converts the point cloud into an efficient data format for a fast read and write access to point attribute information. As a next step, normal vectors are computed for each point. Based on the normal vectors provided by opalsNormals, the module opalsSegmentation can then be used to split the point cloud into segments of neighboring points that fulfill a local homogeneity criterion. A proper selection of the homogeneity criterion (including normal vector information) permits detection of the faces of wooden elements or walls as single segments from laser scans. The segments in the point cloud are the main input for the following project-specific processing steps of finding adjacent segments forming one beam and fitting cuboids to the entire point set describing a beam. For the automatic detection of wooden beams, the segments first need to be categorized into straight beam segments and segments of other elements. It is important to detect as many beam segments as possible and remove all segments of objects that have no relevance for the architectural and structural analysis.
In the next step, these classified beam segments need to be connected into adjacent elements that form a beam. For all the points that belong to the same beam, a cuboid can be determined if at least two sides of the beam are covered with segments. This cuboid is the basis for the representation of the beam in the 3-D architectural model. As a final step the cuboids need to be extended and intersected to get the joints in the woodwork as observed in the architectural analysis.
The following sections describe the main processing steps in more detail.
3.2 Segmentation
In the workflow the normal vector information of each point is the main input parameter for the segmentation. To get the normal vector estimation at a specific point, its neighbor points need to be considered. The selection of the neighbor points has a major influence on the result. To get precise results – especially on the edges of beams – a robust plane fit algorithm for the point and its neighbor points is used. The normal vector of the fitting plane gets assigned to the point. The nearest neighbor search is based on the full 3-D coordinates of the points.
In the segmentation step two neighboring points belong to the same segment if the angle between the normal vectors is below some threshold ���� and the distance between the points is within a maximum search radius ����. The formula for the local homogeneity in the segments can therefore be written as:
cos−1�������⃑ ⋅ ������⃑�<���� (1)
��
����⃑ and ������⃑ are the unit normal vectors of a segment point and a neighboring candidate point.
3.3 Identification of beam segments
An automated classification of beam segments was developed (see Fig. 3) to recognize the sides of the beams.
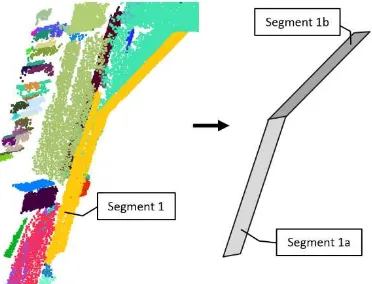
3.3.1 Detection of planar segments: To begin with, a least-squares fitting plane is calculated for all points in a segment using principal component analysis. It provides the three eigenvalues of the plane and the fitting root mean square error (RMSE). If the plane fits well according to the RMSE, which implies that the points of the segment are more or less coplanar, the segment can be considered as a flat surface. If no plane model fits all segment points, the segment needs to be split up into planar (sub-) segments. This is achieved by adapting the RANSAC algorithm for plane fitting. This algorithm iteratively detects the largest planar sub-segment of the original segment until no more planar segments can be detected (see Fig. 4).
3.3.2 Detection of the shape: The next step is to derive information about the shape of planar segments. To get the 2-D shape and boundary representation for the points in planar segments, α-shapes were calculated. α-shape computation is closely related to the computation of the convex hull and Delaunay triangulation but in contrast to the convex hull, the polygon does not need to be convex. Additionally the selection of the alpha value allows the specification of a degree of generalization for the shape.
In addition to the α-shape, the minimum bounding rotated rectangle (MBR) is calculated (see Fig. 5). The MBR is a rectangle that contains all points of a segment with a minimum area. α-shapes and MBRs provide essential information about straightness of segments and thus constitute major input for the classification of segments.
3.3.3 Classification of the shape: A wide variety of different shape indices or shape factors were investigated for the classification of segments. The workflow we developed in fact only uses two decisive factors, namely:
1. Elongation factor
������= ����
� (2)
where �� and �� are the largest and second largest eigenvalues of the plane fit describing length and width of a segment.
2. Ratio between the area of α-shape and MBR
�����= ������ (3)
With a combination of these two factors the planar segments can be classified into the following three classes:
1. Linear-shaped (straight) segment 2. Non-linear compact segment
3. Non-linear segment with separable sub-segments
While non-linear compact segments are rejected, the linear-shaped segments are added to the list of beam segments if the beam width is within a given range ���� - ���� (e.g. 15-25 cm). The segments of the third class can be split up into sub-segments of straight beam segments. Fig. 6 shows the straight sub-segments of a non-linear planar segment, where the axes of the single beams are represented by dashed lines.
3.4 Identification of adjacent beam segments
Based on the list of segments classified as beam faces, the next task is to detect and join adjacent segments that form together a wooden beam. Segments are considered to belong to the same beam if they meet the following three conditions:
1. Distance between the centroid of segment A and the plane of segment B:
|�� − ��| < ������� (4)
2. Angle between the normal vectors:
cos−1(��⃑�⋅ ��⃑�) =�0,�
2,�, 3�
2� (5)
3. Axes in longitudinal direction are parallel:
�⃑� ∥ �⃑� (6)
�⃑� and �⃑� are the eigenvectors of the largest eigenvalues of the segments A and B.
Figure 5: two-dimensional visualization of a beam segment; red: α-shape, black: minimum bounding rectangle
Figure 4: Split segments into planar elements
The threshold of ������� in (4) was chosen to specify the maximum thickness of beams. Equations (5) and (6) allow small deviations from their strict formulation by considering angular thresholds.
If all these conditions are met it is guaranteed that two segments are adjacent, orthogonal or facing each other and they have parallel longitudinal axes that are parallel to their common beam axis as well.
This association of adjacent planar segments can be used to achieve a first rough 3-D modeling of beams. If at least two sides of a beam are covered by planar segments, it is possible to even go a step further and fit a rigid body to the segment points.
3.5 Fit cuboids for beams
The associated segments of a beam are processed further, as the workflow contains a stage where attempts are made to fit a cuboid to the points of the beam segments.
The cuboid is a flawless representation of the historic wooden beam. Any deformations of the beams, such as deflection or torsion, are neglected in this first modeling approach. For fitting least squares estimation is used. Pairwise orthogonal or parallel planes build the side faces of the cuboid and are fitted to the points. Thus the squared distances between segment points and the cuboid are minimized.
3.6 Intersect beams and analyze structure
The difficulties in the final processing stage are the modeling of the beams in their correct dimension as well as the detection and modeling of woodworking joints and how the timber elements interlock. The materials used and the techniques applied in a joint indicate the purpose of that joint within the structure.
Scan shadows and reduced quality in some areas of the point cloud make it impossible to detect all beams, to their full extent automatically. It is therefore necessary to extend these incomplete beams to their full length and to the joints where they interlock with other beams. This can be achieved by using overall information, e.g. about the regularity of the entire roof structure. Beams can be elongated according to the points in the point cloud. Even if the segmentation does not give enough useful information for an automated detection of beams, the point cloud contains information as to whether there are objects or not.
Processing as described in 3.2 to 3.5 has been implemented and evaluated so far. The next section provides an overview of the results of each processing step.
3.7 Results of the processing chain
The results of the normal vector computation for each point are heavily dependent on the neighbor points selected and the chosen method of dealing with edges in the plane estimation. With a
selection of eight nearest neighbor points for the computation, most of the normal vectors of a beam point in homogeneous directions. The robust plane estimation prevents edges being rounded (see Fig. 7).
Fig. 8 shows the segmentation result with a selected homogeneity criterion of a maximum angle of 6° between the normal vectors of two neighboring points and a search radius of 0.03 m. As the figure shows, points on the side faces of different beams belong to the same segment if the transition between the beams is sufficiently smooth. In some cases, gaps between elements or cracks in the wood may cause an otherwise smooth surface to be split up into two or more segments.
In the top of the roof, near the ridge, there is a noticeable reduction in the quality of the point cloud and the quality of the results decreases accordingly. This is mainly due to the scan shadows caused by the overhead wooden walkways in the selected roof structures. This quality issue is reflected in the results of the segmentation and affects the results throughout this workflow.
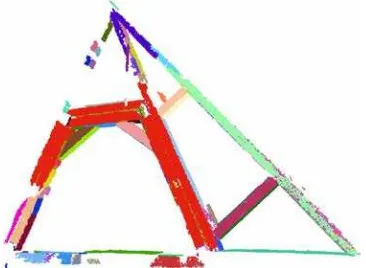
The detection of segments that belong to the same wooden beam was discussed in the previous sections of this work. The resulting beams are visualized in Fig. 9 and Fig. 10. Whereas Fig. 9 consists of planar beam segments only, the beams in Fig. 10 are modeled with cuboids. Again, both figures show the incomplete area at the top of the roof. The results in Fig. 9 are computed fully automatically within the processing chain. Fig. 10 presents the expected outcome of processing step 3.5.
Figure 7: Normal vectors in a 2-D slice of a pair of rafters
Figure 8: Segments of different beams; Different colours represent different segment IDs
4. EXAMPLES AND DISCUSSION
All partial results presented in this paper, and the results in the following examples, were obtained from a laser scan in the roof of one wing of the Amalienburg in Vienna, which is part of the Vienna Imperial Palace. Dendrochronological analysis determined that most of the timber used was felled in 1693/94 (see Eßer et al., 2016a)1. The first dataset selected, which was used in the previous figures, was captured from five different scan positions and contains approximately 3.5 million points. Typical point distances at the beam surface range from 1 mm to 1 cm.
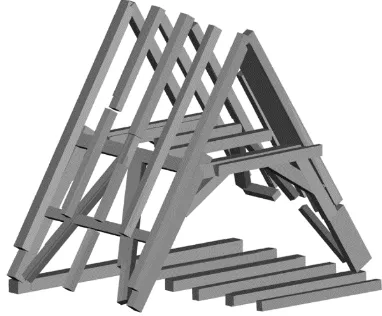
The second example is from a neighboring wing, also located in the Amalienburg. The used point cloud is a small section of a larger scan campaign involving over 40 scan positions. The dataset consists of 1.5 million points and because of the many different scan positions, the point density is higher than in the previous dataset. The construction is in the very common form of a rafter roof with inclined principal trusses. Both levels of this construction contain wooden walkways including handrails, as shown in Fig. 11. The scan also contains the roof covering. The roof tiles have no relevance for the architectural and the structural model and need to be removed during processing.
As the sets of experiments show, the developed workflow is heavily dependent on the results of the segmentation shown in Fig. 12. However no optimal homogeneity criterion could yet be found, whereby damages on the wood do not split up the element
1The dendrochronological analysis was done by Dr. Michael Grabner, University of Natural Resources and Life Sciences, Vienna.
into multiple segments and gaps between two elements are identified as such and prevent faces of different beams being merged into one segment.
Figure 12: Results of the segmentation process
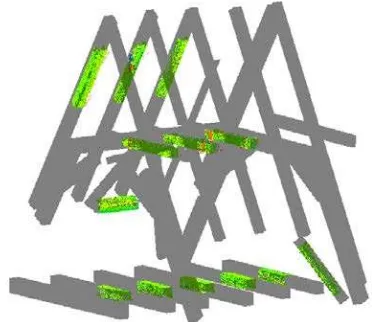
Fig. 13 shows the 3-D model of the roof construction containing the automatically-detected beams which are part of the structure. A visual analysis on the completeness of the result shows that 38 out of 40 beams present in the construction were at least partially detected. For a structural analysis, this model needs to be completed and expanded by the joints of the beams. For the accuracy analysis of the prelim results of the beam reconstruction several sections of beams have been selected manually from the model for a comparison with the points in the point cloud (see Fig. 14). The color values in the figure represent the distances from the points to the modelled beams. The histogram in Fig. 15 shows a unimodal distribution of the signed distances between points and beams, calculated with CloudCompare Cloud2Mesh-Distance. The mean value of the absolute differences results in 4.2 millimeter and the standard deviation is 6.8 millimeter. For a more robust indication of accuracy the median was calculated and results in 2.5 millimeter.
Figure 10: 3-D model containing beams represented by cuboids
Figure 13: Automatically-reconstructed beams represented by their best fitting cuboids
Figure 11: Point cloud of the roof construction in the Amalienburg
Figure 14: Manually selected beam sections for accuracy analysis. The color values of the points represent the distance
from the modelled beams
Figure 15: Histogram showing the distances (in meter) between point cloud and modelled beams
As part of the work a runtime analysis was carried out. The program was therefore tested on a common business PC with an Intel® Core™2 Quad Processor Q8400 (4x 2.67 GHz) and 8 GB RAM. While the time complexity for the calculation of the normal vectors and the segmentation process is linear with the number of points and therefore approximated with O(n), the runtime for the segment classification and the cuboid fit is also depending on the number of segments m and thus the complexity is approximately O(n+m). The results in the runtime analysis of the two test datasets, shown in Table 1, confirm the theoretical complexity analysis.
Dataset
Computation Amalienburg 1
(3.577.953 pts) Amalienburg 2 (1.494.047 pts) Normal vector calculation 02 min 21 sec 01 min 40 sec Segmentation
No. of segments 06 min 26 sec 1377 03 min 48 sec 474
Segment Classification
No. of beam segments 32 min 38 sec 404 14 min 12 sec 202
Cuboid Fitting
No. of beams 07 min 13 sec 105 03 min 30 sec 50
Total Time 48 min 38 sec 23 min 10 sec Table 1. Runtime analysis
5. CONCLUSION
The results confirm that the proposed method for the reconstruction of historic timber structures is technically feasible. It enables a high degree of automation for the modeling of beams according to their side faces. Only a few thresholds, such as the beam diameter or the search radius for the segmentation, need to be adjusted manually, in accordance with the data properties of the laser scans and the properties of the specific roof construction.
The quality issues regarding segmentation and further processing results lead to an incomplete automated detection of beams, which in turn requires an intense global analysis of the structure in order to produce a complete documentation of the construction. Several parameters such as the distance between rafters, ridge height, and beam dimension – and a catalogue of common joints in traditional timber structures – need to be included in the automated analysis to produce a complete reconstruction. In each case, automated completion needs to be based on the points recorded in the laser scan, to ensure that no roof element which has in fact been removed or replaced is reconstructed by mistake due to duplication of information. With the information from the full 3-D architectural model – including beam dimensions, axes of the beams and joints – it is possible to move on to the structural model. This modeling of structural and architectural information from 3-D point clouds permits the interdisciplinary documentation and analysis of historic timber structures, where photogrammetry provides various methods of data processing, and architects and civil engineers can contribute their expert knowledge on the structure of historic roofs. Up to date structural engineering software respects nonlinear structural behavior of constructions taking into account aspects such as material characteristics, joint behavior for different kinds of loads and cracking sequences, etc. (see Eßer et al., 2016a).
A future aim could be to store the information in Building Information Models (BIM), enabling efficient collaboration in adaptive re-use planning between the various disciplines involved. Bringing point cloud data to BIM is already an ongoing research topic and development process in the field of building and planning in existing structures, where software solutions are still required (compare e.g. Tonn 2017, Braunes 2014).
REFERENCES
Attene, M, Spagnuolo, M., 2000. Automatic Surface Reconstruction from Point Sets in Space. Computer Graphics Forum 19(3), 457-465. DOI: 10.1111/1467-8659.00438.
Baik, A., Yaagoubi, R., Boehm, J., 2015. Integration of Jeddah historical BIM and 3D GIS for documentation and restoration of historical monument. The International Archives of Photogrammetry, Remote Sensing and Spatial Information Sciences XL-5/W7, 29-34, DOI: 10.5194/isprsarchives-XL-5-W7-29-2015
Braunes, J., 2014. Von der Punktewolke zum Building Information Model (BIM) - Konsequenzen und Wege für die Bestandserfassung. VDVmagazin 2, 132-136.
Dorninger, P., Nothegger, C., Rasztovits, S., 2013. Efficient 3-D documentation of Neptune fountain in the park of Schönbrunn palace at millimeter scale. Proceedings XXIV International CIPA Symposium, ISPRS Annals II(5/W1), 103-108. DOI:10.5194/isprsannals-II-5-W1-103-2013
Eßer, G., Styhler-Aydın, G., Hochreiner, G., 2016a. Construction history and structural assessment of historic roofs – An interdisciplinary approach. In: Van Balen, K., Verstrynge, E. (Eds) Structural analysis of historical constructions. Anamnesis,
diagnosis, therapy, controls, London, GB, pp. 790-795.
Eßer, G., Styhler-Aydın, G., Hochreiner, G., 2016b. The historic roof structures of the Vienna Hofburg: An innovative interdisciplinary approach in architectural sciences laying ground for structural modeling. In: Eberhardsteiner, J., Winter, W., Fadai, A., Pöll, M. (Eds) WCTE 2016. World conference on
timber engineering, e-book, Wien, Austria, pp. 3039-3047.
Glira, P., Pfeifer, N., Briese, C., Ressl, C., 2015. A Correspondence Framework for ALS Strip Adjustments based on Variants of the ICP Algorithm. Photogrammetrie-Fernerkundung-Geoinformation 2015(4), 275-289
Hochreiner, G., Eßer, G., Styhler-Aydın, G., 2016. Modern timber engineering methods in the context of historical timber structures. In: Eberhardsteiner, J., Winter, W., Fadai, A., Pöll, M. (Eds) WCTE 2016. World conference on timber engineering, e-book, Wien, Austria, pp. 4830-4838.
Hoppe, H., DeRose, T., Duchamp, T., McDonald, J., Stuetzle, W., 1992. Surface reconstruction from unorganized points. SIGGRAPH '92 Proceedings of the 19th annual conference on Computer graphics and interactive techniques. ACM SIGGRAPH Computer Graphics 26(2), 71-78.
Kazhdan, M., Bolitho, M., Hoppe, H., 2006. Poisson surface reconstruction. Proceedings of the fourth Eurographics symposium on Geometry processing (Vol. 7).
Lee, J., Son, H., Kim, C., Kim, C., 2013. Skeleton-based 3-D reconstruction of as-built pipelines from laser-scan data. Automation in Reconstruction 35, 199-207.
Murphy, M., McGovern, E., Pavia, S., 2013. Historic Building Information Modelling – Adding intelligence to laser and image based surveys of European classical architecture. ISPRS Journal of Photogrammetry and Remote Sensing 76, 89-102. DOI: 10.1016/j.isprsjprs.2012.11.006
Jung, J., Hong, S., Jeong, S., Kim, S., Cho, H., Hong, S., & Heo, J., 2014. Productive modeling for development of as-built BIM of existing indoor structures. Automation in Construction, Volume 42, 68-77. DOI: 10.1016/j.autcon.2014.02.021
Pfeifer, N., Winterhalder, D., 2004. Modelling of tree cross sections from terrestrial laser scanning data with free-form curves. International Archives of Photogrammetry, Remote Sensing and Spatial Information Sciences 36(8/W2), 76-81.
Pfeifer, N., Mandlburger, G., Otepka, J. & Karel, W., 2014: OPALS – A framework for Airborne Laser Scanning data analysis. Computers, Environment and Urban Systems 45, 125-136
Rabbani, T., Dijkman, S., van den Heuvel, F., Vosselman, G., 2007. An integrated approach for modelling and global registration of point clouds. ISPRS Journal of Photogrammetry and Remote Sensing 61(6), 355-370.
Raumonen, P., Kaasalainen, M., Åkerblom, M., Kaasalainen, S., Kaartinen, H., Vastaranta, M., Holopainen, M., Disney, M., Lewis, P., 2013. Fast automatic precision tree models from terrestrial laser scanner data. Remote Sensing 5(2), 491–520. DOI: 10.3390/rs5020491
Thies, M., Pfeifer, N., Winterhalder, D., Gorte, B.G.H., 2004. Three-dimensional reconstruction of stems for assessment of taper, sweep and lean based on laser scanning of standing trees. Scandinavian Journal of Forest Research 19(6), 571–581. DOI: 10.1080/02827580410019562.
Thomson, C., Boehm, J., 2015. Automatic Geometry Generation from Point Clouds for BIM." Remote Sens. 7(9): 11753-11775. DOI: 10.3390/rs70911753
Tonn, C., Bringmann, O., 2017. Punktwolken zu BIM - Methoden der Bauteilanpassung in Laserscannerdaten (Point Clouds to BIM - Methods for Building Parts Fitting in Laser Scan Data). AVN 124, 21-26.
Volk, R., Stengel, J., Schultmann, F., 2014. Building Information Modeling (BIM) for existing buildings — Literature review and future needs. Automation in Construction, Volume 38, 109-127. DOI: 10.1016/j.autcon.2013.10.023
Wang, D., Hollaus, M., Puttonnen, E., Pfeifer, N., 2016a. Automatic and Self-Adaptive Stem Reconstruction in Landslide-Affected Forests. Remote Sensing 8(12), 974. DOI: 10.3390/rs8120974
Wang, D., Kankare, V., Puttonen, E., Hollaus, M., Pfeifer, N., 2016b. Reconstructing Stem Cross Section Shapes from Terrestrial Laser Scanning. IEEE Geoscience and Remote
Sensing Letters 14(2), 272-276. DOI:
10.1109/LGRS.2016.2638738
Xiong, X., Adan, A., Akinci, B., Huber, D., 2013. Automatic creation of semantically rich 3D building models from laser scanner data. Automation in Construction, Volume 31, 325-337. DOI: 10.1016/j.autcon.2012.10.006