DETECTION OF CITRUS TREES FROM UAV DSMS
A. O. Ok, A. Ozdarici-Ok
Dept. of Geodesy and Photogrammetry, Nevsehir H.B.V. University, 50300 Nevsehir, Turkey – (ozgunok, asliok)@nevsehir.edu.tr
Commission II, WG II/III
KEY WORDS: Citrus Trees, DSM, Radial Symmetry, Local Maxima, Automated Detection, UAVs
ABSTRACT:
This paper presents an automated approach to detect citrus trees from digitals surface models (DSMs) as a single source. The DSMs in this study are generated from Unmanned Aerial Vehicles (UAVs), and the proposed approach first considers the symmetric nature of the citrus trees, and it computes the orientation-based radial symmetry in an efficient way. The approach also takes into account the local maxima (LM) information to verify the output of the radial symmetry. Our contributions in this study are twofold: (i) Such an integrated approach (symmetry + LM) has not been tested to detect (citrus) trees (in orchards), and (ii) the validity of such an integrated approach has not been experienced for an input, e.g. a single DSM. Experiments are performed on five test patches. The results reveal that our approach is capable of counting most of the citrus trees without manual intervention. Comparison to the state-of-the-art reveals that the proposed approach provides notable detection performance by providing the best balance between precision and recall measures.
1. INTRODUCTION
The detection of individual trees using automatic and semi-automatic methods from very-high-resolution (VHR) datasets is one of the challenges of remote sensing and computer vision. The trees are one of the most significant topographic elements of the plant cover, because they are the major reservoirs of providing nutrition, forestry, shelter, CO2 storage. Strategically important certain types of trees like citrus, palm etc. requires further attention since achievement of decisions towards quick and reliable agricultural production is further important to ensure the sustainability of agricultural production.
In this paper, we utilize digitals surface models (DSMs) extracted from a UAV platform for detecting citrus trees in Mersin province of Turkey, a country ranking 9th in the world citrus fruit production with about 4 million tons in more than 125 thousand hectares (TUIK, 2015). Therefore, extracting reliable information (location and number) of the citrus trees is an important task. To our knowledge, such information related to the citrus trees is not entirely known considering the regional and country levels for most of the developing countries. Therefore, a precise detection step from remotely sensed data is a requirement. For sure, intensive manual processing (either on site and/or from images) is an alternative strategy to collect the required information of citrus trees. Although quite reliable results are achieved from manual investigation, such an operation requires qualified labour force, and therefore, expensive and time-consuming. For that reason, utilization of automatic methods is essential, especially for the detection step.
In this paper, we present an approach to automatically detect citrus trees. The approach considers the symmetric nature of the citrus trees and detects them from a single source, DSM. In a very recent work, we presented a new form of orientation-based radial symmetry transform (Ok and Ozdarici-Ok, 2017) that can be directly applied to an input like DSM to detect and label the citrus trees. We expand that approach such that false positive detections by the approach are mitigated using additional local maxima (LM) information. In this study, we guarantee that the output of the orientation-based radial symmetry transform also
coincides with an LM; thus, reducing the number of false positives and increasing the correctness rates. The feasibility of our approach is presented on five test patches having different contexts of orchards (first patch is shown in Fig. 1). We also show the results of four state-of-the-art approaches on our test patches, and prove the superiority of the method presented. Our contributions in this study are twofold: (i) Such an integrated approach (symmetry + LM) has not been tested to detect (citrus) trees (in orchards), and (ii) the validity of such an integrated approach has not been experienced for an input, e.g. a single DSM.
The remainder of this paper is organized as follows. The previous studies are summarized in Section 2. The details of the proposed approach are presented in Section 3. Our test dataset, evaluation strategy, and parameters of the approach are given in Section 4. The results are reported and discussed in Section 5. The concluding remarks and future directions are provided in Section 6.
2. PREVIOUS STUDIES
Automated extraction of trees is an open research area of remote sensing and computer vision, and numerous studies have been published so far. General trends, gaps and possible feature trends for tree extraction were examined in a recent review paper (Fassnacht et al., 2016). It was reported that active data are suitable for tree species classification, whereas passive and
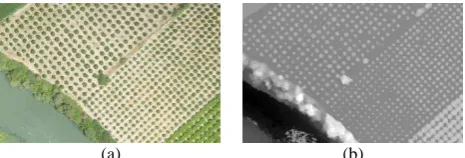
(a) (b)
Figure 1. Test patch #1. (a) RGB UAV image acquired on July 2016, and (b) the photogrammetric DSM generated using dense
hyperspectral systems have potential for this purpose although much effort has not been made yet for hyperspectral data.
Another recent review article focussing on the trends in individual tree detection and delineation with LiDAR data was published in (Zhen et al., 2016). Besides active data, image-based approaches still form another important research area of tree detection studies (e.g. Jing et al., 2012; Hung, et al., 2012; Malek et al., 2014; Ozdarici-Ok, 2015; Leckie, et al., 2016). According to the literature published up to now, most of the tree detection studies are related with the detection of areal and/or individual mixed and coniferous forests (e.g. Wang et al., 2012; Kandare, 2016) and urban trees (e.g. Ouma and Tateishi, 2008; Li and Shao, 2013). A small part of studies deal with strategically important tree types, e.g. palm, mangrove, olive (e.g. Sharfi et al., 2011; Malek et al., 2014; Hung et al., 2012; Hadaś and Estornell, 2016). So far, there has been little attention focussing on the citrus trees (e.g. Fieber et al., 2013; Ozdarici-Ok, 2015; Ok and Ozdarici-Ok, 2017).
Another broad research area in this topic covers the studies whose framework includes a DSM, or a normalized DSM (nDSM), or a canopy height model (CHM) as an input data. Among the methods developed, segmentation (especially watershed method) applied to DSM–nDSM–CHM from active and/or passive data draws attention (e.g. Hyyppa et al., 2001; Wolf and Heipke, 2007; Kwak et al., 2007; Ene et al., 2012; Wallace, 2014; Liu et al., 2015; Paris et al., 2016). It is observed that the segmentation-based methods are generally applied together with seed generation (e.g. Hirschmugl et al., 2007), local maxima detectors (e.g. Popescu and Wynne, 2004; Kwak et al., 2007; Hirschmugl et al., 2007; Swetnam and Falk, 2014; Zhen et al., 2014; Eysn et al., 2015; Dalponte et al., 2015a, Li et al., 2016), or region growing (e.g. Hirschmugl et al., 2007; Zhen et al., 2015; Eysn et al., 2015). Some other methods, like image classification (e.g. Dalponte et al., 2014; Matsuki et al., 2015; Liu et al., 2015; Dalponte et al., 2015b), morphological analysis (e.g. Heinzel et al., 2011), wavelet analysis (e.g. Falkowski et al., 2006), regression analysis (e.g. Hadaś and Estornel, 2016) are other popular methods preferred in this context.
Considering the previous effort in this context, our approach specializes for the detection of citrus trees by taking into account two critical observations: (i) the citrus trees have a symmetric circular shape in general, and we present orientation-based radial symmetry transform (Ok and Ozdarici-Ok, 2017) to extract that information, (ii) the citrus trees present an LM with respect to their close neighbourhood, which we utilize extended maxima transformation (Soille, 1999) to extract LMs from a DSM. Thereafter, we filter out erroneous detections arising from symmetry transform using the LM information.
3. PROPOSED APPROACH
In an early work, fast radial symmetry transform (Loy and Zelinsky, 2003) was proposed to detect circular structures in images. However, their approach utilized many ad-hoc thresholds, and further problems associated with their approach are discussed in (Ok and Baseski, 2015), and an improved radial symmetry transform to detect circular objects from images were proposed. More recently, we proposed an orientation-based radial symmetry (Ok and Ozdarici-Ok, 2017) that is particularly designed to focus on above-ground circular objects from a DSM. In the following, we first review that approach, and improve the results of that approach using LM information.
The approach starts by defining the range of minimum and
maximum radii in pixels (rmin
,rmax) after taking into account all values of radii of a single citrus tree can retain, R = {rmin, rmin+1, … , rmax}, depending on the GSD of the input DSM. Next, we compute the gradient (Farid and Simoncelli, 2004) of the DSM and collect the magnitude, m(p), and orientation, o(p) components for each pixel p, where the orientation component is also normalized to achieve unit direction vectors, �⃗ . Note that we do not apply any noise filtering step to the input DSM beforehand thanks to the powerful multi-image semi-global matching (SGM) strategy applied to generate the DSM (see details in Section 4). Thereafter, the orientation image (Or) of a
DSM for a specific radius r in R can be computed directly using the formula given below:
(� � ){ �}= (� � ){ }+ 1 . (1)
In Eq. 1, pr denotes the unit direction vector pointing a distance
defined by radius r from p and can be computed by � � = � + �⃗ . + � where c is a constant vector in pixels (c = [0.5 0.5]), the operator . maps the computed number to the smallest previous integer. The superscripts ({new} and {old}) in Eq. 1 describe an accumulation performed in image space for a radius r. The accumulated pixels in Or hold the critical information
such incorrect accumulation, and a rotation invariant two dimensional Gaussian kernel with a fixed (that is G ) to spread the influence of accumulated pixels in image space:
�= ∑ ���
max { ���} �
�= . (2)
In Eq. 2, � denotes the aggregated orientation image for a radius r depending on the number of strictness parameters chosen (i.e., m). The denominator part in Eq. 2 ensures that the computed values for each �� contributes equally to �. Note that applying the Gaussian kernel not only reduces the level of noise in image space after the accumulation but also spreads the influence of highly accumulated pixels to neighbouring pixels to achieve a smooth aggregated orientation image.
Note that the aggregated orientation image � reflects the orientation based symmetry of a DSM for a specific radius r in R. Therefore, we repeat above steps for all r in R and compute the orientation symmetry image (OS) of a DSM by summing all
aggregated orientation images for a given R: = ∑ � (Fig. 2b). The orientation symmetry image OS contains higher pixel
values around centre locations of circular tree objects in a DSM. Thus, we need to build interest regions after thresholding the orientation symmetry image (e.g. OS > ). However, this task is
not trivial since the resulting interest regions will form the basis of the detection step. Besides, finding an optimal value (*) that is valid across diverse DSM datasets full of multiple types of trees having varying densities, and along with other objects (buildings, roads, greenhouses etc.) is also a problematic issue. In this study, we benefit from unsupervised multilevel thresholding method (Otsu, 1979) to achieve an automated threshold value. We build our interest regions (RI) using the smallest threshold provided, i.e. OS > 1 (Figs. 2c and 2d).
As can be seen in Figs. 2c and 2d, interest regions successfully locate most of the citrus trees. However, as expected, other (semi-) symmetric objects (e.g. other tree canopies) provide symmetry up to a level; therefore, also involved in interest ISPRS Annals of the Photogrammetry, Remote Sensing and Spatial Information Sciences, Volume IV-1/W1, 2017
ISPRS Hannover Workshop: HRIGI 17 – CMRT 17 – ISA 17 – EuroCOW 17, 6–9 June 2017, Hannover, Germany
regions. In this study, this problem is mitigated by taking into account LM information. We benefit from the extended maxima transformation (Soille, 1999; Kwak et al., 2007) to compute LM regions. The extended maxima transformation can be computed by finding the regional maxima of the H-maxima transformation. The H-maxima transformation aims to suppress all local maxima in a DSM whose elevation value is lower than or equal to a given threshold, h. This can be achieved by performing a grayscale image reconstruction (Vincent, 1993) using two images, namely the mask (I: DSM) and the marker (J: DSM-h). The grayscale reconstruction, rec(J, I), where J ≤ I is obtained by successive grayscale geodesic dilations, �� , until stability is reached (Vincent, 1993):
�� , = lim →∞�� = lim →∞�⏟ � �� … �� ime
. (3)
In Eq. 3, n is the geodesic dilation size and is computed by iterating geodesic dilations for n times to reach stability, and �� denotes the elementary geodesic dilation of grayscale image J given I: �� = � , ⨁ � . In this equation, ⨁ denotes the dilation operation, and D is the flat square structuring element defining 8-neigbourhood connectivity. Once H-maxima transformation is computed through reconstruction with a specific threshold h, the LM regions are found by the regional maxima (connected pixels with a constant elevation, whose elevation is higher than their external boundary pixels) of the H-maxima transformation (Fig. 2e). Finally, we filter out erroneous detections arising from symmetry transform using the LM information. We label connected components in interest regions (RI) using 8-neigbourhood connectivity, and check whether any pixel in a connected component is labelled as an LM region or not. Finally, we remove all the components with no LM evidence (Fig. 2f).
(a) (b)
(c) (d)
(e) (f)
Figure 2. (a) DSM of test area #1, (b) aggregated orientation symmetry (OS) for αi = 4, 5, and 6, (c) detected regions (RI), (d)
the green “+” corresponds to the centroid location of each RI, (e) the LM regions found (h = 0.2 m), and (f) filtered centroid
locations using LM information.
4. DATASET, EVALUATION, AND PARAMETERS
The UAV used in our study is a smart plane called SmartOne-C (Smartplanes, 2016). It has 1.2 m wing span, high strength skin and equipped with 16.1 MP calibrated Ricoh GR camera. The smart plane can fly up to 200 m and the GSD ranges between 2.6-5.2 cm/pixel depending on the flying height. In our case, we set up the flying height around 140 m which corresponds to a GSD of approximately 3.5 cm. The forward and side overlap is set as 80% and 60%, respectively, to achieve a sufficient overlap between images to facilitate image matching.
The UAV images are processed with Pix4D software (Pix4D, 2016). During the bundle adjustment of UAV images, a total of 52 Ground Control Points (GCPs) were collected with an SL500 RTK GNSS receiver. Among the available GCPs, 9 of them were reserved as Independent Control Points (ICPs) and the root mean square (RMS) values for the 9 ICPs after the bundle-block adjustment were computed to be 6 cm (≈ 1.5 pixels) and 11 cm (≈ 3 pixels) at most in horizontal and vertical directions, respectively. The powerful multi-image SGM approach (Hirschmüller, 2008) available in Pix4D was used to create point clouds from the overlapping UAV images. Note that any part of the region is covered by at least five images to minimize the matching errors and noise, thus increasing the point cloud accuracy. This point cloud was then used to generate the dense DSMs (≈ 3.5 cm) and true-orthoimages.
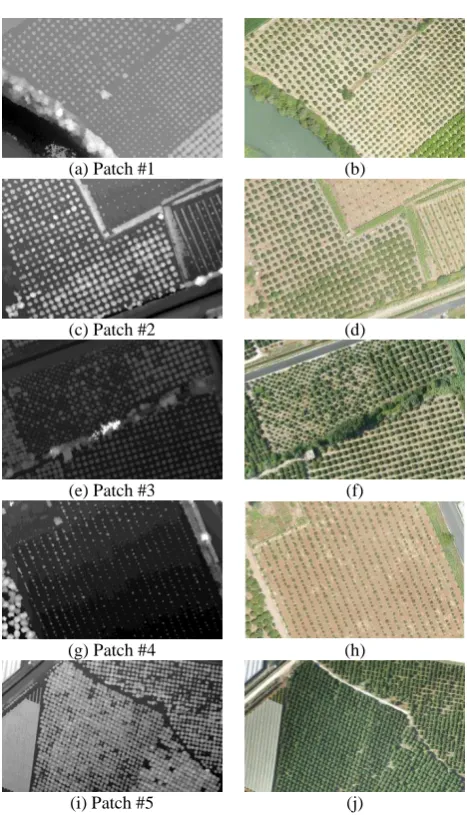
Our study area covers the northern part of the city Mersin, a region covering one of the most productive citrus orchards of Turkey. We selected five test patches from the generated DSMs to assess the performance of the proposed approach (Fig. 3). In this study, GSD of all test patches is reduced as a factor of two (≈ 7 cm) to facilitate and speed up the processing. For validation purposes, the reference data are generated by manual on-screen digitizing using DSMs and UAV true ortho-images of the test patches (Fig. 4a-f). Partial citrus trees at the edges of the DSM patches are also included during the digitization process.
During the assessment of the accuracies of the detection step, we consider a reference citrus tree object as detected if any part of the reference citrus tree is hit by the approaches. Because a single tree is described with a single pixel (i.e. the location of the stem) found in the detection step, we label a reference tree as detected (i.e. TP) if any pixel within an individual tree canopy is labelled as a stem. We label a reference citrus tree as FN if no stem is available for that tree, and we mark a detected stem as FP if it does not correspond to any part of the citrus tree canopies in the reference data. Using these measures, three well-known metrics, precision, recall, and F1-score, are calculated to evaluate the results:
��� � =| |+|� || | (4)
���� =| |+|� || | (5)
= � � +� � �� . (6)
In Eqs. 4-6, the operator | . | is the set cardinality. In Eq. 6, the F1-score can be used to evaluate the overall performance.
(a) Patch #1 (b)
(c) Patch #2 (d)
(e) Patch #3 (f)
(g) Patch #4 (h)
(i) Patch #5 (j)
Figure 3. UAV dataset: DSM patches (#1-#5) are shown in (left column). Corresponding ortho-images (right column) are only
presented for better visual understanding of the test patches.
number of tests on different parameters and investigated the effects of each parameter using the quality measures given in Eqs. 4-6 to select the best parameter configuration. We set the minimum radius to the smallest observable radius for citrus tree detection (i.e. rmin = 0.3 m), and the maximum radius to the largest radius for citrus trees observable in our test patches (i.e. rmax = 3.4 m). Considering the strictness parameter α, lower values (e.g. α = 2) put emphasis on non-symmetric features along with the radial symmetric ones. Choosing a higher α value suppresses non-symmetric radial features as anticipated; however, the orientation values of symmetric features are also reduced. This problem is mitigated by using the aggregation strategy presented in (Ok and Ozdarici-Ok, 2017). In this study, we aggregate the orientation symmetry results for a series of strictness values, i.e. αi = 4, 5, and 6. Thus, this gives us
opportunity to better focus on radial symmetric features, while the non-symmetric evidence in the output is minimized. The purpose of the Gaussian kernel G is to spread the influence of the orientation symmetry (Eq. 2), and the rotation invariance and a fixed allow us to have a balanced accumulation. We benefit from isotropic filtering in (Geusebroek, 2003) to efficiently compute the Gaussian smoothing, where we set =5 pixels. In respect to the number of classes (v) required for
(a) (b) (c)
(e) (f)
(g) Figure 4. (a-f) The reference data (in red color) are generated by manual on-screen digitizing, and (g) performance results computed for different h thresholds.
Task Parameter Value
Generation of interest regions (RI)
rmin –rmax 0.3 – 3.4 m
strictness(αi) 4, 5, 6
sigma ( ) 5 pixels
number of classes (v) 3
Generation of LM
regions threshold (h) 0.2 m
Table 1. Parameters of the proposed approach
multilevel thresholding, all values tested provide comparable results except for the binary case (v = 2) in which Otsu’s method optimizes a threshold for two classes. For that parameter, we fixed the number classes to 3 as it provided the slightly the best balance performance (Ok and Ozdarici-Ok, 2017). Considering the threshold h, we tested a range of parameters to select the best value, and we found 0.2 m provided the best balance between the precision and recall (Fig. 4g).
5. RESULTS AND DISCUSSION
We visualize the results of test patches in Fig. 5. These results demonstrate that our approach can provide promising results for the detection of citrus trees. The numerical results in Table 2 favour these facts. We achieved overall precision and recall as 94.9% and 81.6%, respectively. The computed F1-score for these five test patches is around 87.8%. Our approach correctly detected 3502 of 4290 citrus trees in all test patches and the total false positive object number is just 190. According to Fig. 5, the results give the impression that the detected citrus trees are convincing and representative. As shown, most of the citrus trees are detected successfully without having a strict limitation, e.g., planting pattern and orientation, texture, shape, elevation. It is also evident that the approach has capability to separate citrus trees from most of the other objects (e.g. bushes, other trees, water, roads, and greenhouse roofs).
DSM patch #4 has the lowest performances for all measures (Table 2). However, this result was expected because that test area is the most challenging case. The main reason for this challenge is that most of the citrus trees in the DSM are newly planted non-bearing trees. Thus, there may not be enough evidence for the accumulation performed in image space for most the young trees even though the processed DSMs have very high GSD (≈ 7 cm/pixel). Nonetheless, the F1-score computed is still slightly above 54%. Then again, the second lowest F1-score is observed for DSM patch #2. This is due to the recall computed around 81%, and the problem reappears in the upper right part of the area where only half of the newly ISPRS Annals of the Photogrammetry, Remote Sensing and Spatial Information Sciences, Volume IV-1/W1, 2017 ISPRS Hannover Workshop: HRIGI 17 – CMRT 17 – ISA 17 – EuroCOW 17, 6–9 June 2017, Hannover, Germany
,
Figure 5. (left column) The results of proposed approach, and (right column) the reference data.
Test Patch
# of Performance (%)
TP FP FN Precision Recall F1-score
#1 641 42 44 93.9 93.6 93.7
#2 430 31 98 93.3 81.4 87.0
#3 828 36 118 95.8 87.5 91.5
#4 282 24 454 92.2 38.3 54.1
#5 1321 57 74 95.9 94.7 95.3
Overall 3502 190 788 94.9 81.6 87.8
Table 2. Results of the proposed approach
Test Patch Image Size
(pixels)
Computational time (sec.)
#1 3124 x 1984 13.7
#2 2826 x 1794 11.7
#3 3039 x 1930 12.6
#4 2340 x 1473 7.9
#5 3973 x 2379 20.2
Table 3. Computational time elapsed by the proposed approach.
planted trees could be detected. Bearing in mind the problem occurring for the young trees, the results of other test patches prove that proposed approach is generic for different planting forms and has the ability to detect citrus trees in dense patterns. For example, only 74 out of 1395 citrus trees are missed in a difficult case in patch #5; as a result, the proposed approach reaches a recall performance of nearly 95%.
The processing times required by the proposed approach are provided in Table 3. The implementation and processing was performed in MatLab. All experiments were performed on a notebook computer with a quad core Intel i7 CPU @ 2.40GHz and 16 GB RAM. Our approach is quite feasible to run by parallel processing; therefore, we benefit from the built-in parallel processbuilt-ing (with four cores) available built-in MatLab to speed up the processing. According the computational times computed, it is possible to detect citrus trees from images with sizes approximately 6 MP in thirteen seconds with the approach presented.
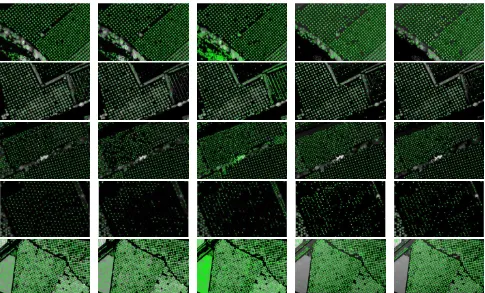
In this study, we also performed a comparison to the state-of-the-art approaches (Fig. 6, and Table 4). For all state-of-state-of-the-art approaches, we utilized nDSMs of the test patches generated by Pix4D software (Pix4D, 2016) to fulfil the input data requirements of the approaches. The GSD of the input nDSMs are exactly the same as the DSM utilized for our approach, except for the approach in (Dalponte et al., 2015) wherein we resampled the GSD of the nDSM to 0.5 m to get meaningful representative results. For all approaches, we found that the default parameters provided the best results in most cases. We set the maximum radii of a tree to 3.4 m, and the minimum tree top height to 1 m, if required as an input by the approaches. Besides, for the approach in (Swetnam and Falk, 2014), we set the canopy ratio to 1 which provided the best results for our case.
The comparison of the detection results of the proposed approach with the results of state-of-the-art approaches are given in Table 4. First, the proposed approach clearly outperforms the state-of-the-art approaches in precision scores. All the precision scores computed are above 92%. Therefore, proposed approach improves the precision scores of the first three state-of-the-art approaches of around 7% at least in an overall sense. Besides, compared to the results in (Ok and Ozdarici-Ok, 2017), adding LM information into the framework improves the overall precision scores 3.4%. This is, of course, due to the reason that some of the incorrect detections could be now be eliminated by integrating the LM information. In contrast to the precision scores, proposed approach cannot achieve the best recall scores in none of the test patches. For that case, the best overall result is achieved by the approach in (Ok and Ozdarici-Ok, 2017); however, the overall recall result of the proposed approach is only 1.6% away from that result, thus; provides the best overall F1-score of 87.8%. Nevertheless, we also note that the level of improvement achieved is only slightly better (0.8%) in terms of the overall F1-score compared to our previous approach. We also observe that other approaches also provided acceptable F1-scores around 75% or more. It is also noteworthy that the approach in (Popescu and Wynne, 2004) still provides the best scores for the patch #4 with an F1-score 60.5%.
6. CONCLUSIONS AND FUTURE WORK
In this paper, an approach to automatically detect citrus trees is presented. The approach considers the symmetric nature of the citrus trees and detects them from a single source, DSM. The main novelty of the proposed approach is the integration of LM information into the framework to improve the output of the orientation-based radial symmetry transform.
The proposed approach is tested for five DSM patches generated from UAV images comprising orchards of different planting patterns and orientation, texture, shape, and elevation. The results prove that our approach is generic for the detection ISPRS Annals of the Photogrammetry, Remote Sensing and Spatial Information Sciences, Volume IV-1/W1, 2017
,
Figure 6. Detection results of the approaches. (first column) The results of the approach in (Popescu and Wynne, 2004), (second column) the results of the approach in (Swetnam and Falk, 2014), (third column) the results of the approach in (Dalponte et al., 2015), (fourth column) the results of the approach in (Ok and Ozdarici-Ok, 2017), and (fifth column) the results of the approach. The green “+” signs in each figure corresponds to a (citrus) tree (crown) location found by the approaches. Note that, nDSM is used as an input except for (Ok and Ozdarici-Ok, 2017) and the proposed approach; therefore, the brightness levels of the DSMs presented in the background of the last two columns are manually adjusted to approximately match the brightness levels of the nDSMs presented
in the first three columns to improve the visual interpretability.
DSM patch
Performance (%)
Approach in (Popescu and Wynne,
2004)
Approach in (Swetnam and Falk,
2014)
Approach in (Dalponte et al.,
2015)
Approach in (Ok and Ozdarici-Ok,
2017)
Proposed Approach
Pre. Rec. F1-s. Pre. Rec. F1-s. Pre. Rec. F1-s. Pre. Rec. F1-s. Pre. Rec. F1-s.
#1 89.7 97.1 93.3 90.7 95.8 93.2 69.3 93.1 79.5 90.1 94.2 92.1 93.9 93.6 93.7
#2 83.3 82.2 82.8 85.8 71.8 78.2 62.4 79.4 69.9 87.9 82.2 84.9 93.3 81.4 87.0
#3 89.0 66.6 76.2 89.0 68.5 77.4 78.7 92.0 84.8 94.4 89.5 91.9 95.8 87.5 91.5
#4 89.6 45.7 60.5 85.3 22.2 35.2 74.8 27.5 40.2 80.8 39.4 53.0 92.2 38.3 54.1
#5 86.3 87.7 87.0 87.2 90.9 89.0 65.8 97.1 78.4 94.4 96.1 95.2 95.9 94.7 95.3
Total 87.4 76.7 81.7 88.0 72.6 79.5 69.3 81.2 74.8 91.5 82.9 87.0 94.9 81.6 87.8
Table 4. Comparison of the results of the state-of-the-art and the proposed approach. Pre., Rec., and F1-s. denote Precision, Recall and F1-score, respectively.
of citrus trees. Besides, assessments performed reveal that our approach is capable of providing the citrus trees in a scene with a promising performance (average F1-score of ≈ 88%). Comparison to the state-of-the-art reveals that the proposed approach provides superior detection performance by providing a better balance between precision and recall measures.
In this study, manually delineated tree crowns are used as reference data and such data may also include subjective errors. Besides, the highest peak location of a tree might not correctly represent the stem location; therefore, a detailed field work must be performed to collect the correct stem locations to perform a reliable comparison in that respect. We also plan to develop a
method that mutually optimizes LM information and the orientation-based radial symmetry transform to further improve the results. Moreover, the delineation of the detected trees is another essential task to be performed in a different future study. Note also that radial symmetry transform can also be directly applied to the true-orthoimages generated for the test sites. Therefore, it might also be interesting to compare the detection results of the image-based and DSM-based radial symmetry transforms. Besides, a method that efficiently computes the radial symmetry from the combination of the two datasets may further contribute the detection results.
ISPRS Annals of the Photogrammetry, Remote Sensing and Spatial Information Sciences, Volume IV-1/W1, 2017 ISPRS Hannover Workshop: HRIGI 17 – CMRT 17 – ISA 17 – EuroCOW 17, 6–9 June 2017, Hannover, Germany
ACKNOWLEDGEMENTS
This work was supported by the Scientific and Technical Research Council of Turkey (TUBITAK) under Grant No. 114Y671. The authors would like to Dr. Emre Başeski for his helps during this project. We also would like to thank Hürcan Atay, General Director of ATAY Engineering, for the UAV mission, and SATLAB Geosolutions Company for their support on the field work. The authors also acknowledge the effort spent by Süleyman Toprak and Esengül Zeyrek on reference data generation and field work.
The source code of the approach in (Popescu and Wynne, 2004) is from Digital Forestry Toolbox1 and developed by Matthew Parkan. The authors would like to thank Dr. Michele Dalponte, and Dr. Tyson L. Swetnam for their helps and graciously sharing the codes2,3 of their approaches.
REFERENCES
Dalponte, M., Ørka, H.O., Ene, L.T., Gobakken, T., and Næsset, E., 2014. Tree crown delineation and tree species classification in boreal forests using hyperspectral and ALS data. Remote Sensing of Environment, 140(1), pp. 306-317.
Dalponte, M., Reyes, F., Kandare, K., and Gianelle, D., 2015a. Delineation of individual tree crowns from ALS and hyperspectral data: a comparison among four methods. European Journal of Remote Sensing, 48(8), pp. 365-382.
Dalponte, M., Ene, L.T., Marconcini, M., Gobakken, T., and Næsset, E., 2015b. Semi-supervised SVM for individual tree crown species classification. ISPRS Journal of Photogrammetry and Remote Sensing, 110(12), pp. 77-87.
Ene, L., Næsset, E., and Gobakken, T., 2012. Single tree detection in heterogeneous boreal forests using airborne laser scanning and area-based stem number estimates. International Journal of Remote Sensing, 33(16), pp. 5171-5193.
Eysn, L., Hollaus, M., Lindberg, E., Berger, F., Monnet, J.-M., Dalponte, M., Kobal, M., Pellegrini, M., Lingua, E., Mongus, D., and Pfeifer, N., 2015. A benchmark of lidar-based single tree detection methods using heterogeneous forest data from the alpine space. Forests, 6(5), pp. 1721-1747.
Falkowski, M.J., Smith, A.M.S., Hudak, A.T., Gessler, P.E., Vierling, L.A., and Crookston, N.L., 2006. Automated estimation of individual conifer tree height and crown diameter via two-dimensional spatial wavelet analysis of lidar data. Canadian Journal of Remote Sensing, 32(2), pp. 153-161.
Farid, H., Simoncelli, E.P., 2004. Differentiation of discrete multidimensional signals. IEEE Transactions on Image Processing, 13(4), pp. 496-508.
Fassnacht, F.E., Latifi, H., Stereńczak, K., Modzelewska, A., Lefsky, M., Waser, L.T., Straub, C., and Ghosh, A., 2016. Review of studies on tree species classification from remotely sensed data. Remote Sensing of Environment, 186(1), pp. 64-87.
Fieber, K.D., Davenport, I.J., Ferryman, J.M., Gurney, R.J., scene. ISPRS Journal of Photogrammetry and Remote Sensing, 82, pp. 63-82.
Geusebroek, J.M., Smeulders, A.W.M. and van de Weijer, J., 2003. Fast anisotropic gauss filtering. IEEE Transactions on Image Processing, 12(8), pp. 938-943.
Hadaś E., Estornell, J., 2016. Accuracy of tree geometric parameters depending on the LiDAR data density. European Journal of Remote Sensing, 49(3), pp. 73-92.
Heinzel, J.N., Weinacker, H., and Koch, B., 2011. Prior-knowledge-based single-tree extraction. International Journal of Remote Sensing, 32(17), pp. 4999-5020.
Hirschmugl, M., Ofner, M., Raggam, J., and Schardt, M., 2007. Single tree detection in very high resolution remote sensing data. Remote Sensing of Environment, 110(4), pp. 533-544.
Hirschmüller, H., 2008. Stereo processing by semi-global matching and mutual information. IEEE Transactions on Pattern Analysis and Machine Intelligence, 30(2), pp. 328-341.
Hung, C., Bryson, M., and Sukkarieh, S., 2012. Multi-class predictive template for tree crown detection. ISPRS Journal of Photogrammetry and Remote Sensing, 68, pp.170-183.
Hyyppa, J., Kelle, O., Lehikoinen, M., and Inkinen, M., 2001. A segmentation-based method to retrieve stem volume estimates from 3-D tree height models produced by laser scanners. IEEE Transactions on Geoscience and Remote Sensing, 39(5), pp. 969-975.
Jing, L., Hu, B., Noland, T., and Li, J., 2012. An individual tree crown delineation method based on multi-scale segmentation of imagery, ISPRS Journal of Photogrammetry and Remote Sensing, 70, pp. 88-98.
Kandare, K., Orka, H. O., Chan, J. C-W., and Dalponte, M., 2016. Effects of forest structure and airborne laser scanning point cloud density on 3D delineation of individual tree crowns. European Journal of Remote Sensing, 49, pp. 337-359.
Kwak, D.-A., Lee, W.-K., Lee, J.-H., Biging, G.S., and Gong, P., 2007. Detection of individual trees and estimation of tree height using LiDAR data. Journal of Forest Research, 12(6), pp. 425-434.
Li, D., Guo, H., Wang, C., Li, W., Chen, H., and Zuo, Z., 2016. Individual tree delineation in windbreaks using airborne-laser-scanning data and unmanned aerial vehicle stereo images. IEEE Geoscience and Remote Sensing Letters, 13(9), pp. 1330-1334.
Li, X., Shao, G., 2013. Object-based urban vegetation mapping with high-resolution aerial photography as a single data source, International Journal of Remote Sensing, 34(3), pp. 771-789.
Liu, T., Im, J., and Quackenbush, L.J., 2015. A novel transferable individual tree crown delineation model based on Fishing Net Dragging and boundary classification. ISPRS Journal of Photogrammetry and Remote Sensing, 110, pp. 34-47.
Leckie, D.G., Walsworth, N., and Gougeon, F.A., 2016. Identifying tree crown delineation shapes and need for remediation on high resolution imagery using an evidence based ISPRS Annals of the Photogrammetry, Remote Sensing and Spatial Information Sciences, Volume IV-1/W1, 2017
approach, ISPRS Journal of Photogrammetry and Remote Sensing, 114, pp. 206-227.
Loy, G., Zelinsky, A., 2003. Fast radial symmetry for detecting points of interest. IEEE Transactions on Pattern Analysis and Machine Intelligence, 25(8), pp. 959-973.
Malek, S., Bazi, Y., Alajlan, N., AlHichri, H., and Melgani, F., 2014. Efficient framework for palm tree detection in UAV images. IEEE Journal of Selected Topics in Applied Earth Observations and Remote Sensing, 7(12), pp. 4692-4703.
Matsuki, T., Yokoya, N., and Iwasaki, A., 2015. Hyperspectral tree species classification of japanese complex mixed forest with the aid of lidar data. IEEE Journal of Selected Topics in Applied Earth Observations and Remote Sensing, 8(5), pp. 2177-2187.
Ok, A.O., and Baseski, E., 2015. Circular oil tank detection from panchromatic satellite images: a new automated approach. IEEE Geoscience and Remote Sensing Letters, 12(6), pp. 1347-1351.
Ok, A.O., and Ozdarici-Ok, A., 2017. 2-D delineation of individual citrus trees from UAV-based dense photogrammetric surface models, International Journal of Digital Earth, (revised version under review)
Ozdarici-Ok, A., 2015. Automatic detection and delineation of citrus trees from VHR satellite imagery. International Journal of Remote Sensing, 36(17), pp. 4275-4296.
Otsu, N., 1979. A threshold selection method from gray-level histograms. IEEE Transactions on Systems, Man, and Cybernetics: Systems, 9(1), pp. 62-66.
Ouma, Y.O., Tateishi, R., 2008. Urban-trees extraction from Quickbird imagery using multiscale spectex-filtering and non-parametric classification, ISPRS Journal of Photogrammetry and Remote Sensing, 63(3), pp. 333-351.
Paris, C., Valduga, D., and Bruzzone, L., 2016. A hierarchical approach to three-dimensional segmentation of LiDAR data at single-tree level in a multilayered forest. IEEE Transactions on Geoscience and Remote Sensing, 54(7), pp. 4190-4203.
Pix4D, 2016. https:// pix4d.com (19 Jul. 2016).
Popescu, S.C., and Wynne, R.H., 2004. Seeing the trees in the forest: Using lidar and multispectral data fusion with local filtering and variable window size for estimating tree height. Photogrammetric Engineering and Remote Sensing, 70(5), pp. 589-604.
Shafri , H.Z.M., Hamdan, N., and Saripan, M.I., 2011. Semi-automatic detection and counting of oil palm trees from high spatial resolution airborne imagery, International Journal of Remote Sensing, 32(8), pp. 2095-2115.
Soille, P., 1999. Morphological Image Analysis: Principles and Applications, Springer-Verlag, pp. 170-171.
Smartplanes, 2016. http://smartplanes.se/ (19 Jul. 2016).
Swetnam, T.L., Falk, D.A., 2014. Application of Metabolic Scaling Theory to reduce error in local maxima tree
segmentation from aerial LiDAR. Forest Ecology and Management, 323(6), pp. 158-167.
TUIK., 2015. “Bitkisel Üretim İstatistikleri”, http://www.tuik.gov.tr/PreTablo.do?alt_id=1001 (26.01.2017)
Vincent, L., 1993. Morphological grayscale reconstruction in image analysis: applications and efficient algorithms. IEEE Transactions on Image Processing, 2(2), pp. 176-201.
Wallace, L., Lucieer, A., and Watson, C.S., 2014. Evaluating tree detection and segmentation routines on very high resolution UAV LiDAR data. IEEE Transactions on Geoscience and Remote Sensing, 52(12), pp. 7619-7628.
Wang, Z., Boesch, R., and Ginzler, C., 2012. Forest delineation of aerial images with Gabor wavelets. International Journal of Remote Sensing, 33(7), pp. 2196-2213.
Wolf (né Straub), B.M., Heipke, C., 2007. Automatic extraction and delineation of single trees from remote sensing data. Machine Vision and Applications, 18(5), pp. 317-330.
Zhen, Z., Quackenbush, L.J., and Zhang, L., 2014. Impact of tree-oriented growth order in marker-controlled region growing for individual tree crown delineation using airborne laser scanner (ALS) data. Remote Sensing, 6(1), pp. 555-579.
Zhen, Z., Quackenbush, L.J., Stehman, S.V., and Zhang, L., 2015. Agent-based region growing for individual tree crown delineation from airborne laser scanning (ALS) data. International Journal of Remote Sensing, 36(7), pp. 1965-1993.
Zhen, Z., Quackenbush, L.J., and Zhang, L., 2016. Trends in automatic individual tree crown detection and delineation— evolution of LiDAR data. Remote Sensing, 8(4), article number: 333.
ISPRS Annals of the Photogrammetry, Remote Sensing and Spatial Information Sciences, Volume IV-1/W1, 2017 ISPRS Hannover Workshop: HRIGI 17 – CMRT 17 – ISA 17 – EuroCOW 17, 6–9 June 2017, Hannover, Germany