BRAZILIAN INLAND WATER BIO-OPTICAL DATASET TO SUPPORT CARBON
BUDGET STUDIES IN RESERVOIRS AS WELL AS ANTHROPOGENIC IMPACTS IN
AMAZON FLOODPLAIN LAKES: PRELIMINARY RESULTS
C. Barbosa a, *, E. Novo a, R. Ferreira a, L. Carvalho a, C. Cairo a, F. Lopes c, J. Stech a, E. Alcantara ba
National Institute for Space Research, Av. dos Astronautas 1758, São Jose dos Campos- Brazil – [email protected], (evlyn, rmpf, lino, carol_tc, [email protected])
b
São Paulo State University, Department of Cartography, Presidente Prudente, SP, Brazil - [email protected] c Ceará Federal University, Department of Agricultural Engineering, Fortaleza, CE, Brazil - [email protected]
KEY WORDS: Brazilian inland waters, Amazon Floodplain Lake, bio-optical dataset, Inherent and Apparent optical measurements,
Diffuse attenuation coefficient.
ABSTRACT:
This work presents ongoing efforts and preliminary results for building a dataset that represents the first and most comprehensive bio-optical information available on Brazilian inland waters to support the development of remote sensing algorithms for monitoring aquatic systems. From 2012 to 2014 optical and limnological data was gathered along thirteen field campaigns in five Brazilian reservoirs, in an irrigation and domestic water supply reservoir located in semi-arid northeast of the country and in Amazonian floodplain lakes, thus covering the diversity of Brazilian inland waters. At each site 20 stations, on average, were sampled to acquire profiles of the following optical variables: absorption, attenuation, scattering, and backscattering coefficients and radiances/irradiances spectra above and in-water. Alongside these measurements, water samples were collected for determining concentrations of chlorophyll-a (Chl-a), Total Suspended Solid (TSS), Total Dissolved Carbon (TDC) and its organic/inorganic fractions, CDOM absorption, phytoplankton specific absorption [aph*] and Non-Algal Particles absorption [aNAP*]. Preliminary results show that Chl-a concentrations ranged from 0.6 to 243µg/L in reservoirs and 0.90 to 92µg/L in Amazonian lakes, while TSS concentrations ranged from 0.3 to 31mg/L in reservoirs and 0.5 to 162mg/L in Amazonian lakes. In situ beam attenuation coefficients ranged from 1.4 to 16m-1 in reservoirs and 12.5 to 38m-1 in Amazonian lakes, while diffuse attenuation coefficients of downwelling irradiance over the Photosynthetically Active Radiation (Kd(PAR)) extended from 0.35 to 4.5m-1 in reservoirs and 1.69 to 13.30m-1 in Amazonian lakes. Our research group is building this dataset anticipating future demands for algorithm validation regarding OLI/Landsat8 data and ESA Sentinel missions to be launched as of 2015.
* Corresponding author. [email protected].
1. INTRODUCTION
Water is a natural resource essential to life. Water is also essential for economic development and social welfare, since economic growth depends on the water availability of the nations. Nearly 12% of available fresh water for use on Earth passes through the Brazilian territory. Due to this water availability, Brazil has an enormous number of natural and artificial aquatic systems of large dimensions. Estimates point out the existence of more than 8,000 lakes larger than one hectare in the Amazonian floodplain, of which less than 1% has been effectively studied. The area flooded by the 150 largest Brazilian hydroelectric reservoirs is approximately 45 103 km2.
If on the one hand this availability of water resources puts Brazil in a fortunate position, on the other, it represents a challenge regarding their monitoring and sustainable use. For example, environmental impacts and in particular the net carbon budget in Brazilian reservoirs are not well known and need to be determined and monitored, because besides renewable energy, it is also important, to have clean energy sources. The Amazon Basin and its aquatic systems, due to their dimensions and biodiversity, affect and are affected by global and regional processes. Recent predictions about the effects of climate change in the Amazon region suggest an increase in temperature, frequency and intensity of extreme events (droughts and floods), with various consequences for local biota
and biogeochemistry (Foley et al 2002. Malhi et al., 2008; Marengo et al, 2011).
The water masses composition is directly related to the functioning of ecological and biogeochemical processes in aquatic systems, since the composition acts as an index of light availability for photosynthesis and nutrient availability; in addition, water lake and rivers composition responds to the anthropogenic impacts in the drainage basin. Thus, water masses composition can be used as a "proxy" for monitoring these aquatic systems. Biogeochemical properties of these aquatic systems, among other factors, affect the carbon budget, since they influence sources and sinks of greenhouse gases. Water bio-optical properties can be used as important surrogates of some biogeochemical properties of aquatic systems, helping to get a better understanding of the underlying processes controlling those properties. However, given the number and size of these systems and the continental dimension of Brazil, national scale studies and monitoring are only feasible using remote sensing methods.
2010, Barbosa&Novo, 2013; Montanher, et al. 2014; Lopes, et al. 2014; Augusto-Silva et al. 2014). These studies allowed characterizing patterns of water masses composition, without however describing, analyzing and characterizing the spectral composition of the underwater light field, key information, for instance, for estimating the primary productivity in aquatic environments. Empirical models, however, have time and space limits of application requiring many calibration field campaigns, since the models are only valid for the data set for which they were developed.
To take full advantage of remote sensing technology for studying and monitoring Brazilian aquatic system, we need a comprehensive biotic characterization of those systems, which requires the gathering of data such as: profiles of inherent optical properties – IOPs (coefficients of absorption, attenuation, scattering and backscattering), determination of Total Particulate (TP), phytoplankton (ph) and Non-Algal Particles (NAP) specific absorption coefficients, spectral Coloured Dissolved Organic Matter absorption (aCDOM( )), measurements of apparent optical properties - AOPs (remote sensing reflectance, diffuse attenuation coefficient, average cosine), determination of optical active constituents concentrations, and measurements of limnological parameters (dissolved oxygen, pH, turbidity, conductivity, etc.).
The availability of these parameters make it possible to develop analytical models which provide not only concentration estimates of optically active components (OAC) of water, but also information on underwater light field, euphotic zone depth and diffuse attenuation coefficients which are essential for understanding the functioning of aquatic ecosystems. Analytical models also pave the way to systematic operational monitoring of aquatic systems using Earth observation satellite data, as they reduce model calibration and validation cost. Therefore, the first step in the development of analytical models is to build a comprehensive bio-optical dataset of Brazilian water bodies, covering a wide range of properties under a wider range of
environments. Aiming to build this database, in the past few years, our research group has invested not only in surveying and specifying state-of-art in-water sensors, but also in actively seeking the means for acquiring hydrologic optics instruments. We also invested in training new members of team in the equipment operation and data processing as well as in the theoretical framework for the development of analytical models. This effort culminated in creating the Aquatic System Research Instrumentation Laboratory (http://www.dsr.inpe.br/labisa/). In the last three years a large number of field campaigns have been carried out in several hydroelectric reservoirs and lakes of the Amazon floodplain to gather data.
In this paper we present the preliminary results of this dataset which is the first and most comprehensive bio-optical information available for the Brazilian inland waters thus giving the grounds for better knowledge of the connections between aquatic system bio-optical properties and carbon budget as well as of the anthropogenic impacts on bio-optical properties. Moreover, this dataset is being considered by our research group as preparation for algorithm validation, of OLI/Landsat 8 data and ESA Sentinel missions scheduled to be launched from 2015 on.
2. MATERIAL AND METHODS
2.1 Sampling sites
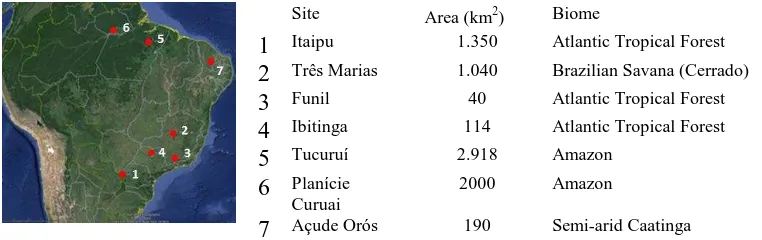
The sampling sites comprise five hydroelectric reservoirs, located in different geographical regions of Brazil, a dam in the northeast of Brazil and lakes in Amazonian floodplain, covering a wide range of Brazilian inland water types. The sampled sites ranged from clean to highly eutrophic reservoir waters and Amazonian lakes with high turbidity. Figure 1 shows locations, names and flooded area of the sampled water systems.
Site Area (km2
) Biome
1
Itaipu 1.350 Atlantic Tropical Forest2
Três Marias 1.040 Brazilian Savana (Cerrado)3
Funil 40 Atlantic Tropical Forest4
Ibitinga 114 Atlantic Tropical Forest5
Tucuruí 2.918 Amazon6
Planície Curuai2000 Amazon
7
Açude Orós 190 Semi-arid CaatingaFigure 1. Geographical location sampling sites
Itaipú Hydroelectric Reservoir (ITHR) is located in South of
Brazil (-24.08º to -25.55º and -54º to -54.62º). ITHR dam was built between 1974 and 1984 by damming the Paraná River in Paraná state and flooded 1.350km2 of the Tropical Atlantic Forest biome of which 625 km2 is in Brazil and 835km2 in Paraguay. The reservoir has an average depth of 21 m and a maximum depth of 170 m (Agostinho et al., 1999). Retention time is about 40 days and discharge about 8.200m3 s-1.
Três Marias Hydroelectric Reservoir (TMHR) is located in the
Funil Hydroelectric Reservoir (FHR), whose operation began in meters and residence time varying from 10 to 50 days according to the season (Furnas, Branco et al., 2002). The catchment basin of FHR drains one of the most industrialized areas of Brazil, which contributes to water quality degradation, including algal blooming is observed all year long.
Ibitinga Hydroelectric Reservoir (IBHR) is located in Southeast
of Brazil (-21.75º and -48.98º) in the central region of São Paulo State. IBHR is part of Tietê River dam complex, formed by seven reservoirs of which IHR is the third from upstream to downstream. It extends 70 km along Tietê River and has long-term rising of the reservoir´s trophic level due to inputs of urban sewage and sugarcane and citrus crop.
Tucuruí Hydroelectric Reservoir (THR) is located in the
northern of Brazil (-3.72º to -5.25º and -49.2º to -50º), in the Amazon basin. It was flooded by damming the Tocantins River in Pará state. THR dam was built between 1976 and 1984, when the Tocantins river water filled a surface of around 2635 Km2 burying a vast area of tropical forest (Fearnside, 1999). The THR has an elongated dendritic shape with major axis 150 km long, and a maximum width of nearly 18 km. THR has an average depth of 28 m and the maximum depth reaches 102 m near the dam. The average hydraulic residence of reservoir water is 51 days (Fearnside, 2001).
Curuai Foodplain (CF) lies on the southern margin of the
Amazon River near Óbidos in Pará State (-2.23º and -55.34º), about 900 km upstream the Atlantic Ocean. CF is sedimentary plain formed by a complex system of about 30 interconnected shallow lakes, linked to the Amazon River by several channels. The dynamics of flooding in CF are related to the seasonal fluctuations of the Amazon River, presenting an annual monomodal pattern (Junk et al. 1989) with a minimum water level during early November, nearly to 400 cm above sea level and a maximum of 1100 cm between late May and early June. During the rising water stage, Amazon River water flows into the floodplain collapsing the set of lakes into an unique large water body covering nearly 2.500 km2 (Barbosa 2005). The seasonal fluctuations in the water level varies between 500 cm and 700 cm, and interannual amplitude is as large as 160 cm. During low water stage the average depth of the floodplain lakes is λ0 cm favoring fine deposited sediments to be resuspended by wind. As consequence of the seasonal fluctuation in the water level, the floodplain waters undergo into a large range of suspended sediment and chlorophyll concentrations.
Orós dam (OD) was built in the Upper Jaguaribe river basin to
replace its intermittent water flow for perennial flow in order to provide water for the Fortaleza Metropolitan Area. The OD was completed in 1961 flooding an area of 190 km2 in the savanna biome (Cerrado).
2.2 Measured Variables and Sampling Methodology
The in situ variables that compose our dataset were defined taking as reference the ones listed on chapter 2 (Table 2.1) of NASA/TM-2000-209966 document, although restricted to equipment availability at each field campaign. The NASA document describes key in situ variables to be measured or derived from measurements for satellite ocean color sensor validation, algorithm development and algorithm validation. The variables were classified into three categories of descending priority: required, highly desired, and derived.
Sampling methods and data processing and documentation was kept the same for all sites (lakes and reservoirs). Due to the spectrally distinct water masses previously identified in the site. During a six to eight day campaign in each site, water samples were collected concurrently with water column profiles using an absorption/attenuation meter, a set of up to six inter-calibrated spectroradiometers, a backscattering meter, a CTD, a Secchi disk and a probe with sensors of pH, turbidity, and dissolved oxygen.
2.3 Optically active constituents determination (OAC)
Water samples were collected at subsurface (0.2 m depth) and kept light free and cooled for a maximum of 4 hours before being vacuum-filtered through Whatman GF/F 0.7 m pore size filters for determination of Chl-a and pheophytin (Feo) concentrations, based on Nusch (1980). Water samples were also filtered through pre-weighed and pre-ignited GF/C filters for analyses of Total Suspended Solid (TSS) (total, inorganic, and organic fractions) based on Wetzel (1991). Infrared gas method using a Total Organic Carbon analyzer (Shimadzu, TOC-5000) with high temperature combustion (Vlahos, Chen, & Repeta, 2002) was applied to measure the concentration of Dissolved Total Carbon (DTC) and its organic (DOC) and inorganic (DIC) fractions. All determinations were done in replica.
2.4 CDOM and specific absorption spectral coefficients
Spectral absorption coefficients were determined using dual beam UV-2600 Shimadzu spectrophotometer, scanning from 300 to 800 nm with 1 nm increment. For CDOM absorption coefficients (aCDOM( )), water samples were filtered through a Whatman GF/F 0.7 m pore size filter and then by a 0.22 m pore size polycarbonate filters (Millipore). The samples were stored in amber Qorpak bottles, previously cleaned and sterilized, and kept cold until laboratory measurements. Optical density (OD) was measured using Fresh Milli-Q water as reference. Samples were kept at room temperature during analysis to avoid temperature effects. The aCDOM( ) was calculated from the measured optical density of the filtrate sample (ODs( )) according to Eq. 1 (Tilstone et al., 2002).
�� =2.303 � � − � (1)
CDOM can be assumed to be zero, in this case, the average over 700-800 nm.
Total Particulate absorption (aTP) was measured using the Transmittance-Reflectance quantitative technique (Tassan, 2002), where reflectance and transmission measurements were taken using the dual-bean UV-2600 Shimadzu spectrophotometer coupled with an integrating sphere. TP optical density (ODTP) was measured between 300 nm and 800 nm at 1 nm intervals, with a blank filter saturated with Fresh Milli-Q water as a reference. Pigmented matter was then bleached for 5 to 20 min with 5 mL of a 10% sodium hypochlorite solution before being rinsed with distilled water prior to re-scanning. It has already been demonstrated that bleaching using sodium hypo-chlorite oxidizes phytoplankton pigments faster than other particulate organic matter enabling the separation of their absorption signals (Ferrari & Tassan, 1999). Therefore, Non-Algal Particles (NAP) absorption fraction (ODNAP) will include unbleached organic detritus (Organic NAP) and mineral sediments (Inorganic NAP).
The Total Particulate absorption (aTP( )) and NAP absorption aNAP( ) were converted from OD to absorption coefficients (m-1) following equation (2):
� =2.303� � � (2)
Where R is the ratio of the filtered volume to the filter clearance area in meters and x is the component (TP or NAP). The difference between aTP( ) and aNAP( ) leads to the absorption due to phytoplankton pigments aph( ) (aph( ) = aTP( ) - aNAP( )). Total Laboratory Absorption was calculated as the sum of Total Particulate and CDOM absorptions (aTLab( ) = aTP( ) + aCDOM( )).
2.5 Inherent optical property measurements
At each reservoirs sampling station, profiles of attenuation c( ) and absorption a( ) coefficients were acquired with a 25 cm pathlength Spectral Absorption and Attenuation meter (AC-S WetLabs Inc.), whereas in lakes of Amazon river floodplain, due to attenuation larger than 20 m-1, a 10 cm pathlength AC-S meter was used. To prevent air bubbles, measurements started from the limit of euphotic zone towards the subsurface. Two profiles with spectral resolution of 4 nm between 400 and 750 nm were acquired at each station. The AC-S meters were set to a sample rate of 4 Hz.
Both AC-S measurements, attenuation and absorption coefficients, were corrected for temperature dependency along the wavelengths (Pegau et al., 1997). Absorption coefficient overestimation (Zaneveld et al., 1994; Tzortziou, 2004) was corrected using the proportional method (Zaneveld et al., 1994) as follows:
� = � − � ∗ �
� (3)
Where, ac(λ) is the corrected absorption coefficient, amts(λ) the absorption coefficient corrected for temperature, amts(λr) the absorption coefficient corrected for temperature at a reference wavelength, bm the scattering coefficient and bm(λr) the scattering coefficient at the reference wavelength.
The spectral scattering profiles were obtained, by subtracting the absorption coefficient from the attenuation coefficients [b( ) = c( )– a( )].
Profiles of volume scattering function (VSF) measured at six wavelengths (420, 442, 470, 510, 590, 700nm) and at 140º angle β(1400) using a HydroScat-6 instrument (HOBI Labs), were converted to backscattering coefficient (bb) profiles, as follows:
= 2���(140º)− � (140º) + (4)
Where, βw(1400) is the volume scattering function of pure water, bbw the backscattering coefficient of pure water and χ is a non-dimensional variable relating β(1400) to bb. The value χ =1.08, recommended in the user’s manual (HOBI Labs, 2010), was then adopted, even though χ can vary according to acquisition angle (Boss & Pegau, 2001) and environmental conditions. Underestimation of backscattering values, in Case II waters, due to high attenuation along the optical path of the instrument, were corrected as described in Carvalho et al. 2014.
2.6 Apparent optical property measurements
A package of six inter-calibrated Ramses (TriOS) spectroradiometers (320 to λ50nm; wavelength resolution ≈ 3.3nm) was used to acquire above and in-water radiances/irradiances following Ocean Optical Protocols (Mueller et al., 2003). Three spectroradiometers were mounted in an underwater open cage for profiling downwelling irradiance Ed(z,), upwelling irradiance Eu(z,) and upwelling radiance Lu(z,). The three remaining sensors were set up on the boat for measuring surface incident irradiance Esky(), water-leaving Lw(,z,) and diffuse sky Lsky() radiances.
At each sampling station, the cage was lowered from subsurface up to the depth in which the Ed(550) reached ~1% of its subsurface value, stopping every meter in reservoirs and every 0.3 meter in Amazon lakes for measurements. To minimize wave focusing and defocusing effects and obtain representative underwater light field measurements, ten scans were taken at each stop concurrently with IOP measurements (AC-S and HydroScat). To minimize boat-shading and sun glint effects, deployments were always oriented to the sunny side of the boat and Lw measurements were taken in an azimuth between 90 and 135º in relation to the sun and zenith angle of 45° (Mueller et al., 2002). Lsky was measured in the same plane but with rotation of the mounting pole ~45° upward from nadir (Mobley, 1999).
3. RESULTS AND DISCUSSION
The parameters acquired along field campaigns carried out between 2012 and 2014 compose the bio-optical dataset of the Brazilian inland waters listed in Table 1. As shown in Table 1, not all parameters were measured in every aquatic system due to initial lack of equipment or equipment failure.
systems. So, additional sampling campaigns are required in order to capture all the variability in the selected parameters.
Table 1. Summary of measurements in field campaigns between 2012 and 2014 in six selected sites. [Te] temperature; [Co] conductivity; [Tu] Turbidity; [OD] Dissolved Oxygen; [FRB] Bidirectional reflectance factor; [Es] incident surface irradiance; [Ed, Eu] downwelling and upwelling irradiance in the water column; [Lw] water-leaving radiance; [Lu] upward radiance during profile; c = total attenuation; a = total absorption; b = total scattering; bb = total backscattering coefficient; [Chl-a] chlorophyll; [TSS] Total Suspended Matter; [TIS] Total Inorganic Solids; [TOS] Total Organic Solids; [DOC] Dissolved Organic Carbon; [DIC] Dissolved Inorganic Carbon; [CDOM] Coloured Dissolved Organic Matter; [aph*] = phytoplankton-specific absorption coefficient; [aTP*] total
particulate specific absorption coefficient; [aNAP*] = Non-Algal Particles-specific absorption coefficient.
Site Field
Campaigns Date
Number of
Stations Measured Variables
1 Tucuruí 1 2012/11/24 - 29 28
Probe profiles (Te,Co,pH,OD); POI profiles (c,a,b) POA Profiles (Es,Ed,Lw,Lu)
COA (Chl-a,TSS,TSI,TSO, DOC, DIC)
2 Três
Marias 1 2013/06/17 - 22 22
Probe profiles (Te,Co,pH,OD); POI profiles (c,a,b,bb) POA Profiles (Es,Ed,Lw,Lu,Eu,Esky)
COA (Chl-a,TSS,TSI,TSO, DOC,DIC, CDOM)
3 Funil 1 2014/08/11 - 14 16
Probe profiles (Te,Co,pH,OD); POI profiles (c,a,b,bb) POA Profiles (Es,Ed,Lw,Lu,Eu,Esky)
COA (Chl-a,TSS,TSI,TSO, DOC,DIC, CDOM) Specific coefficients (aph*, aNAP*, aTP*) Two thermistor chains in the water column A portable meteorological station (wind, rain)
4 Ibitinga 6
2013/02/11 (2014) /02/06 &/03/26 & /05/13 &
/07/16 & /09/18
4
Probe profiles (Te,Co,pH,OD);Perfis POI(c,a,b, bb) POA Profiles (Es,Ed,Lw,Lu,Eu,Esky)
COA (Chl-a,TSS,TSI,TSO, DOC,DIC, CDOM) Specific coefficients (aph*, aNAP*, aTP*)
5 Itaipu 1 2013/03/11 - 21 22
Probe profiles (Te,Co,pH,OD); Perfis POI (bb) POA Profiles (Es,Ed,Lw,Lu)
COA (Chl-a,TSS,TSI,TSO, DOC,DIC)
6
Planíci e Curuai
3
2013/02/02 - 07 2013/08/11 - 18 2014/04/09 - 15
32
Probe profiles (Te,Co,pH,OD);Perfis POI(c,a,b,bb) POA Profiles (Es,Ed,Lw,Lu,Eu,Esky)
COA (Chl-a,TSS,TSI,TSO, DOC,DIC, CDOM) Specific coefficients (aph*, aNAP*, aTP*)
7 Orós 8
03&06&08&11/201 1 02&05&08&12/201
2
20 COA (Chl-a,TSS,TSI,TSO, DOC,DIC) POA above water (FRB)
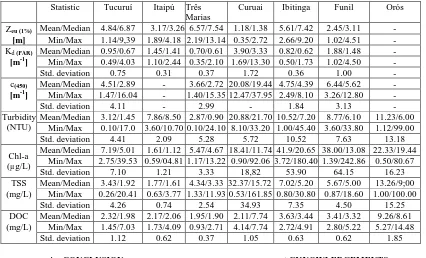
Although new sampling campaigns are needed, Table 2 indicates a wide diversity range of the Brazilian inland water masses. In hydroelectric reservoirs, the chl-a concentration ranged from 0.59 to 243µg/L, with the highest concentrations in Funil and Ibitinga reservoirs, which are located in the southeast of Brazil, in a densely populated area with a high concentration of industries (Funil) or intense agriculture (Ibitinga). The median of ch-a concentration values in Funil and Ibitinga was 8.13 and 20.65 µg/L respectively, indicating that those reservoirs can be classified as mesotrophic and eutrophic, respectively. In Tucuruí, Itaipu and Três Marias median values of ch-a concentration were 5.01, 1.12 e 4.67µg/L respectively. Those values are on average between 200 to 1850% lower than those of Funil and Ibitinga. It is important to point out, however, that Ibitinga was sampled from summer to winter (Table 1) whereas in the remaining reservoirs the data were collected in just one season. At Curuai floodplain lakes, where water was sampled in three different phases of the hydrography, chl-a concentration ranged from 0.90 to 92 µg/L, with a median value of 11.74 µg/L.
Attenuation coefficients (C(450) and KdPAR) followed the concentration results found for limnological parameters. The
analysis of median values suggests that in Funil and Ibitinga reservoirs, C(450) and Kd PAR are mainly driven by chlorophyll concentration, showing that absorption prevails as the dominant IOP. In the Curuai floodplain chlorophyll and TSM presents dominant values however, scattering plays a major hole in attenuation due to the high percentage of inorganic components. Tucurui and Tres Marias reservoirs have lower C(450) also driven by low TSM and chlorophyll values but DOC values are similar, and could lead to similar CDOM absorption coefficient.
The euphotic zone followed Kd values and showed Marias Reservoir and Curuai in opposite extremes. Funil and Itaipú presented similar Kd values indicating that chlorophyll concentration (in Funil) was not as significant as TSS and DOC for Kd (PAR). The effect of chlorophyll can also be noted in the maximum values for Curuai and Funil reservoirs. The maximum of chlorophyll in Funil (242.86 µg/L) do not increase the maximum of C(450) (12.80 m-1) as in the case of Curuai Floodplain, were the effect of TSS increase significantly the value of C(450) (37.95 m-1).
rate is essential for removing outliers (noises) that occur during acquisition. Data processing based on Excell spreadsheet proved inefficient being time consuming and prone to errors. Since the bio-optical dataset is planned to grow along time, we decided to develop a set of Matlab (MathWorks) routines for automating the standard processing routines such as: i) AC-S temperature correction; ii) scattering corrections in AC-S absorption tube; iii) Volume Scattering Function at 140º to backscattering coefficient bb; iv) filtering spurious values. The advantage of having a unique set of routines for processing the
measurements of all sites is that all data on the dataset is comparable.
These routines are under development and have already been tested on data collected in each of the sites. The consistency analyses are still under way. We are also making an effort to adapt data correction protocols developed to oceanic environments (McKee & Cunningham, 2005; McKee et al., 2008; Leymarie et al., 2010, Doxaran at al., 2009; McKee et al., 2013; Röttgers, et al., 2013) to inland waters, which are optically complex.
Table 2. Descriptive statistics of some bio-optical properties of Brazilian inland aquatic systems:, Zeu (1%) = lower limit of the euphotic zone, Kd (PAR) = vertical attenuation coefficient for downwards irradiance of PAR (Photosynthetically Available Radiation),
c(450) = beam attenuation coefficient in 450 nm, Chl-a = chlorophyll-a, TSS = Total Suspended Solid, DOC = Dissolved Organic Carbon.
Statistic Tucuruí Itaipú Três Marias
Curuai Ibitinga Funil Orós
Zeu (1%)
[m]
Mean/Median 4.84/6.87 3.17/3.26 6.57/7.54 1.18/1.38 5.61/7.42 2.45/3.11 - Min/Max 1.14/9,39 1.89/4.18 2.19/13.14 0.35/2.72 2.66/9.20 1.02/4.51 - Kd (PAR)
[m-1]
Mean/Median 0.95/0.67 1.45/1.41 0.70/0.61 3.90/3.33 0.82/0.62 1.88/1.48 - Min/Max 0.49/4.03 1.10/2.44 0.35/2.10 1.69/13.30 0.50/1.73 1.02/4.50 -
Std. deviation 0.75 0.31 0.37 1.72 0.36 1.00 -
c(450)
[m-1]
Mean/Median 4.51/2.89 - 3.66/2.72 20.08/19.44 4.75/4.39 6.44/5.62 - Min/Max 1.47/16.04 - 1.40/15.35 12.47/37.95 2.49/8.10 3.26/12.80 -
Std. deviation 4.11 - 2.99 - 1.84 3.13 -
Turbidity (NTU)
Mean/Median 3.12/1.45 7.86/8.50 2.87/0.90 20.88/21.70 10.52/7.20 8.77/6.10 11.23/6.00 Min/Max 0.10/17.0 3.60/10.70 0.10/24.10 8.10/33.20 1.00/45.40 3.60/33.80 1.12/99.00
Std. deviation 4.41 2.09 5.28 5.72 10.52 7.63 13.18
Chl-a (µg/L)
Mean/Median 7.19/5.01 1.61/1.12 5.47/4.67 18.41/11.74 41.9/20.65 38.00/13.08 22.33/19.44 Min/Max 2.75/39.53 0.59/04.81 1.17/13.22 0.90/92.06 3.72/180.40 1.39/242.86 0.50/80.67
Std. deviation 7.10 1.21 3.33 18,82 53.90 64.15 16.23
TSS (mg/L)
Mean/Median 3.43/1.92 1.77/1.61 4.34/3.33 32.37/15.72 7.02/5.20 5.67/5.00 13.26/9;00 Min/Max 0.26/20.41 0.63/3.77 1.33/11.93 0.53/161.85 0.80/30.80 0.87/18.60 1.00/100.00
Std. deviation 4.26 0.74 2.54 34.93 7.35 4.50 15.25
DOC (mg/L)
Mean/Median 2.32/1.98 2.17/2.06 1.95/1.90 2.11/7.74 3.63/3.44 3.41/3.32 9.26/8.61 Min/Max 1.45/7.03 1.73/4.09 0.93/2.71 4.14/7.74 2.72/4.91 2.80/5.22 5.27/14.48
Std. deviation 1.12 0.62 0.37 1.05 0.63 0.62 1.85
4. CONCLUSION
Due to the Brazilian continental dimensions and the diversity of its water bodies, this work should be seen as an initial step of a medium to long-term activity that paves the way for analytical models development for studying and monitoring Brazilian inland waters, since it will allow the construction of a comprehensive bio-optical dataset that embraces the breadth and complexity of these waters. Considering that this dataset will expand with insertion of new data gathered in the sites listed above and in new ones, it is essential to keep the same systematic, following international protocols for data acquisition and processing (Muller, 2003) as well asfor development and validation of algorithms for monitoring aquatic environments using remote sensing. However, it is noteworthy that these protocols developed for use in oceanic waters need to be adapted and validated to the diversity of Brazilian inland waters. Another key factor for data quality is training the staff involved in the acquisition and processing of data. Moreover, this dataset is being handled by our research group as an anticipation of future data demands for algorithms validation, considering available OLI/Landsat 8 data and the ESA Sentinel missions scheduled to be launched in 2015.
ACKNOWLEDGEMENTS
We wish to thank the Brazilian Electricity Regulatory Agency (ANEEL grant nº 8000003629), São Paulo Research Foundation (FAPESP grants 2008/56252-0; 2011/23594-8; 2011/19523-8), National Counsel of Technological and Scientific Development (CNPq 552490/2011-3; 471223/2011-5), National Institute of Science and Technology (INCT) on Climate Change (CNPq-PROCAD grant 573797/2008-0), Brazilian National Institute for Space Research (INPE)for financial support for equipment acquisition and fields campaigns. Dra. Aurea Ciotti from Center for Marine Biology (USP–CEBIMar) for assistance with analysis. We are also grateful to Carlos Araújo, Joaquim Leão Pétala Bianchi, Daniel Schaffer and Marcelo Curtarelli for fieldwork assistance
REFERENCES
Augusto-Silva, P.B., Ogashawara, I., Barbosa, C.C.F., Carvalho, L.A.S., Jorge, D.S.F., Fornari, C.I., Stech, J.L. 2014. Analysis of MERIS Reflectance Algorithms for Estimating Chlorophyll-a Concentration in a Brazilian Reservoir. Remote Sensing, v. 6, p. 11689-11707.
Barbosa, C.C.F., 2005. Sensoriamento remoto da dinâmica de circulação da água do sistema planície de Curai/Rio Amazonas. 286 p. (INPE-14614-TDI/1193). Tese (Doutorado em Sensoriamento Remoto) - Instituto Nacional de Pesquisas Espaciais, São José dos Campos.
Barbosa, C.C.F; Novo, E. M. M. 2009. Remote sensing of the water properties of the Amazon floodplain lakes: the time delay effects between in-situ and satellite data acquisition on model accuracy. In: 33rd International Symposium on Remote Sensing of Environment: Sustaining the millennium Development Goals, 2009, Stressa. Proceedings of the 33rd ISRSE, Stresa.
Barbosa, C.C.F., Novo, E.M.L.M., Melack, J.M., Gastil-Buhl, M. 2010. Geospatial analysis of spatiotemporal patterns of pH, total suspended sediment and chlorophyll-a on the Amazon floodplain. Limnology, 11(2):155-166, doi:10.1007/s10201-009-0305-5.
Barbosa, C.C.F., Novo, E.M.L.M. Mapping Chlorophyll in The Amazon FloodPlain Lakes with MERIS Images. 2013. Procedings of ESA Living Planet ESA 2013 http://www.livingplanet2013.org/abstracts/847490.htm. <http://mtc-m21b.sid.inpe.br:80/rep/sid.inpe.br/mtc-m21b/2014/09.28.19.41>.
Boss, E., & Pegau, S., 2001. Relationship of light scattering at an angle in the backward direction to the backscattering coefficient. Applied Optics, 40(30), 5503–5507.
Branco C.W.C., Rocha M.I.A., Pinto G.F.S., Gômara G. & De Filippo R. 2002. Limnological features of Funil Reservoir (R.J., Brazil) and indicator properties of rotifers and cladocerans of the zooplankton community. Lakes Reserv. Res. Manage. 7, 87–92
Carvalho, L.A.; Barbosa, C.C.F.; Novo, E.M.L.M., Rudorff, C.M. 2015. Implications of scatter corrections for absorption measurements on optical closure of Amazon floodplain lakes using the Spectral Absorption and Attenuation Meter (AC-S-WETLabs), Remote Sensing of Environment 157 123–137. Doxaran, D., Ruddick, K., McKee, D., Gentili, B., Tailliez, D., Chami, M., & Babin, M. 2009. Spectral variations of light scattering by marine particles in coastal waters, from the visible to the near infrared. Limnology and Oceanography, 54(4), 1257–1271. doi:10.4319/lo.2009.54.4.1257
Fearnside, P.M. 2001. Environmental impacts of Brazil's Tucuruí Dam: Unlearned lessons for hydroelectric development in Amazonia. Environmental Management 27(3): 377-396. Doi: 10.1007/s002670010156.
Fearnside, P. M. 1999. Social Impacts of Brazil's Tucuruí dam. Environmental Management, v. 24, p. 485-495.
Ferrari, G.M., and Tassan, S., 1999. A method using chemical oxidation to remove light absorption by phytoplankton pigments. Journal of Phycology., 35, 1090–1098.
Foley, J. A.; Botta, A. ; Coe, M. T. ;. Costa. M. H El Niño– Southern oscillation and the climate, ecosystems and rivers of Amazonia, Global Biogeochem. Cycles, 16(4): 1132, 2002.
Furnas. Sistema Furnas de Geração e Transmissão. http://www.furnas.com.br/
hotsites/sistemafurnas/usina_hidr_funil.asp
Junk,W.; Bayley , P. B. ; Sparks, R. E. 1989. The flood pulse concept in river floodplain system. Spec. Publ. Can. J. Fish. aquat. Sci.;106: 110–127.
Leymarie, E., D. Doxaran & M. Babin, 2010. Uncertainties associated to measurements of inherent optical properties in natural waters. Applied Optics 49:5415-5436.
Lobo, F.L., Novo, E.M.L.M., Barbosa, C.C.F., Galvão, L.S. 2011. Reference spectra to classify the Amazon water types. International Journal of Remote Sensing (Print), v. 23, p. 3422-3442.
Lobo, F.L., Barbosa, C.C.F., Novo, E.M.L.M., Yunes, J.S., 2009. Mapping potential cyanobacterial bloom using Hyperion/EO-1 data in Patos Lagoon estuary. Acta Limnologica Brasiliensia, v. 21, n. 3, p. 299-308.
Lopes, F.B., Barbosa, Cláudio C.F., Novo, E.M.L.M., Andrade, E.M.; Chaves, L.C.G., 2014. Modelagem da qualidade das águas a partir de sensoriamento remoto hiperespectral. Revista Brasileira de Engenharia Agrícola e Ambiental (Online), v. 18, p. 13-19.
Malhi, Y.; Roberts, J.T.; Betts, R.A.; Killeen, T.J., Li, W., Nobre, C.A. 2008 Climate change, deforestation, and the fate of the Amazon. Science 319, 169-172.
Marengo, J.A., Tomasella, J., Soares, W. R., Alves, L.M., Nobre, C.A. 2011 Extreme climatic events in the Amazon basin. Climatological and hydrological context of recent floods. Theoretical and Applied Climatology.
McKee, D., Cunningham, A., 2005. Evidence for wavelength dependence of the scattering phase function and its implication for modeling radiance transfer in shelf seas. Applied Optics, 44(1), 126.
McKee, D., Piskozub, J., & Brown, I., 2008. Scattering error corrections for in situ absorption and attenuation measurements. Optics Express, 16(24), 19480–92.
McKee, D., Piskozub, J., Röttgers, R., & Reynolds, R. a. 2013. Evaluation and Improvement of an Iterative Scattering Correction Scheme for in situ Absorption and Attenuation Measurements. Journal of Atmospheric and Oceanic Technology, 30(7), 1527–1541.
Mobley, C.D., 1999. Estimation of the remote-sensing reflectance from above-surface measurements. Applied Optics, 38(36), 7442–7455.
Montanher, O.C., Novo, E.M.L.M., Barbosa, C.C.F., Renno, C.D., Silva, T.S.F., 2014. Empirical models for estimating the suspended sediment concentration in Amazonian white water rivers using Landsat 5/TM. International Journal of Applied Earth Observation and Geoinformation 29 67–77
color sensor validation, revision 4, volume III: Radiometric measurements and data analysis protocols NASA/TM-2002 — Ocean optics protocols for satellite ocean color sensor validation, revision 4, volume II, III (January).
Mueller, J.L., Pegau, S., Zaneveld, J.R.V., Mitchell, B.G., Kahru, M., & Wieland, J., 2003. Ocean optics protocols for satellite ocean color sensor validation, revision 4, volume IV: Inherent optical propertiesμ Instruments, characterizations, field measurements and data analysis protocols NASA/TM-2003-211621/Rev4-Vol. IV ocean optics.
NASA/TM-2000-209966 - Ocean Optics Protocols for Satellite Ocean Color Sensor Validation. In: Mueller, J. L & Fargion, G. S. (Eds.) (2000).
Novo, E.M.L.M., Barbosa, C.C.F., Freitas, R.M.D., Shimabukuro, Y.E., Melack, J.M., Filho, W.P. 2006. Seasonal Changes in chlorophyll distributions in Amazon floodplain lakes derived from MODIS images. Limnology, 7:153-161.
Nusch, E.A., 1980. Comparison of different methods for chlorophyll and pheopigment determination. Archives of Hydrobiology Bulletin (Ergebnisse der Limnologie), v.14, p.14-36.
Pegau W.S., D. Gray, J.R.V. Zaneveld, J.V., 1997. Absorption and attenuation of visible and near-infrared light in water: dependence on temperature and salinity. Applied Optics 36:6035-6046.
Röttgers, R., McKee, D., and Woźniak, B.S., 2013. Evaluation of scatter corrections for ac-9 absorption measurements in coastal waters. Methods in Oceanography 7, 21-39.
Sippel, S.J., Hamilton, S.K., Melack, J.M. 1992 Inundation area and morphometry of lakes on the Amazon River floodplain, Brazil. Archiv fur Hydrobiologie. Stuttgart. 123(4):385-400.
Sperling, E.V., 1997. Influência do parâmetro profundidade relativa na qualidade da água de lagos e represas. Anais do 19º Congresso Brasileiro de Engenharia Sanitária e Ambiental, Foz do Iguaçu, 1,p. 30-35.
Tassan, S. 2002. A sensitivity analysis of the “Transmittance -Reflectance” method for measuring light absorption by aquatic particles. Journal of Plankton Research, 24(8), 757–774.
Tzortziou, M., 2004. Measurements and characterization of optical properties in the Chesapeake Bay’s estuarine waters, using in-situ measurements, MODIS satellite observations and radiative transfer modelling. PhD Dissertation, Department of Meteorology, University of Maryland, College Park, MD
Vlahos, P., Chen, R.F., & Repeta, D.J. 2002. Dissolved organic carbon in the Mid-Atlantic Bight. Deep-Sea Research Part II— Topical Studies in Oceanography, 49, 4369–4385.
Wetzel, R.G., Likens, G.E., 1991. Limnological Analyses. New York: Springer Verlag, 429p.