3D DATA ACQUISITION BASED ON OPENCV FOR CLOSE-RANGE
PHOTOGRAMMETRY APPLICATIONS
L. Jurjević a, *, M. Gašparović b
a Faculty of Geodesy, University of Zagreb, Kačićeva 26, Zagreb, Croatia - [email protected]
b Chair of Photogrammetry and Remote Sensing, Faculty of Geodesy, University of Zagreb, Kačićeva 26, Zagreb, Croatia -
Commission II, WG II/4
KEY WORDS: Computer vision, Close-range Photogrammetry, OpenCV, Camera calibration, Stereo matching, 3D reconstruction
ABSTRACT:
Development of the technology in the area of the cameras, computers and algorithms for 3D the reconstruction of the objects from the images resulted in the increased popularity of the photogrammetry. Algorithms for the 3D model reconstruction are so advanced that almost anyone can make a 3D model of photographed object. The main goal of this paper is to examine the possibility of obtaining 3D data for the purposes of the close-range photogrammetry applications, based on the open source technologies. All steps of obtaining 3D point cloud are covered in this paper. Special attention is given to the camera calibration, for which two-step process of calibration is used. Both, presented algorithm and accuracy of the point cloud are tested by calculating the spatial difference between referent and produced point clouds. During algorithm testing, robustness and swiftness of obtaining 3D data is noted, and certainly usage of this and similar algorithms has a lot of potential in the real-time application. That is the reason why this research can find its application in the architecture, spatial planning, protection of cultural heritage, forensic, mechanical engineering, traffic management, medicine and other sciences.
* Corresponding author
1. INTRODUCTION
Development of the technology in the area of cameras, computers and algorithms for 3D reconstruction of the objects from images resulted in increased popularity of the photogrammetry. With development of new, affordable cameras even the price of the photogrammetric survey has dropped. According to the measurement characteristics, cameras can be divided into two categories, metric and non-metric cameras. Although metric cameras have better measurement characteristics, their price is significantly higher. Non-metric cameras, on the other side, are much more affordable and in most cases, are sufficient for the certain application, given that determination of the Internal Orientation (IO) parameters i.e. calibration is carefully done. Algorithms for the 3D model reconstruction are so advanced that non-professionals can make a 3D model of photographed object, even tough in that case accuracy of the model is questionable. That very fact, that it is so easy nowadays to create a 3D model was our motivation for this paper. With minimal expenses, we created stereo system based on the open technology. Our stereo system consists of two Xiaomi Yi (Xiaomi, 2017) cameras, mounted on a plastic frame. Currently on the market, there is considerable amount of commercial software for the 3D reconstruction e.g. Agisoft (Agisoft PhotoScan, 2017), Pix4D Mapper (Pix4D SA,2017) based on the Structure from Motion (SfM) algorithms, so we decided to use open source alternative that is under the constant development, which in this case was the OpenCV. In reference to the photogrammetry, rather than the Computer Vision (CV), OpenCV is mostly mentioned as a tool for camera calibration (Balletti et. al., 2014), and much rarely as a tool for the 3D reconstruction. Even tough various authors examined different application of OpenCV e.g. in traffic (Ducrot et. al., 2011, Uke
and Thool, 2013), integration of stereo vision and the Inertial Measurement Unit (IMU) for navigation purposes (Huh et. al., 2013, Carrillo et. al. 2012), animal behavior analyses (Macfarlane et. al., 2015), augmented reality (Schmidt et. al., 2002) and various other sciences where near real-time or post processing position is needed. The main goal of this paper is to examine the possibility of obtaining 3D data for the purpose of the close-range photogrammetry, based on the open source technologies. This goal is chosen mainly for the sake of archeology in Croatia, where the archaeological artifacts are mostly documented descriptively or with the 2D images (Gajski et. al., 2016). In this paper application of open technology for purposes of the easier obtaining of 3D models is examined. For the purposes of writing this paper we used the OpenCV (version 3.2.0) with Python (version 2.7).
2. SYSTEM DESIGN AND CALIBRATION
The system we used is consisted of two Xiaomi Yi cameras. Xiaomi Yi is the low cost action camera with respectable performance, and is adequate for certain photogrammetric purposes (Gašparović & Gajski, 2016). Cameras were mounted on the solid plastic frame in a way that their optical axes are approximately parallel and fixed, simulating normal case in photogrammetry. The baseline of the stereo system is roughly set to be 10 cm, but real value of the baseline is determined with procedure of so-called stereo calibration. Special attention was given to the procedure of individual calibration of cameras, because of the nature of the stereo calibration. After the individual camera calibration, the stereo calibration with predetermined and fixed IO parameters was performed.
2.1 System Design
A baseline of the stereo systems is in direct correlation with optimal distance of cameras from object of interest. Optimal distance from object of interest is five to ten times of the baseline distance, which in this case means that with baseline of 10cm, this stereo system is optimized to capture and reconstruct objects on distance of 50 cm to 1 m (McGlone, 2013). With the short baseline, the system maintains physical robustness even in the dynamic applications. Nevertheless, this system has its limitations.
2.2 Camera Calibration
With the development of the sensors in the last decade, quality of the cameras on the market improved, as well. Camera calibration is mandatory step in photogrammetric 3D reconstruction. In this paper, a large significance is given to the camera calibration. Xiaomi Yi is the camera with the fisheye ultra wide lens of 155° Field Of View (FOV), and initial tests confirmed that we should use the two step calibration procedure (Gajski & Gašparović, 2015) in order to get sufficient quality of the calibration. The calibration procedure was done according to the model implemented in OpenCV, and presented in the paper A Flexible New Technique for Camera Calibration (Zhang, 2000). This method uses 2D chessboard as a Ground Control Point (GCP) field. Totally 13 images were used for calibration of each camera. During process of the calibration we encountered the problem of OpenCV’s module inability to detect chessboard on image. This problem was solved with the radiometric manipulation on the images in the open source software GIMP (version 2.8.14) (GIMP, 2017), after tests proved that such manipulation doesn’t influence the values of the chessboard detection. OpenCV’s camera calibration module uses pinhole model of the camera and the Brown’s lens distortion model (Brown, 1966). Since the two-step camera calibration method is used, this camera and the distortion model are sufficient, even though this camera has a fisheye lens. The equation (1) represents the image coordinates relieved of the distortion after Brown’s model, where the x and the y are reduced image coordinates, and the r is square radial distance.
For the calibration purposes, we determined all parameters of distortion, 3 parameters (k1, k2, k3) of radial distortion and the
both parameters (p1, p2) of tangential distortion. Reprojection
errors for both cameras were 1.2 pixels. Such a large error is due to photogrammetrical approach to the calibration problem. Calibration chessboard was as close as possible to the edge of the image in order to eliminate the distortion through the whole cadre, and since the distortion has greatest influence on the edges of the image, it increases average reprojection error, which may lead to the misleading conclusions on quality of the calibration. To ensure that the distortion parameters are well determined, visual inspection and another calibration in the Agisoft Lens (version 0.4.2) is done. Visual inspection is done in term of the inspection of the straight lines in the certain images.
2.3 Stereo Calibration
Term “stereo calibration” in the classic photogrammetry doesn’t exist, but in CV it represents procedure of obtaining IO
elements for both cameras and their Relative Orientation (RO). The stereo calibration is calculated based on the image pairs of the calibration field, the spatial resection is calculated and the External Orientation (EO) elements i.e. spatial and rotational elements of both cameras in reference to the chessboard are obtained. With that data, their position in respect to one another is calculated. Task of the stereo calibration is approached with the photogrammetrical point of view. The calibration parameters obtained during the individual camera calibration are used to calculate the undistorted image points of the points on images acquired for the purpose of stereo calibration. The IO elements entered iterative algorithm of stereo calibration as a fixed value, and images used for the stereo calibration covered only middle section of the cadre where distortion model preforms well, in order to provide the best geometry the for the resection, unlike images for the individual camera calibration. The OpenCV’s method for the stereo calibration returns the translation vector and the rotation matrix of the left camera in respect to the right and the fundamental matrix. Rotation and translation vectors are later used for the image rectification, and the fundamental matrix is used for the calculation of epipolar lines. Figure 1. represents the single pair of the images used for the stereo calibration.
Figure 1. Images for stereo calibration.
3. MAIN PRINCIPLES OF STEREO VISION
After the stereo calibration, the RO elements of the cameras are obtained. Considering that the RO elements are known, with the procedure of triangulation it is possible to compute the coordinates of each point in the object space that is visible on both images. The calculated points in the object space would be referenced to the coordinate system of the stereo system. That approach is possible but slow and unpractical for large amount of the points that are required for most uses in close-range photogrammetry. “Normal case” in the stereo photogrammetry is the special case of orientation of the stereo cameras, where only difference in the orientation of stereo cameras is translation in direction of the X axis. Axis Z is directed perfectly to the nadir, which implies that the stereo system is perfectly horizontal. The Y axis is forming right coordinate system. In this special case, every point in the object space has the same y coordinate in both image coordinate systems. Based on the difference of x coordinate i.e. x parallax, distance to the point is calculated. In this special case of the RO, problem of the point correspondence is simplified. This is the ideal case and in practical applications it is not achievable. However, with usage of epipolar geometry and the image transformations it is possible to simulate that special case.
3.1 Epipolar Geometry
Generally, the problem of the identification of the corresponding points is time-consuming process and often leads to the identification of wrong corresponding points. That is a consequence of the uniform pattern objects appearance. In the stereo photogrammetry, that problem is approached with the introduction of the epipolar constraint. Epipolar geometry is The International Archives of the Photogrammetry, Remote Sensing and Spatial Information Sciences, Volume XLII-1/W1, 2017
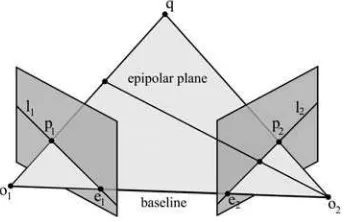
projective geometry between two views (Hartley and Zisserman, 2003). In epipolar geometry, every image point on the first image is manifested as a line on the second image (Figure 2), and somewhere on that line lies the corresponding point of the first point. That is so-called, epipolar constraint.
Figure 2. Epipolar geometry between two images (Yekutieli et. al. 2007)
Epipolar lines from each image are intersecting in one point, i.e. epipole. Equation (2) is expressing epipole for both images, where
e
is epipole and F is fundamental matrix.0
,
0
e
F
e
F
l r (2)By introducing the epipolar constraint, correspondence problem is significantly simplified, instead of the whole image, it is limited to the single line per image point. Equation (3) represents epipolar constraint, where
x
is vector of image point.
x
L TF
x
R
0
(3)For calculation of the epipolar lines fundamental matrix F is used. Calculation of the fundamental matrix can be approached in different ways, based on the calibration data or in case where we don’t have cameras IO and RO information, fundamental matrix is estimated using linear or iterative algorithms (Hartley and Zisserman, 2003). In this research, fundamental matrix is calculated from the calibration data as it gives better results. Epipolar lines are calculated based on the equation (4), where
a
is vector of coefficients of epipolar line.R L
x
x
F
a
,
F
a
R
T L
(4)Epipolar lines of single stereo pair used for calibration can be seen on figure 3.
Figure 3. Epipolar lines on undistorted stereo pair.
The figure 4. the slight convergence of the epipolar lines can be seen. The convergence is not emphasized because the stereo system design is close to the “normal case”.
3.2 Rectification
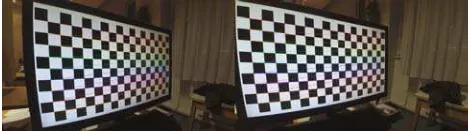
With the image rectification, the problem of the identification of the corresponding points is reduced from two to the one dimension. After the rectification, the epipolar lines of the corresponding points lie in the single row of their images, therefore rectification of the images significantly simplifies identification of corresponding points. Images are rectified by rotating them around their optical centers, by bringing them in the same plane. Quality of rectification is done by visual examination of rectified epipolar lines. In rectified view, epipolar lines should lie in the same row of image matrix. Maximal deviation of epipolar line from its row in rectified view was 1 pixel, due to pixelization. Figure 4. represents single rectified stereo pair, used for the inspection of the rectification. Images on the figure 4. are zoomed because free scaling parameter is used to show only valid pixels.
Figure 4. Rectified stereo pair.
3.3 3D data acquisition
For the point correspondence identification, various algorithms are used. OpenCV in Python offers two algorithms, the Stereo Block Matching (SBM) and the Stereo Global Block Matching (SGBM) algorithm (Hirschmüller, 2008). The SGBM algorithm is used as it demonstrated better performance. It calculates matching cost along 8 directions towards each pixel of interest. Figure 5. represents rectified stereo pair used for the creation of frontal point cloud, and figure 6. represents corresponding depth map. Depth map contains significant amount of noise due to uniform background and mount pattern. Noise is manually removed and only the point cloud of the artifact area is used for the analyzes.
Figure 5. Stereo pair used for point cloud
Figure 6. Depth map acquired from images on figure 5. The International Archives of the Photogrammetry, Remote Sensing and Spatial Information Sciences, Volume XLII-1/W1, 2017
4. EXPERIMENTAL APPROACH
The developed algorithm for 3D data acquisition was tested by calculating the spatial difference between the 3D point cloud produced in the OpenCV and 3D point cloud acquired based on the same stereo pair, in the software Agisoft Photoscan (version 1.2.6). Accuracy of the 3D point cloud produced with the OpenCV was tested in reference to the full 3D model produced by the images taken with the camera Canon Rebel XsI with the lens of focal length 55 mm. Cannon Rebel XsI was also calibrated with Agisoft Lens which also uses the Brown’s model of lens distortion (1). Self-calibration was not employed in this case, since the most of the detected points were in center of the image due to masking, which does not favor modeling distortion elements of higher-order. This research was carried over the stone replica of archeological artifact with dimensions 16x13x10 cm. Name of the artifact is “Head of the goddess” and it dates from the 3rd century (Cambi, 1993). The imaged artifact can be seen on figure 5. In order to confirm the research goal, imaging of the front side of the artifact was carried out. During the data acquiring, stereo system was stabilized on the tripod on various distances from the model. Distances varied from full cadre distance to 50cm, which should be optimal distance for this application. However, due to the resolution and the ground sample distance, detailed analysis is carried only on the full cadre images. The artifact was stabilized on the metal pillar and the metal bars with the markers were set in the immediate vicinity of the artifact. Markers are set in order to acquire better orientation for the full 3D model, also distances between the markers were precisely measured with the standard deviation of 10µm, and are used as a scale for the model. Software used for the comparison of models is open source software CloudCompare (version 2.9) (Cloud Compare, 2017).
4.1 Algorithm testing
Algorithm was tested by comparison of the 3D point cloud acquired with an open source solution, OpenCV and point cloud acquired with the proven software Agisoft PhotoScan. RO in OpenCV was calculated based on the 152 image points in each pair of the images used for the orientation i.e. stereo calibration. Totally 10 pairs of the images were used for the orientation. On the other hand, Agisoft’s algorithm detected 2247 tie points visible on the both images, creating that way a strong geometry. Ground sample distance was 0.22mm. Precalibrated camera was used for the point cloud generation and the further optimization of camera is not done. Agisoft point cloud was created with the maximal offered quality, from alignment to point cloud generation, and with minimal further processing i.e. depth filtering and interpolation, to fit OpenCV point cloud that is minimally processed.
4.2 Accuracy of the point cloud
Accuracy of the point cloud was tested by the comparison of produced point cloud to the model acquired with better camera and in larger scale, which is considered as an reference in this paper. Reference i.e. etalon model is produced based on the 73 images of the resolution 4272x2848 with the ground sample distance of 0.07mm. In order to examine accuracy of the stereo point cloud, point cloud created with the OpenCV and point cloud created in the Agisoft PhotoScan with the same images were compared with the reference model.
5. RESULTS AND DISCUSSION
The results of the tests taken in order to test presented algorithm and accuracy of obtained model, are presented here. The algorithm is tested by the comparing point clouds obtained with both algorithms. Figure 7. represents comparison of the point clouds, where point cloud produced in Agisoft PhotoScan is used as a reference, and deviation of OpenCV’s cloud is visually represented.
Figure 7. Point cloud obtained with OpenCV and graphical representation of the spatial differences in reference to
Agisoft’s point cloud.
Figure 8. Normal distribution of the spatial differences of point cloud obtained by OpenCV and Agisoft’s point cloud
On figure 7. it can be seen that most of the points match within ±3mm. Normal distribution of the test point cloud deviation in reference to the reverent point cloud is retained. That implies that there was no systematic influence within algorithm. Furthermore, an accuracy of the point cloud is tested in reference to the model created with the better camera, higher resolution images and in the larger scale. Both point clouds, produced in Agisoft and in OpenCV are compared to reference The International Archives of the Photogrammetry, Remote Sensing and Spatial Information Sciences, Volume XLII-1/W1, 2017
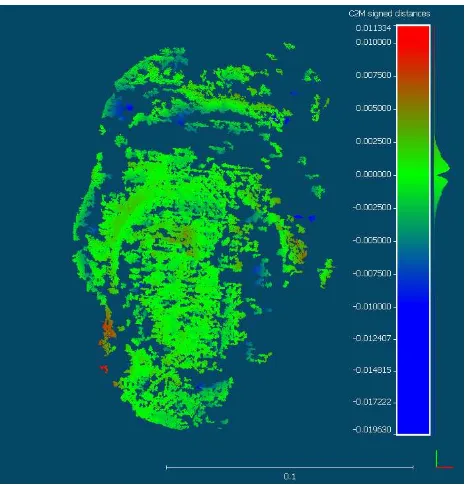
model. On the figure 8. comparison of the OpenCV’s point cloud with the reference model can be seen.
Figure 8. Point cloud obtained by OpenCV algorithm and graphical representation of the spatial differences to reference
3D model.
Figure 9. Normal distribution of the spatial differences of point cloud obtained by OpenCV algorithm and reference 3D model
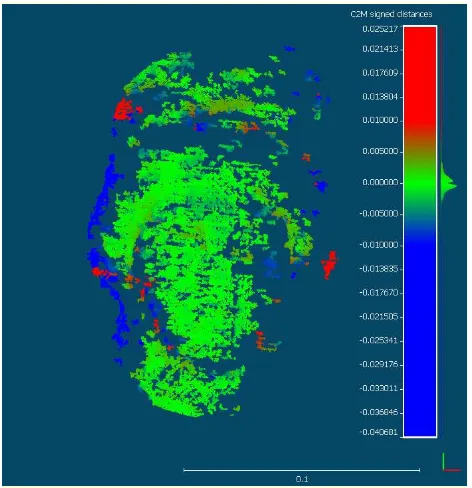
The red area on the figure 7. as it is seen on the figure 8. are mostly the points that were correctly matched by the OpenCV and were not matched by the Agisoft’s algorithm, as distance to the Agisoft’s stereo point cloud is significant and distance to reference point cloud is not significant. However, Agisoft’s point cloud appears to be more accurate than the one produced with OpenCV, which is clearly seen in table 1. Distribution of distances on the figure 9. and the figure 10. implies that there was no any systematic influence on process of the point cloud orientation. Better statistic of Agisoft’s point cloud is due to slight filtering of data. On the same set of images OpenCV produced almost 20% more points than Agisoft. During depth map generation, various parameters can be adjusted and certainly can significantly contribute to accuracy of the point cloud.
Figure 10. Point cloud obtained by Agisoft PhotoScan and graphical representation of the spatial differences to reference
3D model
Figure 11. Normal distribution of the spatial differences of point cloud obtained by Agisoft PhotoScan and reference 3D
model
Point cloud Ethalon-Agisoft
Ethalon-OpenCV
Agisoft-OpenCV Min. dist.
[mm] -4.108 -19.630 -40.681
Max. dist.
[mm] 6.674 11.334 25.217
mean dist.
[mm] -0.002 -0.269 -0.780
sd
[mm] 0.731 2.077 5.135
No. of
points 90966 114302 114302
Table 1. Statistical data of spatial differences of tested point clouds of reference 3D model
However, tuning parameters is not research matter of this paper, thus a lot of research space is left for further researches. It is The International Archives of the Photogrammetry, Remote Sensing and Spatial Information Sciences, Volume XLII-1/W1, 2017
important to emphasize that both stereo point clouds are scaled via the baseline acquired with stereo calibration, and that reference model is scaled via precisely measured markers, which could make scale responsible for the present spatial difference. However, symmetrical distribution of the spatial difference which emphasizes their random nature confirms that it is not the case. Certain disproportion between the size of the artefact, baseline and ground sample distance was present, and in order to minimize disproportion by reducing imaging distance, sharpness of acquisition was sacrificed.
6. CONCLUSIONS
Presented algorithm proved to be stable and accurate considering the circumstances. It is evident that system and algorithm would produce better results on larger artefact and with slight convergence of the cameras. Besides that, OpenCV algorithm heavily depends on tuning depth map parameters, and in further researches great attention should be paid on that. However, potential of this algorithm is significant and should be further investigated. In this research only one stereo pair is analysed, which does not suit real application. Further on, video sequences should be analysed in order to suit real applications.
REFERENCES
Agisoft. Agisoft photoscan. http://www.agisoft.com/, [Online; accessed 12-April-2017].
Balletti, C., Guerra, F., Tsioukas, V., Vernier, P., 2014. Calibration of Action Cameras for Photogrammetric Purposes.
Sensors, 14(9), pp. 17471-17490.
Brown, D., 1966. Decentering distortion of lenses. Photometric Engineering 32(3), pp. 444-462.
Cambi, N., 1993. Bilješke uz kipove Kibele (Magna Mater) iz Senja. Senjski zbornik, 20(1), pp. 33-43.
Carrillo, L., López, A., Lozano, R., Pégard, C., 2012. Combining stereo vision and inertial navigation system for a quad-rotor UAV. Journal of Intelligent & Robotic Systems, 65(1-4), pp. 373-387.
CloudCompare. Cloud Compare. http://www.danielgm.net/cc/, [Online; accessed 12-April-2017].
Ducrot, A., Dumortier, Y., Herlin, I., Ducrot, V., 2011. Real-time quasi dense two-frames depth map for autonomous guided vehicles. In Intelligent Vehicles Symposium (IV), IEEE, pp. 497-503.
Gašparović, M., Gajski, D., 2016a. Two-step camera calibration method developed for micro UAV's. In: The International Archives of the Photogrammetry, Remote Sensing and Spatial Information Sciences, Prague, Czech Republic, Vol. XLI, Part B1, pp. 829-833.
Gašparović, M., Gajski, D., 2016b. Testing of Image Quality Parameters of Digital Cameras for Photogrammetric Surveying with Unmanned Aircrafts. Geodetski list, 70(3), pp. 253-266.
GIMP. GNU Image Manipulation Program. https://www.gimp.org/, [Online; accessed 12-April-2017].
Hartley, R., Zisserman, A., 2003. Multiple view geometry in computer vision. Cambridge university press, Cambridge.
Hirschmuller, H., 2008. Stereo processing by semiglobal matching and mutual information. IEEE Transactions on pattern analysis and machine intelligence, 30(2), pp. 328-341.
Huh, S., Shim, D. H., Kim, J.,2013. Integrated navigation system using camera and gimbaled laser scanner for indoor and outdoor autonomous flight of UAVs. IEEE/RSJ International Conference on Intelligent Robots and Systems pp. 3158-3163.
Macfarlane, N., Howland, J., Jensen, F., Tyack, P., 2015. A 3D stereo camera system for precisely positioning animals in space and time. Behavioral Ecology and Sociobiology, 69(4), pp. 685-693.
McGlone, J. C., 2013. Manual of Photogrammetry, 6th edition, American Society for Photogrammetry and Remote Sensing, Bethesda.
Pix4D SA. Pix4DMapper http://pix4d.com/, [Online; accessed 12-April-2017].
Schmidt, J., Niemann, H., Vogt, S., 2002. Dense disparity maps in real-time with an application to augmented reality.
Proceedings on Sixth IEEE Workshop on Applications of Computer Vision, pp. 225-230.
Uke, N., Thool, R.,2013. Moving vehicle detection for measuring traffic count using opencv. JOACE, 1(4), pp. 349-352.
Xiaomi. Xiaomi Yi. http://www.xiaoyi.com/, [Online; accessed 12-April-2017].
Yekutieli, Y., Mitelman, R., Hochner, B., Flash, T., 2007. Analyzing octopus movements using three-dimensional reconstruction. Journal of Neurophysiology, 98(3), pp. 1775-1790.
Zhang, Z., 2000. A flexible new technique for camera calibration. IEEE Transactions on pattern analysis and machine intelligence, 22(11), pp. 1330-1334.