Transmission of price shifts in the context of structural adjustment:
An empirical analysis for staple food after the devaluation of the franc
CFA in Ivory Coast
Johannes Jütting
∗Centre for Development Research Bonn, Walter-Flex-Strasse 3, D-53113 Bonn, Germany
Received 19 November 1997; received in revised form 30 June 1999; accepted 17 August 1999
Abstract
This article analyses price shifts after currency devaluation in the Ivory Coast using a time-series modelling approach. Model results identify the liberalisation of the import-rice sector as the key factor for the transmission of price effects. Fixation of the imported rice price as a social compensatory measure hindered the adjustment of prices in the first year after the devaluation. As soon as the price controls on imported rice were lifted, prices changed in favour of tradable goods. The findings in this paper hint at a possible trade-off between the protection of vulnerable groups during the process of adjustment and the intended incentive effect. ©2000 Elsevier Science B.V. All rights reserved.
Keywords:Agricultural sector; Devaluation; Liberalisation; Time-series model
1. Introduction
An important target of structural adjustment policies is to create a macroeconomic setting that favours the production of tradable goods. An overvalued exchange rate has proven to be a main obstacle for achieving sustainable growth rates in the agricultural sector of developing countries (Schiff and Valdez, 1992). How-ever, critics of currency devaluation indicate negative social consequences. Inflationary tendencies are most prominent in those goods and services that are essen-tial to the survival of the urban poor. The whole ad-justment process can be jeopardised if a change in the monetary regime is not accompanied by the imple-mentation of social compensatory measures (Vivian, 1995). The formulation of those measures,
neverthe-∗Tel.: +49-228-73-1859; fax: +49-229-73-1869
E-mail address:[email protected] (J. Jütting)
less, calls for a more detailed empirical analysis deal-ing with the development of the adjustment process itself (Jütting, 1997).
From this background, the empirical analysis of price shifts after 50% devaluation of the franc CFA against the French franc in January 1994 is a very interesting case study.1 We can expect relative price
changes in favour of tradable goods, but we must also take into account sector-specific conditions. To reduce negative social consequences, especially for the urban poor, the Ivorian government fixed the price for im-ported rice to guarantee a minimum access to food for the poor. A fundamental question now is how prices for staple food reacted after the devaluation and after
1 Franc CFA (F CFA) is the common currency of the African
Franc zone, which currently includes 14 West and Central African member countries. Whereas the F CFA has been pegged to the French franc for more than 40 years, it is today pegged to the Euro.
framework. Finally, the empirical results of the econo-metric modelling will be discussed in the context of the identified effects of the implemented market and price policies.
2. Structural adjustment measures in the Ivorian rice sector and expected development of staple food prices after the F CFA devaluation
Today, the agricultural sector accounts for 30% of GDP, two-thirds of foreign exchange earnings and two-thirds of the labour force in the Ivory Coast.2 The Ivory Coast is mainly self-sufficient in food. The development of the staple-food sector has been very dynamic, and increasing demand could be satisfied for all products, with the exception of rice. The main rea-son for this is the Ivorian rice policy. Whereas pro-duction of locally traded goods, such as plantain, cas-sava and yams, was not influenced by Ivorian agricul-tural policies, the rice sector was heavily influenced by the state. Supporting local production and at the same time providing consumers with a cheap staple food has been the main aim of the rice policy. To do this, the Ivorian government has controlled produc-tion, processing, trade and imports.
The situation in the Ivory Coast’s rice sector prior to the devaluation consisted of a strongly increasing demand for rice in comparison to a moderately in-creasing supply. Production rose from approximately 500 000 t of paddy3 in the middle of the 1970s to more than 650 000 t per year in the beginning of the 1990s. After hulling, approximately 420 000 t of rice is produced yearly. The demand for hulled rice rose in the same time period from almost 300 000 t per year to more than 700 000 t per year, leaving about 300 000 t
2An overview of the role of the agricultural sector in the
devel-opment process of African countries is given by Jütting (1999).
3Unhulled rice will be referred to as ‘paddy’.
pricing policies that effectively subsidised consump-tion of cheap import rice. This led to increased rice imports and lower prices relative to competing staple foods. In addition, a transportpéréquation that sub-sidised import rice in the interior and had guaranteed a uniform consumer price for all regions, was dis-couraging domestic production (World Bank, 1994).
In the beginning of the 1990s, under the framework of the first agricultural sector adjustment program, first steps were taken towards liberalisation. These mea-sures, however, were limited to the realms of produc-tion and processing. The price of imported rice was fixed at 160 F CFA/kg at the time of the devaluation. In January 1994, the price of imported rice was raised to 175 F CFA/kg, and beyond that remained completely disconnected from world markets and other influences (Hirsch, 1993).
A far-reaching liberalisation of the import-rice sec-tor took place in February 1995, one year after the devaluation. The transportpéréquation was revoked; the CGPP5 dissolved; and the price for the imported rice,riz de grande consommation, was increased by more than 30%, from 175 F CFA/kg to 230 F CFA/kg. A different situation existed in the local rice market, which was fully liberalised at the end of the 1980s so that the price was freely determined by local supply and demand.
Under the described conditions of the Ivory Coast’s rice sector, the expected price shifts of the devaluation can be characterised as follows:
• No change in price for imported rice which is fixed by the state.
4 The imported rice, riz de grande consommation, represents
approximately 90% of total imported rice, and is, for the most part, consumed in the cities. The local rice, on the other hand, finds its outlet predominantly in rural markets.
5 Caisse G´en´erale de P´er´equation des Prix: A price-equalization
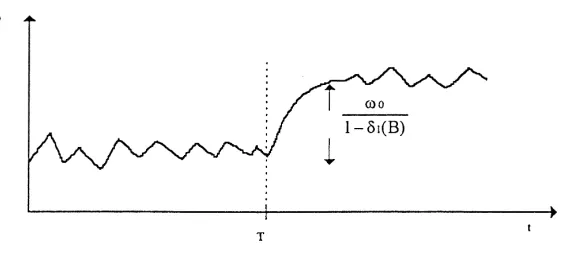
Fig. 1. Gradual and permanent impact of an intervention upon a time series. (Source: Leone, 1987, p. 469)
• A price increase for local rice, where the market is not regulated. Local rice constitutes a traded prod-uct and one cannot expect, a priori, a complete coupling of local rice prices from general price de-velopments caused by the devaluation.
• No change, or only moderate change, in price for the non-tradables, cassava, plantain and yams.
3. Analysis of policy interventions with time-series models
Time-series models are usually used for forecasts when little is known about the determinants of the variable of primary concern. They account for pat-tern in the past movements of a variable and use that information to predict its future movements. Therefore, time-series models do not require the distinction between exogenous and endogenous vari-ables, as opposed to econometric models. ARIMA (Auto-Regressive Integrated Moving Average) mod-els are a central group within the time-series modmod-els, and have proved their capacity in varying areas of application. An expansion of the simple ARIMA model is the intervention analysis, that was, in great part, developed by Box and Tiao (1975). The purpose of these methods is to build a stochastic time-series model that can project the impacts of an intervention upon a process. It is requisite for the use of these models that the researcher can determine the starting point of the intervention, and has a general idea as to its workings upon the time series being investigated (Vandaele, 1983).
Intervention models consist of two components: a deterministic intervention variable and a stochastic ARIMA model. Models of the following type will be
utilised (Mills, 1990):
ω(B) numerator polynomial for the intervention
δ(B) denominator polynomial for the intervention
I intervention variable
T starting point of the intervention
φ coefficient of the autoregressive (AR)-parameter
a error term
θ coefficient of the moving average
(MA)-parameter
B backshift operator
d degree of differencing
The intervention variableIt is a series of (0,1) data analogous to the use of dummy variables in the regres-sion analysis. WithIt, it is possible to determine the starting point, the length, and the characteristics of the intervention. The impact of the intervention upon the process can be modelled as permanent or temporary.
If the intervention is assumed to be permanent, ‘step’ type of intervention variable is used. This means that It= 0 for all time periods up to the change and
elsewhere would be the appropriate form of the model
The selected ARIMA and intervention models for the analysis of price shifts after the F CFA devaluation fulfil the following criteria:
• The time series must be stationary. Several tech-niques exist to prove the stationarity. Here, a vi-sual inspection of the original data set, a plot of the residuals, the autocorrelation function (acf) as well as the size of the AR-coefficient is used as an indicator. In case of non-stationarity, it is possible to induce stationarity by transforming (differences and/or logarithmics) the original data set.
• The model is parsimonious.
• The estimated coefficients are significantly different from zero at the 95% level and are invertible. • The residuals of the estimated models indicate no
autocorrelation with a 95% level of confidence, ac-cording to tests of Ljung and Box (1978).
In order to choose a model, the variance of the resid-uals (VAR) and the sum of squared errors (SSE) will be consulted to help determine the worth of the model.6
Furthermore, these criteria are used to analyse the ‘ro-bustness’ of the model: no substantial changes in VAR and SSE values, as well as in the estimated coeffi-cients, characterise a robust model structure. Other-wise, it is presumed that the data-generating process has changed. In this context, a change in value of a coefficient larger than 0.1 will be seen as an indica-tion of a necessary adaptaindica-tion of the model structure (Pankratz, 1983).
The database used consists of average monthly prices from January 1990 through November 1995
6Several criteria are available to check for the goodness of fit
of the estimation (e.g.,x2-MSE). Mills (1990) discusses different model selection criteria, such as AIC and BIC.
4. Empirical results
4.1. Quantification of price shifts
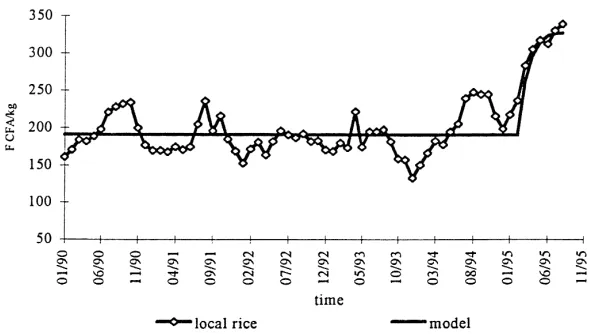
In the following, the impact of the policy in-terventions, ‘devaluation’ and ‘liberalisation of the import-rice sector’, on the development of local rice prices is analysed. The actual price development for local rice prices is presented in Fig. 2, taking the Odienné and Abidjan-Adjamé markets as examples.
The actual, visible price developments in Odienné appear to contradict the hypotheses concerning the course of adjustment of local rice prices. No pro-nounced price shifts can be observed after the devalu-ation. In contrast, a strong increase in prices is visible after the liberalisation of the import-rice sector. In the following, it will be observed if the calculations with the ARIMA and intervention models lead to similar results.
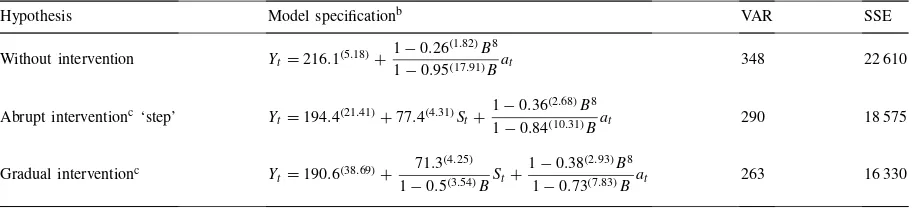
After the identification of a changing data-generating process, it will be attempted to quantify these changes with intervention modelling. It shall proceed from the theory that liberalisation has contributed to a constant elevation of price levels for local rice, and that these increases first took effect in March 1995, rather than in February. In that regard, all models will be analysed to determine if the presumed alterations of price levels are significant, and whether an abrupt, or a gradual, adaptation to the new framework of conditions occurs. Table 1 shows results from the Odienné market.
Fig. 2. Price changes for local rice for Odienn´e and Abidjan-Adjam´e markets (January 1990–November 1995) Table 1
Intervention and ARIMA modelling of the local rice market in Odienn´e (January 1990–August 1995)a
Hypothesis Model specificationb VAR SSE
Without intervention Yt=216.1(5.18)+
1−0.26(1.82)B8
1−0.95(17.91)Bat 348 22 610
Abrupt interventionc‘step’ Yt=194.4(21.41)+77.4(4.31)St+
1−0.36(2.68)B8
1−0.84(10.31)Bat 290 18 575
Gradual interventionc Y
t=190.6(38.69)+
71.3(4.25) 1−0.5(3.54)BSt+
1−0.38(2.93)B8
1−0.73(7.83)Bat 263 16 330
aSource: own computation. bt-values in parentheses.
cWithS
t= 0 fort<March 1995 andSt= 1 fort≥March 1995.
data-generation process. All of the estimated coeffi-cients are significant and there is no sign for autocor-relation in the residuals. The intervention model in which the adaptation of local rice prices is depicted gradually (line three of Table 1), is found to be supe-rior to the abrupt intervention model when the values for VAR and SSE are compared (row two of Table 1). After selecting the ‘gradual intervention model’, one can proceed with the interpretation.
An intervention variable measures the impact of an intervention for a given time period, as well as the aggregate effect, which means the change of the process level. The results presented in Table 1 for the Odienné market for local rice can be interpreted as follows: rice prices show a monthly increase of 71.3 F CFA/kg in March 1995, 107 F CFA/kg in
April 1995, and 141.5 F CFA/kg after half a year in comparison to the pre-intervention level. The total increase in the change in process level is estimated to be
71.3
1−0.5 =142.6
The new equilibrium level after the intervention is the mean value plus the calculated change in the process level:
190.6 F CFA/kg+142.6 F CFA/kg
=333.2 F CFA/kg.
Fig. 3. Path of local rice price adaptation in Odienn´e (January 1990–August 1995).
becomes clear that the price adjustment in Odienné is permanent, and prices change gradually, not abruptly. For all other markets alike, intervention models are superior to the pure ARIMA models. Moreover, a gradual impact intervention model leads to better re-sults than does an abrupt impact intervention model.
Table 2 presents the results for local rice differen-tiated between consumer (urban) and producer (rural) markets. It shows the equilibrium price level before and after the economic shock occurred, as well as the deducted increase in rice prices.
If one compares the results between the rural and urban markets, a larger price shift in the rural markets will be observed. The calculated increase in the price of local rice totals approximately 50% in the rural kets, and approximately only 30% in the urban mar-kets. To understand this disparity, the elimination of the transportation péréquationfor imported rice dur-ing the process of liberalisation must be taken into consideration. Through the elimination of this subsidy, the price of imported rice increased dramatically in the rural markets than in the Abidjan markets.
4.2. Discussion of the results
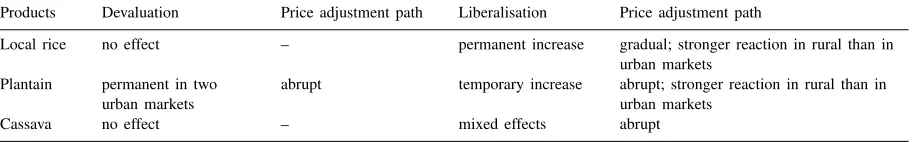
The summary of the empirical results presented in Table 3 shows the limited effect of the devaluation on the development of staple-food prices. Only for plan-tain do the models estimate a significant price increase in two consumer markets, while the model results for plantain and cassava are in line with the expectations.
However, this does not apply to the effects of the de-valuation on local rice prices. The intended price shift in favour of tradable goods, such as local rice, did not take effect. The price fixation on imported rice, im-plemented as a social compensatory measure, had a more pervasive influence on the development of local rice prices than expected. Only after the liberalisation of the import-rice sector, did local rice prices adjust to the new market situation.
The liberalisation of the import-rice sector not only influenced the price development of local rice, but also of plantain, and, in a reduced fashion, that of cassava as well (Table 3). A temporary change in the consumer demand of staple food would be an intuitive explana-tion. Obviously, consumers substituted plantain and, to a less extent, cassava for imported and local rice.
As Table 3 depicts, for all local rice and plantain, the price effect is stronger in rural than in urban markets. A reason for the regional differences in the price ad-justment path could be the abolishing of the transport
péréquationin the context of the liberalisation in the import-rice sector. After the removal of the subsidy, the artificially created advantage for imported rice in regions far away from the coast disappeared.
5. Conclusion
Table 2
Estimated shift of rice prices after the liberalisation of the import-rice sectora
Markets Equilibrium price level after the intervention µ+ ω0
1−δ1(B)
Average price level before the intervention (µ)
Shift of local rice prices ω0 1−δ1(B)
F CFA/kg F CFA/kg F CFA/kg in % vµ
Producer markets
Abengouru 308.2 208.9 99.3 48
Korhogo Xb X 108.3 X
Odienn´e 333.2 190.6 142.6 75
Yamassoukrou 329.5 218.2 111.3 51
Consumer markets
Bouak´e X X 64.0 X
Abidjan-Adjam´e 305.8 223 82.8 37
Abidjan-Abobo 284.1 215.8 68.3 32
Abidjan-Treichville 313.0 236.0 77.0 33
aSource: own computation using OCPV data.
bAfter differencing,µis no longer significant and is dropped.
Table 3
Significance, degree and path of price adjustment in the staple-food sectora
Products Devaluation Price adjustment path Liberalisation Price adjustment path
Local rice no effect – permanent increase gradual; stronger reaction in rural than in urban markets
Plantain permanent in two urban markets
abrupt temporary increase abrupt; stronger reaction in rural than in urban markets
Cassava no effect – mixed effects abrupt
aSource: own calculations.
intervention models are used to measure the impact of two economic shocks — devaluation and trade lib-eralisation of the import-rice sector — on the prices of local rice, plantain and cassava. The results indi-cate that the devaluation itself has not brought about the expected price changes for tradable goods. Only the trade liberalisation of the import-rice sector one year after the devaluation has led to a substantial and permanent increase in local rice prices. Given these results, market and price instruments are the key fac-tors in explaining the transmission of prices. As soon as prices could change, price shifts in the staple-food sector are mainly dependent on substitutional and spa-tial effects.
The findings in this paper hint at a possible trade-off between the protection of vulnerable groups during the process of adjustment and the intended incentive ef-fect. While the rice consumers obviously profited from the price fixation until the trade liberalisation, rice pro-ducers came out on the losing side as the product price
of rice remained the same. More research is needed to investigate the effectiveness and efficiency of so-cial compensatory measures. To do so, more in-depth studies are needed to analyse the effect of social com-pensatory measures on the production side, including quantity effects, as well as on the consumer behaviour of poor people.
Acknowledgements
Jütting, J., 1999. The role of the agricultural sector in the economic development of African countries. Balance and Perspectives, Economics 9, forthcoming.
Leone, R., 1987. Forecasting the effect of an environmental change on market performance: an intervention time-series approach. Int. J. Forecasting 3, 463–478.
Ljung, G., Box, G., 1978. On a measure of lack of fit in time series models. Biometrika 65, 297–303.
Vivian, J., 1995. How safe are social safety nets? Adjustment and social sector restructuring in developing countries. Eur. J. Dev. Res. 4 (1), 1–25.