Seasonal and interannual variability of energy fluxes over a broadleaved
temperate deciduous forest in North America
Kell B. Wilson
∗, Dennis D. Baldocchi
1Atmospheric Turbulence and Diffusion Division, NOAA, P.O. Box 2456, Oak Ridge, TN 37831, USA
Received 13 April 1999; received in revised form 20 August 1999; accepted 27 August 1999
Abstract
The components of the surface energy balance were measured for 3 years over a broadleaved deciduous forest using the eddy covariance technique. Within years, the magnitude and distribution of fluxes was controlled by seasonal changes in solar radiation, drought, as well as leaf emergence and senescence. Evapotranspiration increased by a factor greater than five (from about 0.5 to 3 mm day−1) after leaves emerged in spring. Large decreases in sensible heat flux were observed over the same
period (6 to 2 MJ day−1) despite increases in solar radiation. The most influential effect on annual fluxes was the occurrence
and extent of drought, with lesser control exerted by differences in the timing of leaf expansion and leaf senescence. Average annual evapotranspiration over the period was 567 mm and ranged from 537 to 611 mm. The year with the lowest precipitation, soil moisture content and surface conductance also had the lowest evapotranspiration. Although evapotranspiration was quite sensitive to surface conductance and surface conductance was reduced substantially by drought, the correlation of low surface conductance and high humidity deficit reduced the effects of drought on evapotranspiration. Differences in net radiation among years were only a minor source of variability in evapotranspiration. In addition to surface conductance, other bulk parameters are calculated to describe the general exchange characteristics of this forest. ©2000 Elsevier Science B.V. All rights reserved.
Keywords:Evapotranspiration; Energy budget; Deciduous forest; Eddy-covariance; Surface conductance; Drought; Ameriflux; Hydrology; Water budget
1. Introduction
Deciduous forests cover much of the eastern United States. Meteorologists, hydrologists and forest ecolo-gists require knowledge of how these forests and the atmosphere exchange energy and water. Energy
parti-∗Corresponding author. Tel.:
+1-423-576-2317; fax:+1-423-576-1237.
E-mail addresses:[email protected] (K.B. Wilson), [email protected] (D.D. Baldocchi).
1Present address: Department of Environmental Science, Policy
and Management, University of California, Berkeley, 151 Hilgard Hall, Berkeley, CA 94720, USA.
tioning, particularly between latent and sensible heat, determines the water vapor and heat content of the at-mosphere, ultimately driving many regional and global scale climatological processes (Dirmeyer, 1994; Seth and Giorgi, 1996). This partitioning determines the growth rate and properties of the planetary boundary layer, influencing convection, long range transport of heat, humidity and pollutants. Evapotranspiration also affects streamflow, nutrient loss, soil moisture content and forest productivity.
An understanding of the variability of energy and water vapor fluxes over a site requires long-term measurements encompassing at least several different
climatic and phenological regimes creating this variability. Deciduous forests are characterized by phenological stages including leaf emergence and senescence (see Hutchison et al., 1986), which can vary in timing and duration between years and alter the exchange properties between the forest and at-mosphere. The effect of these events within a year and the timing of these events between years on long-term fluxes require high-resolution and contin-uous extensive data sets. Interannual climate vari-ability, most notably the occurrence, duration and extent of drought, can reduce water and carbon diox-ide exchange (Baldocchi, 1997). The biological and climatic controls of these long-term drought episodes on forest-atmosphere exchange processes also need to be established.
The eddy covariance technique (Baldocchi et al., 1988) provides a tool which allows for direct flux measurements at the time and spatial scales required to examine biological and climatological mechanisms creating variability. A number of short campaigns over a deciduous forest in the southeastern USA have re-ported canopy-scale water and energy exchange with the atmosphere using this technique. These studies have shown the relative magnitude and variation that can occur over several days (Verma et al., 1986; Bal-docchi and Vogel, 1996), a single season (BalBal-docchi, 1997) and a single year (Greco and Baldocchi, 1996). Other long-term energy balance studies based on eddy covariance at deciduous forests were single-year stud-ies during BOREAS (Blanken et al., 1997) and at Harvard forest, Massachusetts (Moore et al., 1996). Multi-year studies of interannual variability of the energy balance are scarce.
Several benefits exist for using long-term eddy co-variance data sets to evaluate ecosystem exchange. One is to validate process-based ecosystem exchange models operating at hourly, daily, seasonal and annual time scales. A second benefit, and the one developed here, is to identify and quantify the general charac-teristics of variability and canopy exchange processes that can be compared with other climates and biomes. Seasonal and annual sums of fluxes and the calcula-tion of bulk canopy parameters can be used to charac-terize canopy exchange and estimate the controls on that exchange. Some of these proposed bulk parame-ters include surface conductance, the Priestly–Taylor coefficient (Priestly and Taylor, 1972), the Bowen
ratio, and the decoupling coefficient (Jarvis and McNaughton, 1986). Long-term studies establish the behavior of these parameters, and whether they can be used to characterize vegetation types over sea-sonal and interannual time scales. Evaluation of these parameters may also be useful in refining boundary conditions of weather forecasting, hydrological and climate models, especially if they are shown to scale with more fundamental ecosystem parameters such as leaf area, leaf nitrogen and precipitation (Baldocchi and Meyers, 1998).
In this study, we report on 3 years of eddy co-variance measurements of energy and water fluxes over a temperate broadleaved deciduous forest in the southeastern United States. A summary of the com-ponents in the net energy balance will be discussed within and between the 3 years. Although diurnal and day to day variability is present in the data, the focus will be on seasonal and interannual variabil-ity. We primarily emphasize the distribution of sensi-ble and latent heat fluxes and the possisensi-ble biological and climatological controls on this distribution. Im-plications of variability in leaf phenological patterns and climate variability, especially drought, will be discussed. Bulk parameters, such as surface conduc-tance, the decoupling coefficient, the Priestly–Taylor coefficient and Bowen ratio are shown to character-ize canopy exchange processes and how the controls of these processes vary at seasonal and interannual time scales. The three-year data set is believed capa-ble of characterizing at least some of the typical in-terannual variability at this site because of the 1995 drought compared to the wetter years of 1996 and 1997 and differences in leaf emergence amongst the years.
2. Materials and methods
2.1. General forest characteristics
Micrometeorological and flux measurements were made above a temperate deciduous forest in Oak Ridge TN (35◦57′30′′N, 84◦17′15′′W, 365 m asl)
height was approximately 26 m above the surface. The forest contains a mixed deciduous stand dominated in the overstory by oak, maple and hickory. The stand is over 50 years old, having regenerated from agricul-tural land. The upwind fetch of forest extends several kilometers in all directions. The soil is well drained and is classified as a typic Paleudult, which encom-passes clayey and kaolinitic soils. A more detailed description of the canopy architecture, species com-position and soil properties are provided by Peters et al. (1970), Luxmoore et al. (1981), Hutchison et al. (1986) and Johnson and van Hook (1989).
2.2. Flux system and meteorological instruments
The instruments designed to measure fluxes were placed on a scaffold tower 36.9 m above the surface and about 10 m above the canopy. Wind velocity and virtual temperature fluctuations were measured with a three-dimensional sonic anemometer (model SWS-211/3K, Applied Technology, Boulder, CO).
Fluctuations in water and CO2were measured with an
open path, infrared absorption gas analyzer (Auble and Meyers, 1992), which was calibrated monthly using gas standards prepared by NOAA’s Climate Mon-itoring and Diagnostic Laboratory. Water va-por calibrations were referenced to a dew point hygrometer.
Simultaneous to the flux measurements, environ-mental and meteorological variables were measured at 1 s intervals and logged on digital data loggers (model CR-21x, Campbell Scientific, Logan Utah). Soil heat flux density was measured with three soil heat plates [model HFT-3, Radiation Energy Balance systems (REBS), Seattle, Washington] buried 0.01 m below the soil surface. Air temperature and relative humidity were measured with a temperature/humidity probe (HMP-35 A, Vaisala, Helsinki, Finland). Pho-tosynthetically active radiation (PAR) was measured above and below the canopy with a quantum sensor (model LI-190S, Licor Inc., Lincoln, NE). The sen-sor below the canopy was placed on a moving tram to average PAR over a horizontal transect of 20 m. Net radiation above the canopy was measured using a net radiometer (model 7, REBS, Seattle, Washington). Canopy bole temperature was calculated using three thermocouple probes inserted 1 cm into the trunk of a
tree at breast heat. Soil was periodically collected for gravimeteric measurements of soil water content.
2.3. Data processing
Vertical flux densities were evaluated by computing the mean covariance of water and sensible heat fluc-tuations with the fluctuating vertical velocity (Baldoc-chi et al., 1988). Fluctuations of velocity and scalars from the mean were determined from the difference between the instantaneous values and the mean scalar quantities. Mean scalar values were determined using a digital recursive filter with a 400 s time constant. Co-ordinate axes were rotated so that the mean vertical velocity was zero (McMillen, 1988). Water vapor and carbon dioxide fluxes were corrected for the effect of density fluctuations (Webb et al., 1980).
Canopy heat storage (Cs) was approximated from
MaCH1T/t, whereMais the biomass per unit ground
area (kg m−2),C
His the specific heat of the combined
woody biomass and water (3.34 kJ kg−1C−1),1Tis
the change in bole temperature at 1 cm depth (C) and
tis the time (s) over which1Tis calculated. In 1996 and 1997 maximum leaf area was estimated from lit-ter collection baskets. Total plant area index was com-puted continuously by applying Beers Law to solar radiation measurements above and below the canopy (Greco and Baldocchi, 1996). Leaf area was obtained by subtracting the woody canopy area index, which was obtained during leafless periods (Hutchison et al., 1986), from the total plant area index. Volumeteric soil moisture was determined from the gravimeteric mea-surements using a bulk density of 0.9 kg m−3(Peters
et al., 1970).
Data were screened vigorously for anomalous turbulent statistics and sensor malfunction, which introduced periods with missing data. To obtain an-nual sums it was necessary to fill in missing data.
Hourly latent heat fluxes (LE) that were missing
or of insufficient quality were assessed from the product of equilibrium evaporation for the hour [LEeq=ε/(ε+1)(Rn−G−Cs)] and the 2-week
aver-age Priestly–Taylor coefficient (α=E/Eeq).Eis
mea-sured evaporation (kg m−2s−1), ε issL/Cp, where s
is the slope of the saturation specific humidity versus temperature (K−1),Lis the latent heat of vaporization
Rn is the net radiation (Wm−2), G is the soil heat
transfer (Wm−2) and C
s is the canopy heat storage
(Wm−2). In solving for α, E and E
eq are the total
evaporation and total equilibrium evaporation during
the 2-week period when E was available. Missing
sensible heat fluxes were assessed from the regression equation describing the energy balance (see Section 3.4). Much of the missing data occurred at night or when precipitation or dew obscured sensor optics, which are periods when fluxes were expected to be small. We found that monthly and annual sums of la-tent and sensible heat flux were not highly sensitive to whether we subjected the data to acceptance criteria that was strict, as adapted in this paper, or loose.
Surface conductance (Gc) was computed each hour
by inverting the Penman–Monteith equation using the Bowen ratio (Shuttleworth et al., 1984):
1
humidity deficit of the air above the canopy (kg kg−1),
β is the ratio of sensible to latent heat flux (H/LE).
The aerodynamic conductance (Ga) was determined
from surface layer similarity (Brutsaert, 1982). There is an ‘excess’ resistance for scalars relative to momen-tum, which was calculated from an empirical relation-ship with friction velocity (Thom, 1972). Surface con-ductance values for an integrated period of time were evaluated by weighting the surface conductance over a given time by the net radiation:
Gc
R
GcRndt
R
Rndt (2)
This procedure was chosen over simple time averaging because very small conductances early in the morning and late in the afternoon have small effects on inte-grated fluxes but can arbitrarily and substantially in-fluence average values. Instead (2) was chosen to give greater weight to values of surface conductance during midday when fluxes were greater, without completely neglecting morning or evening data.
3. Results and discussion
A major source of intra-and inter-annual variability of energy fluxes is climatology. We first examine the
general climatic characteristics over the 3 years to set the stage for how fluxes respond to these variations.
3.1. Meteorological data
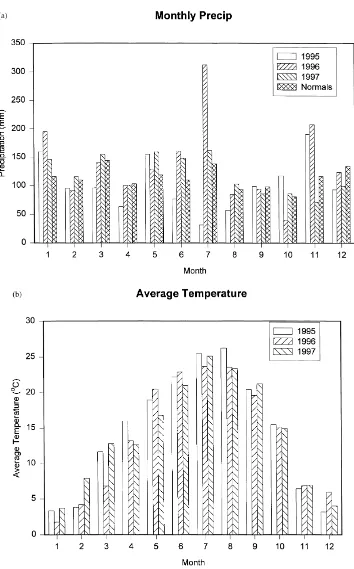
Thirty-year average annual precipitation for the site is 1372 mm. Over the study period the annual sums were 1245 mm (1995), 1682 mm (1996) and 1435 mm (1997) (Table 1). Average monthly precipitation for the 3 years is shown in Fig. 1a. In 1995 precipita-tion was only about 10% below normal, but the to-tal precipitation during the critical 3-month period of June, July and August 1995 was particularly low (165 mm compared to the average 343 mm for these 3 months). Over the same period in 1996 and 1997 the total precipitation was above average (413 and 558 mm).
Fig. 1b shows the mean monthly temperature at 36 m, 10 m above the canopy. Thirty-year means are not available at this height above the canopy, but at a nearby climatological site (Oak Ridge, NOAA/ATDD), the annual departures from the
30-year normal (13.9◦C) were +1.4◦C (1995),
+0.6◦C (1996) and +1.0◦C (1997) (Table 1). Dur-ing the 3-month period of June, July and August
the departures from normal were +2.4◦C (1995),
+1.6◦C (1996), and +1.0◦C (1997). The monthly
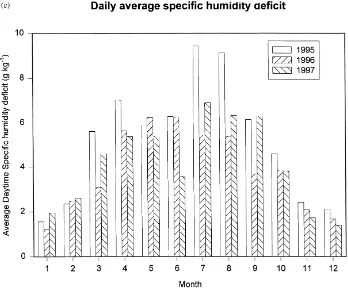
average daytime (900 EST–2000 EST) specific hu-midity deficit at 36 m is shown in Fig. 1c. Along with the decrease in precipitation, the humidity deficit was greater in 1995, especially in early spring and again in mid-summer. Total solar ir-radiance for each of the years was within 1% (Table 1).
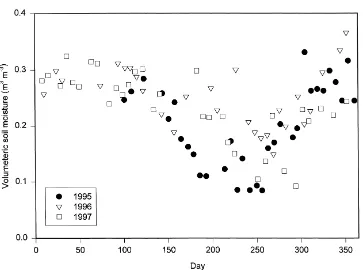
3.2. Soil moisture
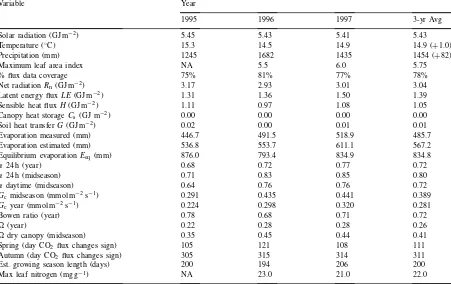
Table 1
Summary of climatology, energy balance components and bulk canopy characteristics for the 3 years. Three-year averages are shown along with departure from 30-year normal in parentheses when applicable. ‘% flux data coverage’ is the percent of hours which contain measured values for all components of the energy balance. ‘Evaporation measured’ is evapotranspiration directly measured by the eddy-covariance system, while ‘Evaporation estimated’ is the sum of the measured evaporation and the estimated evaporation when data was missing. The three values ofarefer to values calculated either for (i) all hours of the year, (ii) all hours during midseason or (iii) daytime hours only during midseason. Midseason refers to the period between days 140 and 275. Dry surface conductance (Gc) andare shown both for the
midseason period and for the year
Variable Year
1995 1996 1997 3-yr Avg
Solar radiation (GJ m−2) 5.45 5.43 5.41 5.43
Temperature (◦C) 15.3 14.5 14.9 14.9 (
+1.0)
Precipitation (mm) 1245 1682 1435 1454 (+82)
Maximum leaf area index NA 5.5 6.0 5.75
% flux data coverage 75% 81% 77% 78%
Net radiationRn (GJ m−2) 3.17 2.93 3.01 3.04
Latent energy fluxLE(GJ m−2) 1.31 1.36 1.50 1.39
Sensible heat fluxH(GJ m−2) 1.11 0.97 1.08 1.05
Canopy heat storageCs (GJ m−2) 0.00 0.00 0.00 0.00
Soil heat transferG(GJ m−2) 0.02 0.00 0.01 0.01
Evaporation measured (mm) 446.7 491.5 518.9 485.7
Evaporation estimated (mm) 536.8 553.7 611.1 567.2
Equilibrium evaporationEeq (mm) 876.0 793.4 834.9 834.8
α24 h (year) 0.68 0.72 0.77 0.72
α24 h (midseason) 0.71 0.83 0.85 0.80
αdaytime (midseason) 0.64 0.76 0.76 0.72
Gcmidseason (mmol m−2s−1) 0.291 0.435 0.441 0.389
Gcyear (mmol m−2s−1) 0.224 0.298 0.320 0.281
Bowen ratio (year) 0.78 0.68 0.71 0.72
(year) 0.22 0.28 0.28 0.26
dry canopy (midseason) 0.35 0.45 0.44 0.41
Spring (day CO2flux changes sign) 105 121 108 111
Autumn (day CO2 flux changes sign) 305 315 314 311
Est. growing season length (days) 200 194 206 200
Max leaf nitrogen (mg g−1) NA 23.0 21.0 22.0
declined after day 210, but this decline began much later and was generally not to the extent of the decline in 1995.
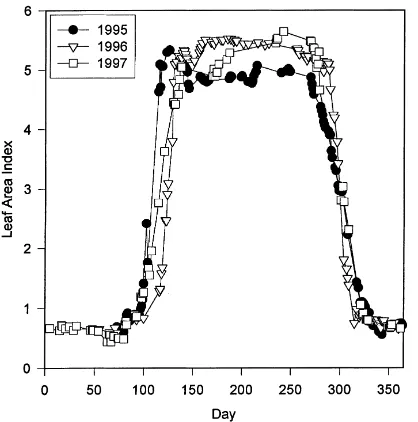
3.3. Leaf area and length of growing season
Calculations of leaf area based on litter basket col-lection indicated maximum leaf areas of 5.5 in 1996 and 6.0 in 1997. Continuous measurements of leaf area based on Beers Law were slightly less than collected in the litter baskets, but demonstrate the dynamics of leaf area over the 3 years (Fig. 3). The emergence of leaves in spring began about 2 weeks earlier in 1995 and 1997 compared to 1996 (Fig. 3). A cool cloudy period in 1997 delayed the date of full leaf
expan-sion to nearly that in 1996. The beginning (spring) and ending (autumn) days with physiologically active leaves and total length of growing season were also estimated from the approximate dates when the daily flux of carbon dioxide crossed the zero axis in spring and again in autumn (Table 1).
3.4. Energy balance
The performance of the eddy covariance measure-ment system is often evaluated by examining energy balance closure (Baldocchi et al., 1988). For each half-hour period, the total net radiation (Rn) should
Fig. 1 (Continued).
heat transfer (G) and heat storage within the canopy (Cs) (i.e. Rn=LE+H+G+Cs). Regression
statis-tics of LE+H on Rn−G−Cs for half-hourly data
are shown in Table 2 for each of the 3 years. For all years, the slope of the regression was less than one and the intercept was slightly greater than zero. On
an annual basis the sum of LE+H was about 80%
of the net radiation. Recent modification by REBS of the Q7 sensor calibration resulted in poorer en-ergy balance closure compared to previous studies at this site using a Q6 (Verma et al., 1986; Baldochhi and Harley, 1995). Other long-term eddy covariance studies indicate that lack of energy balance closure is common, although this discrepancy is not well understood (Goulden et al., 1997; Blanken et al., 1997; Aubinet et al., 1999). At our site, we found no effect of wind direction on energy balance clo-sure nor did we find evidence of flux divergence (not shown). While our site is in a region of undulating terrain, typically during the daytime wind flow is
along a broad ridge and the vertical angle of rotation is small.
3.5. Net radiation
The annual net radiation was 3.17 GJ m−2 (1995),
2.93 GJ m−2 (1996) and 3.01 GJ m−2 (1997) (Table
1). These annual values are greater than those reported over a 20-year period in a German deciduous forest
(48◦N) (Jaeger and Kessler, 1997) and for a nearby
deciduous forest in West Virginia (39◦N) (Tajchman
et al., 1997). Although annual sums exceed those in boreal regions, mid-growing season averages of net radiation are only slightly less than for boreal sites (Baldocchi and Vogel, 1996).
Fig. 2. Volumetric soil moisture content for the 3 years.
1997, both periods coinciding with anomalies in solar radiation. In the following sections the four energy sinks which approximately balance net radiation are discussed.
3.6. Canopy heat storage and soil heat transfer
The canopy heat storage term (Cs) was occasionally
an important sink or source of energy, with a typical
daily maximum value of 60 Wm−2in late spring, but
because the term usually changed signs between day-light and nighttime hours, the average daily magnitude
rarely exceeded 2–3 Wm−2. As expected, on annual
time scalesCs was negligible and not statistically
dif-ferent from zero.
There was a seasonal trend in soil heat transfer (G) each of the 3 years (Fig. 4b). The soil served as an energy sink (G> 0) from early spring through most of the summer. The sink maximum generally occurred between mid-April and late June at an average 24 h
flux density of around 10 Wm−2. Average midday
rates were typically around 25–30 Wm−2 during this
period, occasionally approaching maximum hourly
values of 60–70 Wm−2, but on an hourly scale soil
heat flux was usually less than canopy heat storage. Generally, from mid-morning to late afternoon during the warm season, the magnitude of the soil heat flux was less than 10% of net radiation. By late summer the soil heat flux reversed signs and reached minimum
daily average values of around −10 Wm−2 between
November and January. At night, and especially dur-ing winter,Gwas often a considerable portion of the negative net radiation. Although the soil heat flux was important on diurnal and seasonal time scales, the yearly-integrated soil heat flux was less than 1% of the annual net radiation (Table 1).
3.7. Sensible and latent heat fluxes
Fig. 3. Leaf area index as estimated using Beer’s Law for the 3 years.
3-year average evapotranspiration for a 150-day pe-riod (day 150–day 300) during the growing season was about 33% greater than for the same period in a northern deciduous forest in Massachusetts (Moore et al., 1996). The estimated annual evapotranspira-tion over a deciduous aspen stand in Canada during 1994 was 403 mm (Black et al., 1996). Typical daily
maximum rates (4–5 mm day−1) were similar to
those found over the aspen stand and a tropical for-est (Shuttleworth et al., 1984) and about twice those over boreal coniferous forests (Kelliher et al., 1997; Baldocchi et al., 1997; Jarvis et al., 1997).
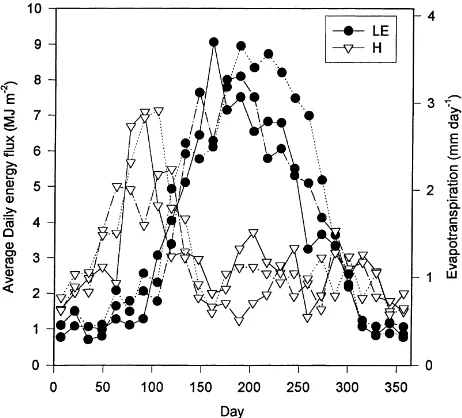
Fig. 5 shows the 2-week average daily integrated sensible and latent heat fluxes for each year. Sensible heat flux reached a maximum just before leaf emer-gence each year. Just after leaf emeremer-gence there was a dramatic decrease in sensible heat, while latent heat fluxes increased in an equally dramatic fashion and
Table 2
Slope, intercept and R2 of the half-hourly energy balance closure
(LE+HversusRn−G−Cs) for each of the 3 years
Year Slope Intercept (Wm−2) R2
1995 0.71 1.39 0.94
1996 0.76 2.21 0.95
1997 0.77 7.15 0.94
Fig. 4. Two-week averages of the daily (a) net radiation and (b) soil heat flux for the 3 years. ‘Day’ on thex-axis is the center point of the 2-week average.
peaked from early June (1995) to early July (1997). Within about a 6–8 week period each year the sen-sible heat flux went from a distinct yearly maximum to a near minimum. The daily-integrated sensible heat flux was fairly constant after leaf expansion.
Fig. 5. Two-week daily averages of daily latent (LE) and sensible (H) heat flux for 1995 (solid line), 1996 (dashed-dot line) and 1997 (dashed line). Also shown is the approximate 2-week average evapotranspiration. ‘Day’ on thex-axis is the center point of the 2-week average.
emergence of new leaves. Soil moisture was at or near field capacity before and after the spring transition each year (Fig. 2). Similar rapid and extreme changes in Bowen ratio have also been observed due to leaf emergence in a southern boreal aspen stand (Blanken et al., 1997) and a deciduous forest in Massachusetts (Moore et al., 1996). The transition was marked, but less dramatic, over a Japanese grassland (Saigusa et al., 1998). Leaf emergence occurred latest in 1996 (Fig. 3, Table 1), but this difference is detectable only as a slight delay in the initial increase in latent heat fluxes in the two 2-week averages following day 100 (Fig. 5).
Latent heat flux decreased more during the mid-dle and late summer in 1995 and 1996 than in 1997. During the stress period in 1995 the Bowen ratio dur-ing the daytime was about twice those in 1996 and 1997. By day 300 sensible heat flux was again larger than latent heat flux for all 3 years. This autumnal transition in fluxes was less intense and more tempo-rally diffuse than the spring transition, likely because the senescent process was less temporally distinct and the atmosphere was warmer in late summer and early fall, suppressing sensible heat flux. Daily sensible heat fluxes were also reduced by relatively large negative
fluxes from the warm soil at night during this period. The late season transition in fluxes was similar at Har-vard forest (Moore et al., 1996). A large transition in fluxes occurred during senescence in a North Ameri-can grassland (Ham and Knapp, 1998), while the ef-fect of senescence in a Japanese grassland was also less distinct (Saigusa et al., 1998).
3.8. Surface conductance
The distribution of sensible and latent heat flux, and the resulting effects on boundary layer processes, is dependent on both biological and climatological con-trolling variables. Fig. 5 shows that the emergence of leaves acts as a switch that transfers energy from sensible to latent heat flux. Other biological or cli-mate controls within and between years also affect this energy distribution, and in the following sections we attempt to estimate the magnitude of these controls.
‘Biological’ control will be defined by the effect of changes in surface conductance on evapotranspira-tion. Surface conductance, calculated from (1), does not explicitly represent the physiological parameter stomatal conductance because it can include nonlinear effects of soil moisture and canopy turbulence (Rau-pach and Finnigan, 1988; Paw and Meyers, 1989). Despite these difficulties, theoretical and experimen-tal investigations indicate that surface conductance is often related to the weighted integration from in-dividual leaves (Granier and Loustau, 1994; Herbst, 1995; Lu et al., 1995; Raupach, 1995; Baldocchi and Meyers, 1998). During the dormant season, soil evaporation determines the surface conductance. Soil evaporation can also affect surface conductance dur-ing the growdur-ing season, but soil evaporation at this
forest is typically small (25–30 Wm−2) (Baldocchi
and Meyers, 1991), and it is assumed that this contri-bution to surface conductance is relatively minor.
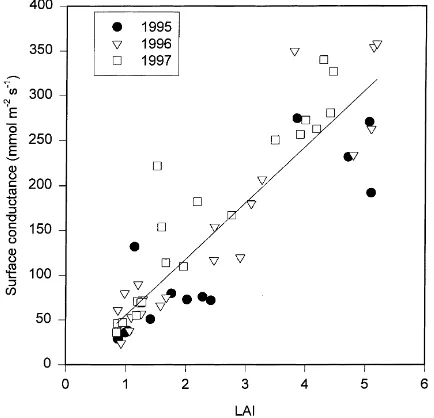
Average surface conductance was calculated for each hour from (1) and for each day and 2-week pe-riod from (2). Conductances were only calculated on days with no precipitation (dry surface conductance). In this analysis we assume that during the growing season surface conductance responds primarily to two different biological phenomena: changes in leaf area and changes in leaf-level stomatal conductance. The latter change can occur through changes in photosyn-thetic capacity or through humidity deficits, soil water content and solar radiation. During leaf expansion, surface conductance changes primarily from increas-ing leaf area. Fig. 6 shows that changes in leaf area and surface conductance were correlated during this transition period, although photosynthetic capacity of current leaf area was also possibly increasing. Sim-ilar relationships have been found in an oak forest (Granier and Breda, 1996), an aspen forest (Blanken
Fig. 6. Daily surface conductance during leaf expansion for all 3 years as a function of leaf area index. The line is the least-squares regression (intercept= −7.0 mmol m−2s−1,
slope=62.6 mmol m−2s−1,R2=0.81).
et al., 1997) and a Japanese grassland (Saigusa et al., 1998).
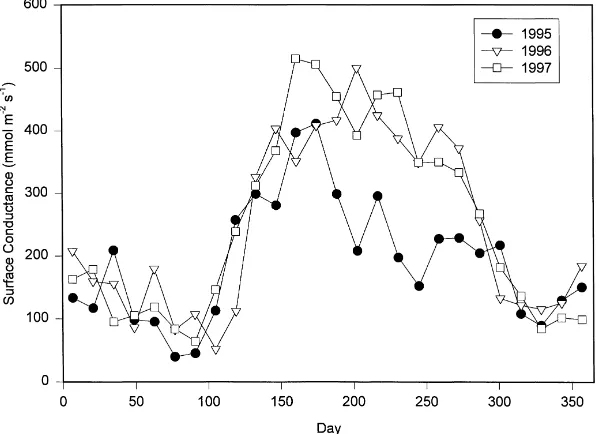
Typical hourly maximum dry surface conductances over the 3-year period were about 700 mmol m−2s−1,
which is within typical values found for deciduous and coniferous forests (Kelliher et al., 1995). For the mid-summer period when leaf area is nearly constant, changes in surface conductance are assumed to largely reflect changes in stomatal conductance. Fig. 7 shows the 2-week averages of surface conductance for the 3 years calculated from (2). Typical 2-week averages of surface conductance for most of the growing season
were around 400 to 500 mmol m−2s−1 in 1996 and
1997. In the drought year (1995) surface conductance was only about one-half or less these values from July through the remainder of the season.
Fig. 7. Two-week averages of the surface conductance for each of the 3 years. ‘Day’ on thex-axis is the center point of the two-week average.
soil moisture was plentiful but soil water content con-trolled conductance as the soil dried.
3.9. Biological control of evapotranspiration
Likely due to stomatal closure, surface conduc-tance was significantly less during the summer of 1995 compared to the other years, which tended to decrease evapotranspiration. Alternatively, the hu-midity deficit was also greater in 1995, which alone should increase evapotranspiration. Although it is not possible to completely separate biotic and abiotic in-fluences, this shows the presence of annual variability in both the ‘biological’ and climatological parameters that drive evapotranspiration. A significant hydro-logical and meteorohydro-logical question is the relative importance of biological and climate parameters in creating seasonal and interannual variability. If atmo-spheric demand is the primary control of variability, then evapotranspiration between years could be esti-mated directly from radiation and humidity deficits, while changes in phenology, drought physiology and stomatal responses could be treated peripherally. Alternatively, if biological responses are needed to adequately estimate annual evapotranspiration, then
accurate representations of phenology and stomatal response are necessary.
Control by atmospheric demand will be defined as the effect of net radiation (Rn) and ambient
humid-ity deficit above the canopy (D) on evapotranspiration between years. The net radiation and humidity deficit contributions will be evaluated separately. Biological control will be assessed from changes in evapotran-spiration due to surface conductance. In this analysis, the Penman–Monteith equation is written (Jarvis and McNaughton, 1986):
E=Eeq+(1−)ρGcD+Ib (3)
where LEeq=ε/(ε+1) Rn is the equilibrium
evaporation. The imbalance term Ib=[ε/(ε+1)
(Rn−G−Cs−H−LE)] is not normally part of the Penman–Monteith equation, but arises because the calculation of surface conductance in (1) is based on the measured Bowen ratio and not net radiation. More simply, it represents the measurement error
due to non-closure of the energy balance. is the
‘decoupling coefficient’:
= 1
+ε
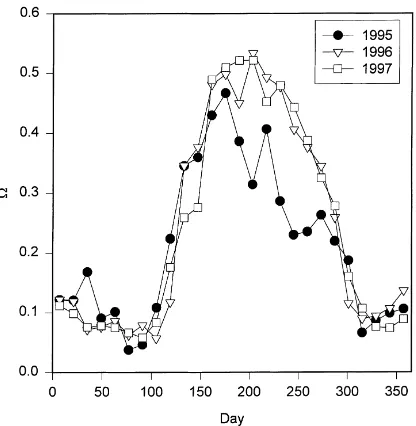
Fig. 8. Two-week average of the decoupling coefficient for each of the 3 years. ‘Day’ on thex-axis is the center point of the 2-week average.
Average 2-week values for the decoupling coefficient on days with no precipitation are shown in Fig. 8. Small values of, typical for coniferous forests,
indi-cate that evapotranspiration is highly sensitive to sur-face conductance and ambient humidity deficit. High values of , typical of agricultural species, indicate that evapotranspiration is more sensitive to net
radi-ation. Average mid-summer values of are around
0.5 in 1996 and 1997, suggesting that the sensitivity of evapotranspiration to relative changes in humid-ity deficit, stomatal conductance and net radiation are similar. This forest is less sensitive to surface conduc-tance than some other broadleaved forests (Meinzer, 1993; Herbst, 1995; Granier and Breda, 1996) and especially coniferous forests (Kelliher et al., 1993;
Meinzer, 1993). Values of for tropical forests are
greater than those in other forest types, including the
forest in our study (Meinzer, 1993). In 1995,was
smaller and surface conductance and humidity deficit exerted greater control over evapotranspiration. For
the moment we assumeandρare constant, and the
total derivative of (3) is:
dE= ∂E
An approximate form of (5) can be used to estimate the
cause of variability inE(1E) between two different years:
and Ib between two different years and the overbar represents the mean between the 2 years. The partial derivatives and differences were evaluated for each 2-week period during the seasons using the 2-week averages ofGc,Ga,Rn,D,εand Ib. For each 2-week
period of each year the four terms on the right-hand side of (6) were obtained from the partial derivatives of (3).
Since 1997 had the highest rates of evapotranspi-ration, (6) was used to evaluate the processes [three terms on right on side of (6)] or measurement error [fourth term in (6)] that reduced evapotranspiration in the drought year of 1995. Although this analysis is clearly an approximation, for each two week period the four terms on the right-hand side of (6) were very similar to the measured differences in evapotranspira-tion (1E).
The first term on the right-hand side represents the difference in evapotranspiration between the two sea-sons due to changes in surface conductance. The sec-ond term is the difference in evapotranspiration due to differences in the humidity deficit, while the third term is the difference in evapotranspiration due to changes in net radiation. The last term represents an error due to lack of energy balance closure in the measurements. Note that each of the four terms in (6) is the prod-uct of a sensitivity and a difference. While the rela-tive sensitivity of evapotranspiration toGc,DandRn
were fairly similar for much of the growing season (was often near 0.5), the actual difference between
years also depends on the how these variables change between years.
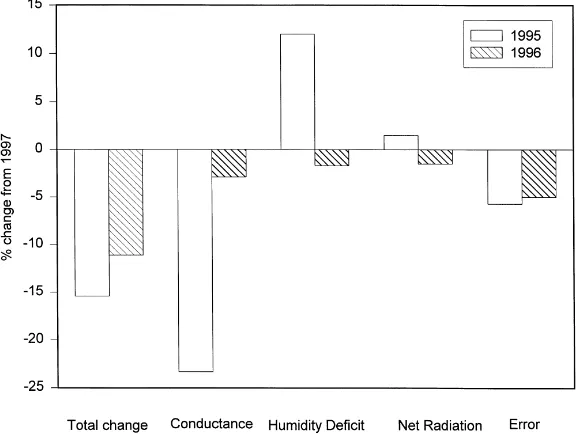
Fig. 9. The percent change in dry canopy evapotranspiration rate (mm h−1) in 1995 and 1996 compared to 1997 (bar labeled ‘Total
change’). Also shown is the percent change in evapotranspiration rate (mm h−1) derived analytically from (6) due to changes in surface
conductance, humidity deficit, net radiation and energy balance closure errors.
by 15.4% in 1995 and by 9.9% in 1996 compared to 1997 (Fig. 9). Fig. 10 shows the magnitude of the four terms evaluated on a 2-week basis between 1995 and 1997. For the entire season, the reduction in evapo-transpiration during 1995 compared to 1997 was pri-marily due to a reduced surface conductance, espe-cially during the middle and late summer (Figs. 9 and 10). If the only difference between the seasons had been the surface conductance, dry-canopy evapotran-spiration would have been reduced by approximately 23.3% in 1995 to that in 1997 (Fig. 9). With this in-terpretation, we can approximate a 23% decrease in evapotranspiration in 1995 to ‘biological’ control.
Counteracting this effect, the humidity deficit was larger in 1995 than in 1997, especially during the mid-summer period when the surface conductance was smaller (Fig. 10). If the only difference between the two years had been the increase in humidity deficit, evapotranspiration would have been about
12.5%greater in 1995 than in 1997 (Fig. 9).
There-fore, controls by surface conductance and humidity deficit strongly opposed each other, consistent with model simulations performed over the 1995 season (Baldocchi, 1997). Net radiation was greater in 1995
and this affect is estimated to have increased evap-otranspiration in 1995 by 1.5% compared to 1997 (Figs. 9 and 10). The error term due to the energy imbalance was responsible for a 5.6% decrease in the measured evapotranspiration in 1995 relative to 1997 (Figs. 9 and 10).
esti-Fig. 10. The four terms on the right-hand side of Eq. (6) evaluated for each two-week period between 1995 and 1997 when the canopy was dry. The total measured difference in the average rate of evapotranspiration between the 2 years is also shown. ‘Day’ on thex-axis is the center point of the 2-week average.
mated to be 23.3%−11.5%=11.8%. Alternatively, if
the humidity deficit is determined independent of sur-face conductance (e.g. synoptic scale advection) then biological control is roughly 23%. In reality the ex-tent of feedback on the mixed layer is likely between the two scenarios presented here, but these two ex-tremes set reasonable bounds on the extent that sur-face conductance reduced dry-canopy evapotranspira-tion in 1995 relative to 1997. As suggested from this analysis, biological control decreases when the humid-ity deficit is determined more by regional scale feed-backs (McNaughton and Jarvis, 1991; Jacobs and De Bruin, 1991) than by advection (McNaughton, 1976; Shuttleworth and Calder, 1979).
3.10. Priestly–Taylor Coefficient
Evapotranspiration is often normalized to the equi-librium value in (3) (α=E/Eeq) as a way of comparing
measured evaporation to a climatological expectation
assuming a closed volume and constant net radiation over a ‘wet’ surface (McNaughton and Jarvis, 1983). It could then be suggested that deviations from ‘wet’ sur-face evaporation are attributable to limiting physiolog-ical constraints (stomatal conductance) or to advective processes that prevents equilibrium conditions. Evapo-transpiration rates greater than equilibrium (α> 1) can
occur through horizontal advection (Singh and Taille-fer, 1986) or mixed layer entrainment (Culf, 1994). Although there is no basis for expectingαto converge
to any theoretical limit, measurements and modeling
studies indicate thatαis commonly somewhat greater
than one (between 1.1–1.4) for well-watered crops or ‘wet’ surfaces (Lindroth, 1985; McNaughton and Spriggs, 1989; Lhomme, 1997; Kim and Entekhabi, 1997). At our site, typical maximum growing season
values of α during days with rainfall (wet canopy)
were around 1.1, rarely exceeding 1.3.
Fig. 11 shows the daily daytime (Rn> 0) value
of α against dry surface conductance for the three
seasons. The symbols represent four different pheno-logical stages of the canopy (dormant, leaf expansion occurring, mid-season, senescent) along with data from the stress period during 1995. Variability ofα, or deviations from the idealized ‘wet surface’, are created largely by changes in surface conductance, which we have shown to be related to changes in leaf area and stomatal conductance. Model sensitivity studies also show thatαis a function of the product
of photosynthetic capacity and leaf area index until a threshold of this product is reached (Baldocchi and Meyers, 1998). During the FIFE study, both spatial and temporal variability inαwere a function of leaf area and soil water content (Chen and Brutsaert, 1995) The daily value ofαrarely exceeds one at any time of the year, suggesting that the equilibrium value ap-proximately establishes an upper limit to dry canopy evapotranspiration for this forest. In the model simula-tions of McNaughton and Spriggs (1989) and Kim and Entekhabi (1997),αbecame insensitive to surface con-ductance when surface concon-ductance exceeded about
700 mmol m−2s−1. Maximum daily surface
conduc-tances at our site are just below those thresholds, and surface conductance appears to limitαduring all
phe-nological stages (Fig. 11).
Usingαas a tool for comparison between sites has
the advantage of normalizing sites against equilibrium rates determined primarily by net radiation. The
‘day-time mean’αwas 0.91 during one growing season at
the aspen boreal site (Blanken et al., 1997), which is greater than our three-year growing season ‘daytime mean’ value (0.70) (Table 1). The twenty four-hour
α at a tropical rainforest was 0.91 for 9-day period
(Shuttleworth et al., 1984), greater than the 24 h value at our forest (0.80) during the growing season (Table 1). Since the error in energy balance closure at our site could account for these small differences it is not certain to what extent these studies actually contrast with ours.
4. Summary and conclusion
Based on 3 years of analysis, interannual variability of evapotranspiration at this site was about 10–15% of the 3-year mean (567 mm). Over the study period, the latent heat flux was about 30% greater than sensible heat (annual Bowen ratio averaged 0.72), but the
rel-ative partitioning at any given time was strongly de-pendent on whether leaves were present or not. Evap-otranspiration at this site was still typically less than equilibrium during all periods, except when the canopy was wet. Interannual variability was determined pri-marily by drought and corresponding annual differ-ences in surface conductance, with smaller infludiffer-ences by annual differences in net radiation and phenology. However, the effect of drought on evapotranspiration was probably decreased significantly due to feedbacks on the mixed layer humidity deficit.
Characterizations of bulk parameters at specific sites have potential benefits for identifying and quan-tifying exchange processes across the globe. Because of the complexity in representing canopy architecture, turbulence and physiology for the entire globe, bulk parameters are useful characterizations of exchange processes (Sellers et al., 1992; Jarvis, 1995; Kelli-her et al., 1995). As longer term data sets become available it should be possible to examine whether these parameters are functions of other more fun-damental scaling parameters within the ecosystem such as leaf area, soil moisture, leaf nitrogen, length of growing season and precipitation ratio (precipita-tion/equilibrium evaporation) (Baldocchi and Meyers, 1998). The best approach will be combining analysis of continuous data sets along with canopy exchange models and physiological and boundary layer studies to demonstrate the links between these processes.
Acknowledgements
This work was funded by a grant from NASA/ GEWEX and the U.S. Department of Energy (Ter-restrial Carbon Program) and is a contribution to the Ameriflux and FLUXNET projects. Eva Falge con-tributed useful insights and some data analysis. Mark Brewer, Mark Hall and David Auble provided field and laboratory assistance. Paul Hanson and Don Todd provided the litter basket data. Stan Wullschleger reviewed an earlier version of the manuscript.
References
Bernhofer, Ch., Clement, R., Elbers, J., Granier, A., Grünwald, T., Morgenstern, K., Pilegaard, K., Rebmann, C., Snijders, W., Valentini, R., Vesala, T., 1999. Estimates of the annual net carbon and water exchange of European forests: the EUROFLUX methodology. Adv. Ecol. Res., in press. Auble, D.L., Meyers, T.P., 1992. An open path, fast response
infrared absorption gas analyzer for H2O and CO2. Boundary
Layer Meteorol. 59, 243–256.
Baldocchi, D.D., Hicks, B.B., Meyers, T.P., 1988. Measuring biosphere-atmosphere exchanges of biologically related gases with micrometeorolgical methods. Ecology 69, 1331–1340. Baldocchi, D.D., 1997. Measuring and modelling carbon dioxide
and water vapour exchange over a temperate broad-leafed forest during the 1995 summer drought. Plant Cell Environ. 20, 1108– 1122.
Baldocchi, D.D., Meyers, T.P., Evaporation, I., 1991. Trace gas exchange at the floor of a deciduous forest, CO2 efflux. J.
Geophys. Res. 96, 7271–7285.
Baldochhi, D.D., Harley, P.C., 1995. Scaling carbon dioxide and water vapour exchange from leaf to canopy in a deciduous forest II. Model testing and application. Plant, Cell Environ. 18, 1157–1173.
Baldocchi, D.D., Vogel, C.A., 1996. Energy and CO2flux densities
above and below a temperate broad-leaved forest and a boreal pine forest. Tree Physiol. 16, 5–16.
Baldocchi, D.D., Meyers, T.P., 1998. On using eco-physiological, micrometeorological and biogeochemical theory to evaluate carbon dioxide, water vapor and trace gas fluxes over vegetation: a perspective. Agricul. Forest Meteorol., in press.
Baldocchi, D.D., Vogel, C.A., Hall, B., 1997. Season variation of energy and water vapor exchange rates above and below a boreal jack pine forest. J. Geophys. Res. 102 (D24), 28939– 28951.
Black, T.A., Hartog, G.Den, Neumann, H.H., Blanken, P.D., Yang, P.C., Russell, C., Nesic, Z., Lee, X., Chen, S.G., Staebler, R., Novak, M.D., 1996. Annual cycles of water vapour and carbon dioxide fluxes in and above a boreal aspen forest. Global Change Biol. 2, 219–229.
Blanken, P.D., Black, T.A., Yang, P.C., Neumann, H.H., Nesic, Z., Staebler, R., Hartog, G.den, Novak, M.D., Lee, X., 1997. Energy balance and surface conductance of a boreal aspen forest: Partitioning overstory and understory components. J. Geophys. Res. 102 (D24), 28915–28927.
Brutsaert, W., 1982. Evaporation into the Atmosphere. D. Reidel, Dordrecht, 299 pp.
Chen, D., Brutsaert, W., 1995. Diagnostics of land surface spatial variability and water vapor flux. J. Geophys. Res. 100 (D12), 25595–25606.
Culf, A.D., 1994. Equilibrium evaporation beneath a growing convective boundary layer. Boundary Layer Meteorol. 70, 37– 49.
Davis, K.J., Lenschow, D.H., Oncley, S.P., Kiemle, C., Ehret, G., Giez, A., Mann, J., 1997. Role of entrainment in surface-atmosphere interactions over the boreal forest. J. Geophys. Res. 102, 29219–29230.
Dirmeyer, P.A., 1994. Vegetation as a feedback mechanism in midlatitude drought. J. Climate 7, 1463–1483.
Goulden, M.J., Daube, B.C., Fan, S.M., Sutton, D.J., Bazzaz, A., Munger, J.W.S., Wofsy, S.C., 1997. Physiological responses of a black spruce forest to weather. J. Geophys. Res. 102, 28987– 28996.
Granier, A., Breda, N., 1996. Modelling surface conductance and stand transpiration of an oak forest from sap flow measurements. Ann. Sci. For. 53, 537–546.
Granier, A., Loustau, D., 1994. Measuring and modelling the transpiration of a maritime pine canopy from sapflow data. Agric. For. Meteorol. 71, 61–81.
Greco, S., Baldocchi, D.D., 1996. Seasonal variations of CO2and
water vapour exchange rates over a temperate deciduous forest. Global Change Biol. 2, 183–197.
Freedman, J.M., Fitzjarrald, D.R., Moore, K.E., Sakai, R.K., 1998. Boundary layer cloud climatology and enhanced forest-atmosphere exchange. Proceedings for the 23rd conference on Agricultural and Forest Meteorol., American Meteorological Society.
Ham, J.M., Knapp, A.K., 1998. Fluxes of CO2, water vapor, and
energy from a prairie ecosystem during the season transition from carbon sink to carbon source. Agric. For. Meteorol. 89, 1–14.
Herbst, M., 1995. Stomatal behaviour in a beech canopy: an analysis of Bowen ratio measurements compared with porometer data. Plant, Cell Environ. 18, 1010–1018. Hutchison, B.A., Matt, D.R., McMillen, R.T., Gross, L.J.,
Tajchman, S.J., Norman, J.M., 1986. The architecture of a deciduous forest canopy in eastern Tennessee, USA. J. Ecol. 74, 635–646.
Jacobs, C.M.J., De Bruin, H.A.R., 1991. The sensitivity of transpiration to land-surface characteristics: significance of feedback. J. Climate 5, 683–698.
Jacobs, C.M.J., De Bruin, H.A.R., 1997. Predicting regional transpiration at elevated atmospheric CO2: influence of the
PBL-vegetation interaction. J. Appl. Meteorol. 36, 1663–1675. Jaeger, L., Kessler, A., 1997. Twenty years of heat and water balance climatology at the Hartheim pine forest, Germany. Agric. For. Meteorol. 84, 25–36.
Jarvis, P.G., 1995. Scaling processes and problems. Plant, Cell Environ. 18, 1079–1089.
Jarvis, P.G., McNaughton, K.G., 1986. Stomatal control of transpiration: scaling up from leaf to region. Adv. Ecol. Res. 15, 149.
Jarvis, P.G., Massheder, J.M., Hale, S.E., Moncrieff, J.B., Rayment, M., Scott, S.L., 1997. Seasonal variation of carbon dioxide, water vapor, and energy exchanges of boreal black spruce forest. J. Geophys. Res. 102 (D24), 28953–28966.
Johnson, D.W., van Hook, R.I. (Eds.), 1989. Analysis of Biogeochemical Cycling Processes in Walker Branch Watershed. Springer, New York.
Kelliher, F.M., Leuning, R., Shulze, E.-D., 1993. Evaporation and canopy characteristics of coniferous forests and grasslands. Oecologia 95, 153–163.
Kelliher, F.M., Leuning, R., Raupach, M.R., Shulze, E.-D., 1995. Maximum conductances for evaporation for global vegetation types. Agric. For. Meteorol. 73, 1–16.
Sogatchev, A., Varlargin, A., Ziegler, W., Arneth, A., Bauer, G., 1997. Evaporation for an eastern Siberian larch forest. Agric. For. Meteorol. 85, 135–147.
Kim, C., Entekhabi, D., 1997. Examination of two methods for estimating regional evaporation using a coupled mixed layer and land surface model. Water Resources Res. 33, 2109–2116. Lhomme, J.-P., 1997. An examination of the Priestly–Taylor equation using a convective boundary layer model. Water Resources Res. 33, 2571–2578.
Lindroth, A., 1985. Seasonal and diurnal variation of energy budget components in coniferous forests. J. Hydrol. 82, 1–15. Lu, P., Biron, P., Breda, N., Granier, A., 1995. Water relations of
adult Norway Spruce trees under soil drought: water potential, stomatal conductance and transpiration. Ann. Sci. For. 52, 117– 129.
Luxmoore, R.J., Grizzard, T., Patterson, M.R., 1981. Hydraulic properties of Fullerton cherty silt loam. Soil Sci. Soc. Am. J. 45, 692–698.
McNaughton, K.G., 1976. Evaporation and advection II: evaporation downwind of a boundary separating regions having different surfaces resistances and available energies. Quart. J. R. Meteorol. Soc. 102, 193–202.
McNaughton, K.G., Jarvis, P.G., 1983. Predicting the effects of vegetation changes on transpiration and evporation. In: Kozlowski, T.T. (Ed.), Water Deficits and Plant Growth. Vol VII. Academic Press, New York, pp. 1–47.
McNaughton, K.G., Spriggs, T.W., 1989. An evaluation of the Priestly–Taylor equation from the complementary relationship using results from a mixed-layer model and the convective boundary layer in Estimation of Areal Evapotranspiration, IAHS publication 177.
McNaughton, K.G., Jarvis, P.G., 1991. Effects of spatial scale on stomatal control of transpiration. Agric. For. Meteorol. 54, 279–302.
McMillen, R.T., 1988. An eddy correlation technique with extended applicability to non-simple terrain. Boundary Layer Meteorol. 43, 231–245.
Meinzer, F.C., 1993. Stomatal control of transpiration. Tree 8, 289–294.
Moore, K.E., Fitzjarrald, D.R., Sakai, R.K., Goulden, M.L., Munger, J.W., Wofsy, S.C., 1996. Season variation in radiative and turbulent exchange at a deciduous forest in central Massachussets. J. Appl. Meteorol. 35, 122–134.
Paw, U.K.T., Meyers, T.P., 1989. Investigations with a higher order canopy turbulence model into mean source-sink levels and bulk canopy resistances. Agric. For. Meteorol. 47, 259–271. Peters, L.N., Grigal, D.F., Curlin, J.W., Selvidge, W.J., 1970.
Walker Branch watershed project: Chemical, physical and morphological properties of the soils of Walker Branch
watershed. Ecological Sciences Division, ORNL-TM-2968, Oak Ridge National Laboratory.
Priestly, C.H.B., Taylor, R.J., 1972. On the assessement of surface heat flux and evaportaion using large-scale parameters. Monthly Weather Rev. 100, 81–92.
Raupach, M.R., Finnigan, J.J., 1988. Single-layer models of evaporation from plant canopies are incorrect but useful, whereas multilayer models are correct but useless: Discuss. Austr. J. Plant Physiol. 15, 705–716.
Raupach, M.R., 1995. Vegetation-atmosphere interaction and surface conductance at leaf, canopy and regional scales. Agric. For. Meteorol. 73, 151–179.
Saigusa, N., Takehisa, O., Liu, S., 1998. Seasonal variations of the exchange of CO2 and H2O between a grassland and the
atmosphere: an experimental study. Agric. For. Meteorol. 89, 131–139.
Schwartz, M.D., 1996. Examining the spring discontinuity in daily temperature ranges. J. Climate 9, 803–808.
Sellers, P.J., Heiser, M.D., Hall, F.G., 1992. Relations between surface conductance and spectral vegetation indices at intermediate length (100 m2 to 15 km2) length scales. J.
Geophys. Res. 97, 19,033–19,059.
Seth, A., Giorgi, F., 1996. Three-dimensional model study of organized mesoscale circulations induced by vegetation. J. Geophys. Res. 101 (D3), 7371–7391.
Shuttleworth, W.J., Calder, I.R., 1979. Has the Priestly–Taylor equation any relevance to forest evaporation?. J. Appl. Meteorol. 18, 639–646.
Shuttleworth, W.J., Gash, J.H.C., Lloyd, C.R., Moore, C.J., Roberts, J., Filho, A.D.O.M., Fisch, G., Filho, V.D.P.S., Ribeiro, M.D.N.G., Molion, L.C.B., Sa, L.D.D.A., Nobre, J.C.A., Cabral, O.M.R., Patel, S., Moraes, J.C.D., 1984. Eddy correlation measurements of energy partition for Amazonian forest. Quart. J. R. Meteorol. Soc. 110, 1143–1162.
Singh, B., Taillefer, R., 1986. The effect of synoptic-scale advection on the performance of the Priestly–Taylor evaporation formula. Boundary Layer Meteorol. 36, 267–282.
Tajchman, S.J., Fu, H., Kochenderfer, J.N., 1997. Water and energy balance of a forested Appalachian watershed. Agric. For. Meteorol. 84, 61–68.
Thom, A.S., 1972. Momentum, mass and heat exchange of vegetation. Quart. J. R. Meteorol. Soc. 98, 124–134. Verma, S.B., Baldocchi, D.D., Anderson, D.E., Matt, D.R.,
Clement, R.J., 1986. Eddy fluxes of CO2, water vapor and
sensible heat over a deciduous forest. Boundary Layer Meteorol. 36, 71–91.