Plant succession in perennial grass strips and effects on the
diversity of leafhoppers (Homoptera, Auchenorrhyncha)
Erja Huusela-Veistola
∗, Arja Vasarainen
Plant Production Research, Plant Protection, Agricultural Research Centre, FIN- 31600 Jokioinen, Finland
Received 4 June 1999; received in revised form 30 November 1999; accepted 24 January 2000
Abstract
The biodiversity of agroecosystems may be enhanced by increasing species richness and structural diversity of vegetation by creating perennial strips. Aims of the study were (1) to describe the plant succession of perennial strips in northern conditions; (2) to clarify the difference in insect fauna between cereal fields and perennial strips; (3) to determine the effect of succession on leafhoppers in perennial strips; and (4) to compare the leafhopper fauna of perennial strips with that of other uncultivated biotopes. Three perennial grass strips (12 m wide, 420 m long) were sown in the middle of cereal fields (15 ha) in 1991 with a seed mixture of timothy (Phleum pratense), meadow fescue (Festuca pratensis), red clover (Trifolium pratense) and white clover (Trifolium repens). The perennial strips were not mown or renewed after the establishment. In 1992 and 1993 barley and in 1994 spring wheat were grown in the surrounding fields.
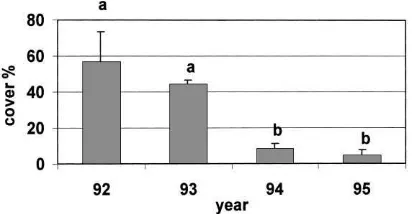
The composition of plant cover in the grass strips changed over four seasons. The total number of plant species decreased from 23 species in 1992 to 10 in 1995. The change resulted from the dramatic decrease of annual weeds after the first year. Furthermore, the total plant cover declined slightly. The cover of P. pratense increased, whereas that of T. pratense and T.
repens decreased. The plant species typical of early succession were annual weeds including Tripleurospermum inodorum
and Thlaspi arvense. In the last year, perennial weeds such as Cirsium arvense and Elymus repens became common. Leafhopper abundance and species number were higher in perennial grass strips than in cereal fields. Furthermore, the species composition varied between habitats. Year-to-year fluctuations in leafhopper catches were large. Leafhopper abundance and diversity (Shannon index) were highest in 1993 when 192 sweep net samples contained a total 4680 specimens belonging to 37 species. The plant species richness of the grass strips did not correlate with the abundance and species richness of leafhoppers, which seemed to be more dependent on other factors. Although the plant species number in grass strips decreased clearly during succession, changes in species richness of leafhoppers were not so great. Factors affecting the leafhopper community are discussed. © 2000 Elsevier Science B.V. All rights reserved.
Keywords: Auchenorrhyncha; Biodiversity; Succession; Grass strip; Finland
∗Corresponding author. Tel.:+358-3-41881; fax:+358-3-4188-2584.
E-mail address: [email protected] (E. Huusela-Veistola)
1. Introduction
Intensive agriculture has changed the agricultural landscape. Crops are grown in large fields as mono-cultures, and natural habitats have decreased. Today, more attention is paid to the diversification of agroe-cosystems and different management practices, e.g.
perennial strips, have become more and more popu-lar (Nentwig, 1989; Thomas et al., 1992). The main purpose of the strips is to increase the numbers of natural enemies and their potential for natural control. Furthermore, the biodiversity of agroecosystem in-cluding the insect diversity is enhanced by increasing the species richness and structural diversity of plants (Murdoch et al., 1972; Lawton, 1983). A diversified plant community offers more microhabitats and fac-ultative host species for herbivores and increases the abundance of alternative prey species for polyphagous predators (Andersson, 1990). Therefore it is supposed that strips can increase the biodiversity of fields. An-other important function of perennial strips is to act as a buffer zone for decreasing erosion and leaching of nutrients.
Compared with cultivated fields, which are ecosys-tems maintained by human activity at an early stage of succession (Ryszkowski, 1979), perennial strips and other man-made semi-natural habitats may change during succession. A change in the species composition and structure of vegetation changes the environment of insects (e.g. microclimates, food sup-plies and hiding places). Therefore long-term studies concerning insect fauna and succession of strips are required.
Because it is not feasible to determine the biodi-versity of the wider insect fauna in the agroecosys-tem, the study concentrated on leafhoppers (Hom., Auchenorrhyncha). The effects of perennial strips on polyphagous predators are presented elsewhere (Huusela-Veistola, 1998). Auchenorrhyncha is one of the best known taxa in the fields in Finland, and over 60 species occur in cereals (Raatikainen, 1971, 1972; Raatikainen and Vasarainen, 1971, 1973, 1976). Leafhoppers are an important insect group in the field ecosystem and are herbivorous (sap-feeding) and day-active insects. Most species in cereal fields are oligophagous and their main host plants are gramineous species. They damage plants directly by feeding or indirectly as vectors of a variety of plant pathogens, e.g. oat sterile dwarf virus (Raatikainen, 1970). Natural enemies include insect predators and parasitoids (Waloff, 1980), but leafhoppers are also food for many other animals, e.g. birds and shrews in the agroecosystem. Therefore, a diverse leafhopper fauna may support a greater general diversity of the agroecosystem.
The aims of the study were
1. to describe the plant succession of perennial strips in northern conditions where short growing sea-sons and snowy winters are typical;
2. to clarify the difference in insect fauna between cereal and grass strips (e.g. do strips increase leafhopper diversity in the field ecosystem?); 3. to determine the effect of succession on
leafhop-pers in perennial strips (e.g. do strips have only a short-term effect on leafhopper diversity?); and 4. to compare the leafhopper fauna of perennial
strips with that of other uncultivated biotopes.
2. Materials and methods
2.1. Experimental design
The effects of perennial grass strips on the insect fauna in the cereal ecosystem were studied within the Nummela project in 1992–1995 at the Institute of Plant Protection, Agricultural Research Centre of Fin-land (Huusela-Veistola, 1998). In a large-scale field experiment, the effects of two pesticide regimes (con-ventional and reduced) and two cultivation systems (customary, integrated system) of cereal production on insect fauna were studied (Huusela-Veistola and Kurppa, 1996; Huusela-Veistola, 1996, 1998). Addi-tional elements constituted the perennial grass strips, the purpose of which was to increase habitat diversity. The experimental field was situated on the Num-mela Experimental Farm of MTT in Jokioinen (60◦52′N, 23◦25′E) about 120 km north-west of Helsinki. Before the field experiment, fields were un-der conventional grain and grass production and cattle pasture. The perennial grass strips (12 m wide, 420 m long) were situated in the middle of cereal fields (15 ha). In practice, three individual strips were sown in 1991 with a ‘green fallow seed mixture’ which consisted of timothy (Phleum pratense L.), meadow fescue (Festuca pratensis Hudson), red clover
(Tri-folium pratense L.) and white clover (T. repens L.).
The perennial strips were not mown or renewed af-ter the establishment. A 4 m wide strip of Phacelia
tanacetifolia Bentham was added beside the shelter
the surrounding fields. The layout of the experiment is described in Huusela-Veistola (1998).
In 1991, the leafhopper fauna from adjacent biotopes was monitored covering eight (seven in oats) sampling dates from 18 June to 7 August 1991. Sam-ples were taken from cultivated fields (oats, oats and grass, winter wheat, grassland) as well as from un-cultivated biotopes (abandoned field, headland, ditch bank, edge of forest) in Jokioinen near the strip study sites.
2.2. Botanical composition of grass strips
Each strip was divided into two blocks accord-ing to the field plot experiment when samples were taken and analysed. In July each year eight sam-ple squares (1 m2) per block were analysed from the perennial grass strips. Percentages of total plant cover and species composition were estimated visu-ally altogether from 16 samples per individual strip. Furthermore, plant species found outside the sample squares were listed.
2.3. Monitoring of arthropods
Leafhoppers in the grass strips and the fields were collected with sweep nets. The diameter of the net was 30 cm and one sweep net sample consisted of 60 sweeps. Four sweep net samples per block were taken from the grass strips and from cereal fields. In 1992, only one sample per block was taken from the grass strips. In 1995, only perennial strips from four blocks were swept. The distance between cereal and grass samples was 50 m. Table 1 gives details of the sampling programme.
After capture, the samples were frozen for a day and the leafhoppers were removed to 70% alcohol for stor-age. Leafhoppers were identified to species and poly-morphic species to morphs. Because juveniles could not be identified reliably, the analysis was limited to adult catches only. Macrosteles sp. females could not be determined by species and they were allocated to ‘separate species’ in the analysis. Generally they could be divided into species in the same ratios as their males (Raatikainen and Vasarainen, 1971), but this could not be done as there were no males in the sample. The nomenclature of Auchenorrhyncha complied with Ossiannilsson (1983).
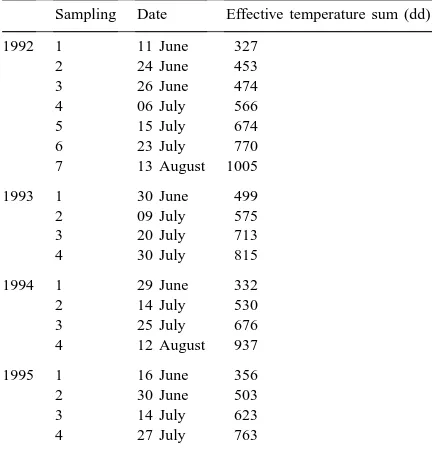
Table 1
Leafhopper sampling programme and effective temperature sum>+5◦C (day degrees) in 1992–1995a
Sampling Date Effective temperature sum (dd)
1992 1 11 June 327
aIn 1995, samples taken only from grass strips.
2.4. Statistical analyses
In the plant data, dependent variables were total plant cover, cover of individual plant species, species richness, diversity (Shannon H′= −6pilnpi where pi is the proportion of ith species in the pooled data)
and evenness (HillE′=(6pi2)−1/expH′). Total catch of leafhoppers, species richness, abundance of indi-vidual species, diversity (Shannon H′) and evenness (Hill E′) were dependent variables in the leafhop-per data. For statistical analysis the data was log- or arcsin(square root)-transformed as necessary to sat-isfy the conditions of normality and homogeneity of variances.
Effective temperature sum (>+5◦C) of the growing
Fig. 1. Number of plant species (mean±S.D.) in perennial strips in 1992–1995. Years with different letters differed significantly, p<0.05 (Tukey’s test).
model, year and period were fixed factors and strip and block(strip) and their interactions were random factors. Satterthwaite’s approximation was used in de-grees of freedom if one of the covariance parameter estimates was zero. If the main effects were statisti-cally significant in ANOVA, Tukey’s HSD test was used to determine significances between levels.
Patterns in whole assemblages were investigated through CANOCO (Ter Braak, 1987) by applying de-trended correspondence analysis (DCA) to plant and leafhopper data. DCA is a divisive ordination tech-nique which is based on reciprocal averaging (Hill and Gauch, 1980). Before the analysis, the data was pooled by blocks.
Similarities of leafhopper communities between dif-ferent habitats were studied using index of percentage similarity by Renkonen (1938) (PS=6min(pij, pik)
where pij is the proportion of species i in sample j).
Table 2
Percentages of plant cover and diversity in grass strips (mean±standard deviation)a
Mean±S.D.
1992 1993 1994 1995 df F P
Phleum pratense (%) 7.6±4.5 a 16.5±3.2 a 34.3±4.8 b 34.6±7.4 b 3, 8 30.52 0.0001 Festuca pratensis (%) 12.0±3.4 18.1±5.5 22.8±9.1 15.0±5.6 3, 6.46 3.51 0.0834 Trifolium repens (%) 13.4±5.7 a 11.7±6.1 a 0±0 b 0.3±0.5 b 3, 6 43.98 0.0002 Trifolium pratense (%) 36.5±18.4 a 29.9±7.1 ab 6.0±9.1 bc 0.3±0.5 c 3, 7.39 9.70 0.0060
Total plant cover (%) 78.2±12.1 a 78.0±7.3 a 65.2±8.5 b 57.0±13.4 b 3, 15 15.61 0.0001
Shannon’s H′ 1.47±0.27 a 1.41±0.10 ab 0.98±0.14 ab 0.92±0.24 b 3, 8 6.3 0.0168 Hill’s E′ 0.76±0.11 0.88±0.03 0.88±0.04 0.86±0.05 3, 6 2.6 0.1478
aVariation between years was tested by ANOVA, differences between pairs of years was tested by Tukey’s test (means with the same letter are not significantly different). Satterthwaite’s approximation used in degrees of freedom.
3. Results
3.1. Succession of perennial strips
The composition of plant cover in grass strips chan-ged over the four seasons. Species number decreased dramatically during succession (Fig. 1, ANOVA df=3, 6, F=28.28, p<0.001). The total number of plant species in sample squares decreased from 23 species in 1992 to 10 in 1995. The change was caused by a dramatic decrease of annual weeds after the first year. Furthermore, the total plant cover decreased from 78 to 57%. The cover of Phleum pratense increased from 8 to 35%, whereas that of Trifolium pratense and T.
repens decreased dramatically (Table 2). The nearly
total disappearance of the Trifolium species during winter 1993–1994 was probably caused by voles (Arvo Myllymäki, personal communication, 1999). The cover of Festuca pratensis did not change signif-icantly during the experiment (Table 2). Overall, the percentage of monocotyledons increased during suc-cession (Fig. 2, ANOVA df=3, 6, F=28.28, p<0.001), whereas the percentage of dicotyledons decreased (Fig. 3, ANOVA df=3, 8, F=25.69, p<0.001). Gen-erally, the plant composition of the first 2 years (1992 and 1993) differed from the last 2 years (1994 and 1995). In the last year (1995) the plant cover was dominated by P. pratense. Diversity (Shannon H′) decreased during succession, but evenness (Hill E′) did not differ among years (Table 2).
Fig. 2. Cover of monocotyledons (mean±S.D.) in perennial strips in 1992–1995. Years with different letters differed significantly, p<0.05 (Tukey’s test).
species, Trifolium sp. were typical in the beginning and
P. pratense dominated in the last 2 years. The plant
species typical of early succession were annual weeds such as Tripleurospermum inodorum Shultz Bip. and
Thlaspi arvense L. In the last year, perennial weeds
including Cirsium arvense (L.) and Elymus repens (L.) became common. Two blocks clustered separately from the others in 1992. In these blocks the total plant cover was lowest and the percentage of grasses highest.
3.2. Difference in leafhopper fauna between perennial strips and cereal field
Leafhopper abundance was higher in perennial grass strips than in cereal fields, although the differ-ence was statistically significant only in 1994 (Fig. 5). Leafhopper abundance varied among seasons. The total sum of leafhoppers was highest in 1993, when 192 sweep net samples contained a total 4680
speci-Fig. 3. Cover of dicotyledons (mean±S.D.) in perennial grass strips in 1992–1995. Years with different letters differed significantly, p<0.05 (Tukey’s test).
Fig. 4. Plant communities of perennial strips on the first two axes of DCA ordination. Eigenvalue of first and second axes are 0.4107 and 0.1122, respectively. Only dominant species plotted. Abbrevi-ations for species are: Cir arv=Cirsium arvense, Ely rep=Elymus repens, Fes pra=Festuca pratensis, Phl pra=Phleum pratense, Thl arv=Thlaspi arvense, Tri ino=Tripleurospermum inodorum, Tri pra=Trifolium pratense, Tri rep=Trifolium repens.
mens belonging to 37 species. Part of the variation in species number was explained by the size of total catch (Fig. 6; 1992: p<0.001, 1993: p<0.001). In 1992, the species number of the strips did not differ statistically significantly from that of the fields (ANCOVA df=2, 9, F=1.15, p=0.246). However, in 1992 less samples were taken from grass strips than from fields which may have decreased the probability of discovering rare species. In 1993, the species number in the strips was higher than in the field (Fig. 6, ANCOVA df=2,
Fig. 6. Total catch and species number of leafhoppers in the field and in the perennial strip in 1992–1994.
9, F=140.43, p<0.001). In 1994, reliable comparison of species number between field and strip was not pos-sible because interaction log(total catch)×log(species number) was statistically significant (ANOVA df=1, 3, F=16.02, p=0.028) and the total catches of the strip were distinct from those of the field (Fig. 6).
Species composition varied between habitats.
Ver-danus abdominalis (F.) (35.8%), Paluda flaveola
(Boh.) (20.2%) and Elymana suphurella (Zett.) (9.9%) were the dominant species in grass strips. Field catches were dominated by Macrosteles laevis (Rib.) (42.3%) and Macrosteles cristatus (Rib.) (15.9%). In 1992, Javesella pellucida (F.), too, was common in field catches (20.4%). Eight leafhopper species which are known to be vectors of virus or mycoplasma (Raatikainen, 1970; Lindsten et al., 1970) were found
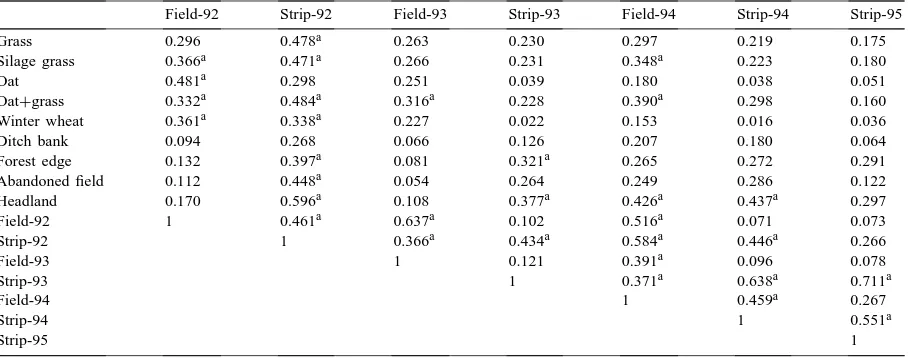
Table 3
Renkonen’s similarity indices of leafhopper fauna in the experiment (field and strip) in 1992–1995 with leafhopper fauna of adjacent biotopes in 1991
Field-92 Strip-92 Field-93 Strip-93 Field-94 Strip-94 Strip-95
Grass 0.296 0.478a 0.263 0.230 0.297 0.219 0.175
Silage grass 0.366a 0.471a 0.266 0.231 0.348a 0.223 0.180
Oat 0.481a 0.298 0.251 0.039 0.180 0.038 0.051
Oat+grass 0.332a 0.484a 0.316a 0.228 0.390a 0.298 0.160
Winter wheat 0.361a 0.338a 0.227 0.022 0.153 0.016 0.036
Ditch bank 0.094 0.268 0.066 0.126 0.207 0.180 0.064
Forest edge 0.132 0.397a 0.081 0.321a 0.265 0.272 0.291
Abandoned field 0.112 0.448a 0.054 0.264 0.249 0.286 0.122
Headland 0.170 0.596a 0.108 0.377a 0.426a 0.437a 0.297
Field-92 1 0.461a 0.637a 0.102 0.516a 0.071 0.073
Strip-92 1 0.366a 0.434a 0.584a 0.446a 0.266
Field-93 1 0.121 0.391a 0.096 0.078
Strip-93 1 0.371a 0.638a 0.711a
Field-94 1 0.459a 0.267
Strip-94 1 0.551a
Strip-95 1
aIndicate values >0.3.
both from the grass strips and the field. However, the percentage of harmful species was clearly higher in the field catches (80%) than in the strip catches (32%). The percentage of brachypterous morphs was higher in grass strips (1992: 69.3%; 1993: 54.7%; 1994: 52.9%) than in the field (0.9, 7.7 and 6.1%, respectively). Brachypterous forms of Dicranotropis
hamata (Boh.) and Megadelphax sordidulus (Stål)
oc-curred nearly exclusively in the grass strips. Among dimorphic species, brachypterous females dominated in the grass strips and macropterous males in the field. Species composition of leafhoppers in the grass strips was quite similar to sweep net samples taken from adjacent uncultivated biotopes in 1991. Accord-ing to Renkonen’s similarity index, the leafhopper fauna of grass strips resembled that of the aban-doned field, headland and edge of forest, whereas the leafhopper fauna of cereal fields resembled that of cultivated biotopes (Table 3). Table 4 presents a list of leafhopper species taken in sweep net samples from the experiment (field and strip) and adjacent biotopes.
3.3. Changes of leafhopper assemblage in grass strips
Table 4
Presence/absence table of leafhopper species in sweep samples collected from the experiment (field and strip) in 1992–1994 and from different biotopes in 1991a
Strip Field DB H EF A O OG G S W
Achorotile albosignata (Dahlb.) − + − − − − − − − − −
Aguriahana germari (Zett.) + − − − − − − − − − −
Anoscopus flavostriatus (Don.) + + − − − − − − − − −
Aphrodes bicincta (Schrnk.) − − − + − − − − − − −
Aphrodes makarovi Zachv. + − − − − − − − − − −
Arthaldeus pascuellus (Fall.) + + + + + + − − + + −
Athysanus argentarius Metc. + + − − − − − − − − −
Athysanus quadrum Boh. − − − − + − − − − − −
Balclutha punctata (F.) + + + + + + + − + + +
Cicadella viridis (L.) − + − − − − − − − − −
Cicadula sp. Zett. + − + + + − − − + − −
Cixius similis Kbm. − − − − + + − − − − −
Criomorphus albomarginatus Curt. − − − − + − − − − − −
Criomorphus sp. Curt. − − − − + − − − − − −
Deltocephalus pulicaris (Fall.) + + − + + − − − − − −
Dicranotropis hamata (Boh.) + + + + + + − + + + −
Dikraneura aridella (Sahlb.) − − − − + − − − − − −
Doliotettix lunulatus (Zett.) + + − − − − − − − − −
Doratura stylata (Boh.) − − − + − − − − − − −
Elymana sulphurella (Zett.) + + + + + + − + + + −
Empoasca smaragdula (Fall.) + + − − − − − − − − −
Eupteryx cyclobs Mats. − − + − + − − − − − −
Eupteryx origani Zachv. + − − + + − − + − − −
Eupteryx sp. Curt. + − + + − − − − − − −
Euscelis distinguendus (Kbm.) + − − − − − − − − − −
Evacanthus interruptus (L.) + + + − + − − − + − −
Graphocraerus ventralis (Fall.) + + − + + + − + − − −
Grypotes puncticollis (H.-S.) − + − − − − − − − − −
Idiocerus sp. Lewis − − + − − − − − − − −
Jassargus flori (Fieb.) + − − − − − − − − − −
Javesella discolor (Boh.) − + − − − − − − + − +
Javesella dubia (Kbm.) + + − − − − − − + − −
Javesella obscurella (Boh.) + + + + + − + + + + +
Javesella pellucida (F.) + + + + + + + + + + +
Lebradea flavovirens (Gill. & Bak.) + + + − − − − − − − −
Macropsis sp. Lew. − − + − − − − − − − −
Macrosteles cristatus (Rib.) + + − − − − + + − − −
Macrosteles fieberi (Edw.) − + − − − − − − − − −
Macrosteles laevis (Rib.) + + + + + − + + + + +
Macrosteles septemnotatus (Fall.) − − + − − − − − − − −
Macrosteles sexnotatus (Fall.) − + − − − − − − − − −
Macrosteles sp. Fieb. + + − − − − − − − − −
Macustus grisescens (Zett.) + − − − − − − − − − −
Megadelphax sordidulus (Stål) + + − − − − − − − − −
Mocuellus metrius (Fl.) + + + − − − − − − − −
Muellerianella brevipennis (Boh.) + + − − − − − − − − −
Neophilaenus lineatus (L.) − + + + + − − − − − −
Paluda flaveola (Boh.) + + + + + − − + − − −
Philaenus spumarius (L.) + − + + + + + − + − +
Planaphrodes bifasciata (L.) + − − + − − − − − − −
Psammotettix sp. Hpt. + + + − − − + − − − −
Table 4 (Continued).
Strip Field DB H EF A O OG G S W
Psammotettix confinis (Dahlb.) + + − − − − − − − − −
Rhopalopyx preyssleri (H.-S.) + + + + − − − − − − −
Sonronius dahlbomi (Zett.) + − + − − − − − − − −
Stiroma bicarinata (H.-S.) + + + + + − − − + + −
Streptanus aemulans (Kbm.) + − − − − − − − − − −
Streptanus sordidus (Zett.) + − − − + − − − − − −
Typhlocyba sp. Germ. − − + − − − − − − − −
Verdanus abdominalis (F.) + + + + + + + + + + −
Xanthodelphax stramineus (Stål) − + − − + − − − − − −
Zycina sp. Fieb. − − − − − − − − − − +
aDB=ditch bank, H=headland, EF=edge of forest, A=abandoned field, O=oat, OG=oat and grass, G=grassland, S=silage grass, W=winter wheat.
abundance was highest in 1993. There was a statisti-cally significant interaction between period and year in abundance of leafhoppers (Fig. 7, Table 5). The abundance of leafhoppers differed between periods. Variation among years was greater in late summer.
There was a statistically significant interaction be-tween total catch and year in terms of species rich-ness (Table 5, Fig. 8). Part of the variation in species number was explained by the size of the total catch in 1992 and 1994, but not in 1993 and 1995. Species number was highest in 1993 and lowest in 1995. Di-versity (Shannon H′) was statistically different among years, highest in 1993, but evenness (Hill E′) did not differ significantly between factors (Table 5).
In DCA of leafhopper data, successive years clus-tered, but not as in the plant data (Fig. 9). In 1992, two blocks were separated from the rest, because in these blocks the species number was higher and species
Fig. 7. Abundance of leafhoppers (mean±S.D.) in the perennial strips in 1992–1995. (Period 1=early summer, Period 2=later summer).
composition differed from other blocks. The same blocks also differed in plant composition in 1992 (c.f. Fig. 4). In 1992, the leafhopper fauna of grass strips resembled that of fields, because the numbers of Macrosteles species were high. The other years clustered more clearly. Years 1993 and 1995 formed a separate group. In both years, Paluda flaveola was
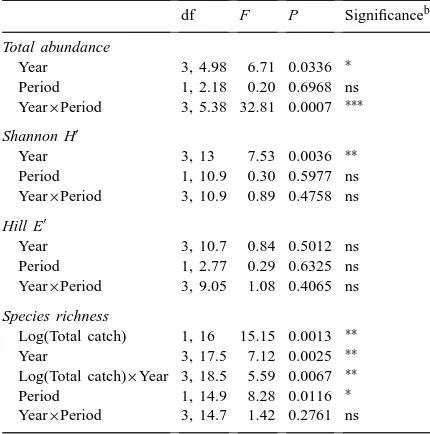
Table 5
Succession of leafhopper abundance, species richness and diversity in grass strips (Anova table)a
df F P Significanceb
Total abundance
Year 3, 4.98 6.71 0.0336 ∗ Period 1, 2.18 0.20 0.6968 ns Year×Period 3, 5.38 32.81 0.0007 ∗∗∗
Shannon H′
Year 3, 13 7.53 0.0036 ∗∗
Period 1, 10.9 0.30 0.5977 ns Year×Period 3, 10.9 0.89 0.4758 ns
Hill E′
Year 3, 10.7 0.84 0.5012 ns Period 1, 2.77 0.29 0.6325 ns Year×Period 3, 9.05 1.08 0.4065 ns
Species richness
Log(Total catch) 1, 16 15.15 0.0013 ∗∗ Year 3, 17.5 7.12 0.0025 ∗∗ Log(Total catch)×Year 3, 18.5 5.59 0.0067 ∗∗ Period 1, 14.9 8.28 0.0116 ∗ Year×Period 3, 14.7 1.42 0.2761 ns
aIn analyses of species richness, log(total catch) and its inter-action with year were added to the model. Satterthwaite’s approx-imation used in degrees of freedom.
Fig. 8. Total catch and species number of leafhoppers in perennial strips in 1992–1995 (Period 1=early summer, Period 2=later summer).
the second dominant species. The leafhopper species typical of the first year were Macrosteles laevis and
Javesella pellucida, and in the last year Verdanus abdominalis and Paluda flaveola.
The plant species richness of the grass strips did not correlate with leafhopper abundance (Pearson
Fig. 9. Leafhopper communities of perennial strips on the first two axes of DCA ordination. Eigenvalue of first and second axes are 0.4045 and 0.1701, respectively. Only dominant species plotted. Abbreviations for species are: Art pas=Arthaldeus pascuellus, Ely sul=Elymana sulphurella, Dic ham=Dicranotropis hamata, Jav pel=Javesella pellucida, Mac cri=Macrosteles cristatus, Mac lae=Macrosteles laevis, Meg sor=Megadelphax sordidulus, Ver abd=Verdanus abdominalis.
R=−0.197, df=20, p=0.381) or species richness (R=0.063, df=20, p=0.780). The number or abun-dance of gramineous species also did not correlate with leafhopper species number (R=0.031, df=20,
p=0.892, R=−0.171, df=20, p=0.445, respec-tively) or leafhopper abundance (R=−0.046, df=20,
p=0.840, R=−0.142, df=20, p=0.530, respectively).
4. Discussion
In spite of a decline in plant species richness dur-ing succession, the diversity of leafhoppers did not change as clearly. Overall, grass strips maintained a diverse and abundant leafhopper fauna. Therefore, leafhopper abundance and species richness seem to be more dependent on factors other than plant species richness. Although the plant species diversity in the grass strips decreased, the changes in structure of habitat were not necessarily as great. The effects of structural diversity of vegetation are often impos-sible to distinguish from the direct effects of plant species richness (Lawton, 1983). However, according to Andrzejewska (1979), destruction of the structure of meadows by mowing and grazing simplifies the species composition of leafhoppers, because the mul-tilayer structure of plant cover can maintain a more diversified phytophage community. Because many grassland leafhoppers are oligophagous, feeding mainly on gramineous plants, decreasing the number of dicotyledons did not affect the species richness of leafhoppers in the grass strips. In the study of Brown et al. (1992), leafhopper assemblies were strongly af-fected by plant architecture, but not by plant species composition except for a few specialists. Similarly, according to Denno and Roderick (1990), structurally complex grasses, including those with thatch, may support many coexisting species of leafhoppers and other sap-feeders, and there is only little evidence of inter-specific competition. Many leafhopper species have the potential for rapid population growth, but this is usually suppressed by natural enemies (Denno and Roderick, 1990). Because many of their predators and parasitoids are polyphagous or non-specific, the enemies tend to attack grassland leafhopper species in proportion to their abundance (Waloff, 1980), which may partly maintain the high diversity of leafhoppers in grasslands. In particular, number of spiders were high in the grass strips (Huusela-Veistola, 1998).
The species composition of leafhoppers in the grass strips was quite similar to sweep net samples taken from neighbouring habitats in 1991. According to similarity indices, the leafhopper fauna of grass strips resembled that of abandoned fields, headlands and forest edges, whereas the fauna of cereal fields was quite similar to that of different crops and grasslands. Generally, the species found in grass strips were typical of meadows and grasslands. Furthermore, leafhopper communities of the grass strips resembled
assemblages dominated by Megadelphax sordidula in early summer and by Verdanus (=Diplocolenus) abdominalis in high summer, typical of older (2–6
years) reserved fields (Hokkanen and Raatikainen, 1977b). These leafhopper communities showed a fairly clear affinity for the P. pratense community in reserved fields (Hokkanen and Raatikainen, 1977b).
Macrosteles laevis, which favour a poor vegetation
structure (Brown et al., 1992), was common in grass strips in the first year but not thereafter.
The percentage of brachypterous morphs was clearly higher in perennial grass strips than in the field, which is in accordance with the results of Novotny (1994) where the proportion of brachypters on permanent host plants was significantly higher in undisturbed habitats than in temporary habitats (rud-eral host plants). According to Brown (1982, 1986), wing polymorphism is most prevalent in species occurring during the middle stages of plant succes-sion when long-living grasses are common, whereas early successional vegetation is exploited effectively by macropterous species. Generally the production of macropters depends on the population density and host quality. The levels of dispersal (percent macroptery) in field populations are influenced by a variety of factors including host plant architecture, habitat persistence, plant succession and resource isolation (Denno and Roderick, 1990).
Large year-to-year variation in the numbers of leafhoppers between years was also found in other long-term monitoring of farming systems nearby the experimental site (Vasarainen, unpublished data). Ac-cording to Andrzejewska (1979), weather conditions play an important role in the variation between sea-sons, but not changes in plant biomass. Brown et al. (1992) reported substantial temporal and spatial vari-ation in abundance of different species in leafhopper assemblies and species richness. Although they ex-plained part of the variation by changes in vegetation structure (architecture and species composition) and by leafhoppers’ life-history traits, a substantial part of the variability in leafhopper assemblies could not be explained. Overall, leafhopper populations tend to be labile and the numerical dominance of a species and the species composition of a complex may change with generations (Waloff, 1980).
species richness of leafhoppers were not so dramatic. As leafhoppers favour permanent multilayer habi-tats, even small and simple permanent grasslands can maintain a diverse community of leafhoppers. Abun-dant and diverse leafhopper fauna may have a positive influence on populations of polyphagous predators such as spiders, ground beetles and rove beetles. Overall, the abundance of Diptera, Hymenoptera and Heteroptera (Huusela-Veistola and Kurppa, 1996) and especially the abundance of spiders (Huusela-Veistola, 1998) were higher in perennial grass strips than in the fields. Because the requirements of different in-sect species differ, many kinds of habitats should be included in the agricultural landscape if biodiversity is to be increased or maintained. Although butterflies or pollinators are dependent on diverse flowering plants (Lagerlöf et al., 1992; Dramstad and Fry, 1995; Steffan-Dewenter and Tscharntke, 1997), less diverse, but permanent multilayer habitats are important for leafhoppers and spiders.
Acknowledgements
The authors thank Veikko Rinne for helping to iden-tify leafhoppers and Seppo Neuvonen for advice on statistical methods and for helpful comments on the manuscript, and Terho Hyvönen, Sirpa Kurppa, Otso Suominen, Juha Tiainen and anonymous referees for comments on earlier drafts.
References
Andersson, L., 1990. Florans inverkan på åkerns skadeinsekter och deras naturliga fiender. Sver. Lantbruksuniv. Rapp. 18. Andrzejewska, L., 1979. Herbivorous fauna and its role in the
economy of grassland ecosystems. I. Herbivores in natural and managed meadows. Pol. Ecol. Stud. 5, 5–44.
Brown, V.K., 1982. Size and shape as ecological discriminants in successional communities of Heteroptera. Biol. J. Linnaean Soc. 18, 279–290.
Brown, V.K., 1986. Life cycle strategies and plant succession. In Taylor, F., Karban, R. (Eds.), The Evolution of Insect Life Cycles. Springer, New York, pp. 105–124.
Brown, V.K., Gibson, C.W.D., Kathirithamby, J., 1992. Community organisation in leaf hoppers. Oikos 65, 97–106.
Denno, R.F., Roderick, G.K., 1990. Population biology of planthoppers. Annu. Rev. Entomol. 35, 489–520.
Dramstad, W., Fry, G., 1995. Foraging activity of bumblebees (Bombus) in relation to flower resources on arable land. Agric. Ecosyst. Environ. 53, 123–135.
Hill, M.O., Gauch Jr., H.G., 1980. Detrended correspondence analysis: an improved ordination technique. Vegetatio 42, 47– 58.
Hansson, M., Fogelfors, H., 1998. Management of permanent set-aside on arable land in Sweden. J. Appl. Ecol. 35, 758–771. Hokkanen, H., Raatikainen, M., 1977a. Yield, vegetation and succession in reserved fields in Central Finland. J. Sci. Agric. Soc. Finland 49, 221–238.
Hokkanen, H., Raatikainen, M., 1977b. Faunal communities of the field stratum and their succession in reserved fields. J. Sci. Agric. Soc. Finland 49, 390–405.
Huusela-Veistola, E., 1996. Effects of pesticide use and cultivation techniques on groundbeetles (Col., Carabidae) in cereal fields. Ann. Zool. Fenn. 33, 197–205.
Huusela-Veistola, E., 1998. Effects of perennial grass strips on spiders (Araneae) in cereal fields and impact on pesticide side effects. J. Appl. Entomol. 122, 575–583.
Huusela-Veistola, E., Kurppa, S., 1996. Effects of pesticides and use of perennial strips on the vegetation-living insects in cereal field. IOBC/WPRS Bull. 19, 90–100.
Lagerlöf, J., Strak, J., Svensson, B., 1992. Margins of agricultural fields as habitats for pollinating insects. Agric. Ecosyst. Environ. 40, 117–124.
Lawton, J.H., 1983. Plant architecture and the diversity of phytophagous insects. Annu. Rev. Entomol. 28, 23–39. Lindsten, K., Vacke, J., Gerhardson, B., 1970. A preliminary
report of three cereal virus diseases new to Sweden spread by Macrosteles and Psammotettix leafhoppers. Stat. Växtskyddanst. Medd. 14, 128.
Littell, R.C., Milliken, G.A., Stroup, W.W., Wolfinger, R.D., 1996. SAS System for Mixed Models. SAS Institute Inc, Gary, NC, 633 pp.
Murdoch, W.W., Evans, F.C., Peterson, C.H., 1972. Diversity and pattern in plants and insects. Ecology 55, 819–829.
Nentwig, W., 1989. Augmentation of beneficial arthropods by strip management. II. Successional strips in winter wheat field. J. Plant Dis. Protection 96, 89–90.
Novotny, V., 1994. Relation between temporal persistence of host plants and wing length in leafhoppers (Hemiptera: Auchenorrhyncha). Ecol. Entomol. 19, 168–176.
Ossiannilsson, F., 1983. The Auchenorrhyncha (Homoptera) of Fennoscandia and Denmark. Fauna Entomol. Scand. Part 1–3. Raatikainen, M., 1970. Virus diseases of cereals and leafhoppers. Luonnon Tutkija 75, 65–74 (in Finnish with English summary).
Raatikainen, M., 1971. Seasonal aspects of leafhopper (Hom. Auchenorrhyncha) fauna in oats. Ann. Agric. Fenn. 10, 1–8. Raatikainen, M., 1972. Dispersal of leafhoppers and their enemies
to oatfields. Ann. Agric. Fenn. 11, 146–153.
Raatikainen, M., Vasarainen, A., 1971. Comparison of leafhopper fauna in cereals. Ann. Agric. Fenn. 10, 119–124.
Raatikainen, M., Vasarainen, A., 1973. Early and high-summer flight periods of leafhoppers. Ann. Agric. Fenn. 12, 77–94. Raatikainen, M., Vasarainen, A., 1976. Composition, zonation and
Renkonen, O., 1938. Statistisch-ökologische Untersuchungen uber die terrestrische Käferwelt der finnischen Bruchmoore. Ann. Zool. Soc. Vanamo 6, 1–231.
Ryszkowski, L., 1979. Ecosystem synthesis. In: Coupland, R.T. (Ed.), Grassland Ecosystems of the World. Analysis of Grasslands and their Uses. Cambridge University Press, Cambridge, pp. 327–331.
Steffan-Dewenter, I., Tscharntke, T., 1997. Early succession of butterfly and plant communities on set-aside fields. Oecol. 109, 294–302.
Ter Braak, C.J.F., 1987. CANOCO — a FORTRAN program for canonical community ordination by [partial] [detrended]
[canonical] correspondence analysis, principal components analysis and redundancy analysis (version 2.1). Agricultural Mathematics Group, Wageningen, 95 pp.
Thomas, M.B., Wratten, S.D., Sotherton, N.W., 1992. Creation of ‘island’ habitats in farmland to manipulate populations of beneficial arthropods: predator densities and species composition. J. Appl. Ecol. 29, 524–531.
Waloff, N., 1980. Studies on grassland leafhoppers (Auchenorrhyncha, Homoptera) and their natural enemies. Adv. Ecol. Res. 11, 81–215.