OPENWEBGLOBE – AN OPEN SOURCE SDK FOR CREATING
LARGE-SCALE VIRTUAL GLOBES ON A WEBGL BASIS
B. Loesch, M. Christen, S. Nebiker
Institute of Geomatics Engineering, FHNW University of Applied Sciences and Arts Northwestern Switzerland,
Muttenz, Switzerland – (benjamin.loesch, martin.christen, stephan.nebiker)@fhnw.ch
Commission IV, WG IV/4
KEY WORDS: Visualization, Algorithms, Virtual Reality, Web based, Point Cloud, Three-dimensional, Triangulation
ABSTRACT:
This paper introduces the OpenWebGlobe project (www.openwebglobe.org) and the OpenWebGlobe SDK (Software Development Kit) – an open source virtual globe environment using WebGL. Unlike other (web-based) 3d geovisualisation technologies and toolkits, the OpenWebGlobe SDK not only supports the content authoring and web visualization aspects, but also the data processing functionality for generating multi-terabyte terrain, image, map and 3d point cloud data sets in high-performance and cloud-based parallel computing environments. The OpenWebGlobe architecture is described and the paper outlines the processing and the viewer functionality provided by the OpenWebGlobe SDK. It then discusses the generation and updating of a global 3d base map using OpenStreetMap data and finally presents two show cases employing the technology a) for implementing an interactive national 3d geoportal incorporating high resolution national geodata sets and b) for implementing a 3d geoinformation service supporting the real-time incorporation of 3d point cloud data.
1. INTRODUCTION
In recent years virtual globes have become an important tool for interactively visualizing and investigating geo-referenced content. Virtual globes are capable of streaming terabytes of imagery, elevation data and other geospatial contents over the Internet. Emerging Internet technologies, such as HTML5 and WebGL, offer new possibilities to develop virtual globes running in web-browsers without a need for browser extensions or plugins.
WebGL is a cross-platform, royalty-free web standard for a low-level 3d graphics API based on OpenGL ES 2.0 (WebGL, 2011). It is exposed through the HTML5 Canvas element as Document Object Model interface. WebGL is a shader-based API using the OpenGL Shading Language (GLSL), with constructs that are semantically similar to those of the underlying OpenGL ES 2.0 API. In March 2011 version 1.0 of the WebGL specification was released. Today WebGL runs in desktop and mobile web-browsers like Mozilla Firefox, Google Chrome, Safari, and Opera. In the Internet Explorer WebGL can currently only be used through plugins.
Many different JavaScript 3d engines such as three.js (Three.js, 2012) or SceneJS (SceneJS, 2012) were created to ease the implementation of different 3d web applications or games using WebGL. It is no surprise that also in the field of virtual globes WebGL is a hot topic and used for several virtual globe web applications. Projects like WebGL Earth (WebGL Earth, 2012) the ReadyMap SDK (Pelican Mapping, 2012) and our OpenWebGlobe SDK were initiated to provide a base for the implementation of new 3d virtual globe applications using WebGL. Also Google is currently working on a WebGL version of Google Maps (Google Maps, 2012).
Apart from the discussion about the advantages or disadvantages of a plugin free virtual globe (VG) browser application, today's VGs also have a number of shortcomings
such as a lack of extensibility in terms of large , complex user-generated or third-party geospatial contents (e.g. own high-resolution DTMs or large to very large customized map or orthoimage data sets). Other potentially more serious shortcomings are the lacking extensibility in terms of functionality and the lacking ease of integration into third party applications and into operational environments which might not be compatible with data and IP right policies of large commercial VG operators. The strive for new applications of VGs together with the above mentioned limitations of the main commercial VGs have been the motivation for developing our own VG technology at the FHNW.
In this paper we discuss the evolution of and research activities in Internet- and web-based interactive 3d technologies. We then present the OpenWebGlobe project and architecture. The paper first focuses on the OpenWebGlobe viewer component, which is fully based on HTML5 and WebGL, as well as some of its key features. This is followed by a short discussion of the OpenWebGlobe processing functionality. In the later sections of this paper we present two applications which were built using the OpenWebGlobe SDK. First a pilot national 3d geoportal of Switzerland using high resolution imagery and elevation data is described. Second an application in which OpenWebGlobe is used for visualizing continuously generated point cloud data for rapid mapping and inspection of unknown buildings or industry-sites.
2. RELATED WORK
Different mechanisms for an interactive visualization of 3d contents in the web are available and frequently used. Early formats and standards such as the Virtual Reality Modeling Language (VRML) (Bell, 1995) were defined in the mid 90ies and permitted the authoring and delivery of 3d contents over the web but required applications or browser plugins. VRML was
developed with the main goal to be platform independent, extendable, and to work well over low-bandwidth internet connections. Important geospatial features such as accurate coordinate system support and a certain level of scalability were added by GeoVRML in the late 90ies (Reddy et al., 2000). (Geo)VRML and its successor X3D are text based and do not provide the capability to access graphics hardware and to create custom graphics engines. In parallel to the VRML efforts, numerous approaches for interactively streaming large 3d virtual environments were being developed. However, they all required the installation of a proprietary application or a specific browser plugin. Among the earliest technologies for generating and interactively exploiting very large 3d landscape models over the Internet using browser plugins were DILAS / G-VISTA (Nebiker, 2003) and LandExplorer (Döllner et al., 2003).
Another mechanism for 3d scene description and integration of complex, explorable 3d scenes into webpages is XML3D (Sons et al., 2010). XML3D is a HTML5 extension and allows the integration of these scene descriptions directly into the HTML5 object model. Modern browsers support XML3D natively and often WebGL is used for rendering within a website. For web-design purposes, CSS3 3D (Jackson et al., 2009) offers some functionality for 3d visualization of CSS elements (e.g. perspective transformations, translations etc.) CSS 3D is an extension of the CSS3 standard and is supported by many modern browsers.
The creation and recent release of WebGL has spurred a number of projects and activities with the goal of exploiting 3d contents directly within the web browser. WebGL is a low level API, this means that WebGL provides functionality to access graphics hardware such as creating textures, create shader programs on the GPU, and vertex buffers. Therefore new high-level engines can be created using the WebGL standard by adding functionality such as loading 3d models, providing vector math functionality, ray-picking, texture atlases, or scene graphs. One very popular WebGL engine is three.js which is a lightweight 3d engine with low level of complexity (Three.js, 2012). Other noteable WebGL based high-level 3d engines are SpiderGL (Di Benedetto, 2010), SceneJS (SceneJS, 2012), Copperlicht (Ambiera, 2012) and Processing.js (Processing, 2012).
For visualization of large-scale geospatial 3d contents various virtual globes running directly in the web browser have been developed. They can be categorized in three types: First, there are plugin-based globes requiring the previous installation of a browser plugin. For every browser and operating system a separate plugin must be developed to achieve cross browser/cross platform support. Examples of such globes are Google Earth Plugin (Google Earth Plugin, 2012), Nokia Maps 3D (Nokia, 2012) and Bing Maps 3D, which was discontinued in November 2010 (Bing Maps 3D, 2010). The second type uses Java Applets, such as OSM-3D (Schilling and Zipf, 2011) or NASA World Wind (World Wind, 2007). The third type of web browser based globes use WebGL for rendering. Examples of such globes are Nokia Maps for WebGL (Beta) (Nokia WebGL, 2012), WebGLEarth (WebGLEarth, 2012), ReadyMap (Pelican Mapping, 2012) based on the osgjs engine (Osgjs, 2012), and OpenWebGlobe (OpenWebGlobe, 2012).
3. THE OPENWEBGLOBE PROJECT
The OpenWebGlobe project (www.openwebglobe.org) was initiated by the Institute of Geomatics Engineering of the FHNW University of Applied Sciences and Arts Northwestern Switzerland (IVGI). It started in April 2011 as an open source project following nearly a decade of 3d geobrowser development at the institute. Together with developers from industry and from other universities, the functionality of the SDK is being extended continuously.
The development is based on the earlier i3D virtual globe technology, which was also developed at the IVGI and which was used for several research and industry projects (Christen & Nebiker, 2010). Unlike the i3D technology, the OpenWebGlobe SDK is fully open source and released under MIT license. All source code is freely available at github (http://github.com/OpenWebGlobe) and can be viewed, adapted or extended even for commercial use.
The OpenWebGlobe SDK consists of two main parts: first, the OpenWebGlobe Viewer part (as described in section 3.2), it consists of a JavaScript library which allows the integration of the OpenWebGlobe into custom web-applications. Second, the OpenWebGlobe Processing Tools (introduced in Section 3.3), a bundle of tools for bulk data processing, e.g. tiling or resampling of large geospatial data sets. This pre-processing is required by the viewer part to enable scalable fragment-based, streamed download and visualization of data.
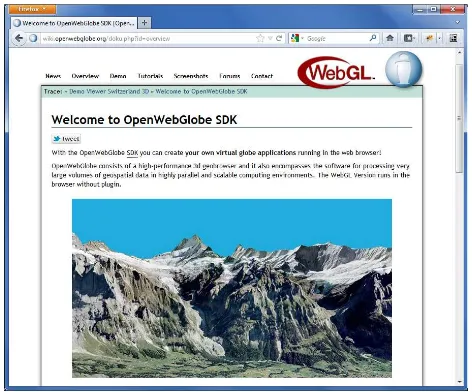
Further information about the project, tutorials, a function reference and a support forum are available at http://www.openwebglobe.org.
Figure 1. Screenshot of the project homepage www.openwebglobe.org
3.1 Geospatial Foundations of OpenWebGlobe
Great emphasis was placed on providing a sound geospatial reference. This is crucial, especially if OpenWebGlobe is used as a basis for accurate virtual or mixed reality applications.
An ellipsoidal geodetic reference model is employed, in order to minimize geometric transformation errors and to enable position accuracies within the virtual globe at the sub-meter level (Christen & Nebiker, 2011b). The default spatial reference system and reference ellipsoid in OpenWebGlobe is WGS84.
However, it is possible to change to a different reference system, e.g. for extraterrestrial visualizations.
In OpenWebGlobe, for compatibility reasons, the spherical Mercator projection is used to map image and elevation data. This projection is mainly used to minimize distortions in processed images and elevation data (Snyder, 1987).
The maximum latitude is chosen so that the resulting map fits into a square. For the spherical Mercator projection this maximum latitude is approximately 85.05 degrees. The square is used because the tiles are laid out in a quadtree. The quad-tree data structure has been used by many popular web mapping services like Google Maps, Bing Maps and OpenStreetMap. For OpenWebGlobe the same tile structure can be used and therefore be compatible with other tools for image data processing.
3.2 The OpenWebGlobe Viewer
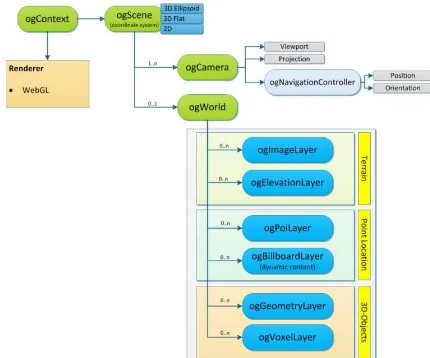
The OpenWebGlobe Viewer architecture is based on a scenegraph like model and it uses an object oriented approach. Among the basic objects (see Figure 2) is the context object (ogContext) which is the combination of a render window and a graphics engine. It corresponds to the WebGL context but in an abstract form. The scene object (ogScene) describes the type of virtual globe visualization. A virtual globe is usually represented as a 3d ellipsoid (WGS84), but it is also planned to create flat earth representations – especially for local scenes – or to create a 2d visualization which is usually a 2d map-type application. In the scene there is a camera object (ogCamera) which controls what is visible. There can be several cameras in a scene, but only one is active at a given time. The camera has a navigation controller which allows navigation through the scene – for example with the mouse and keyboard as input. There is a default navigation controller available, but a custom navigation can also be implemented.
Figure 2. Basic Objects of the OpenWebGlobe SDK
The world object (ogWorld) contains the globe in the format specified in the scene before (ellipsoid, flat, 2d). The world consists of different layers which can be added or removed during runtime. The most important layers are the image layer (ogImageLayer) consisting of previously tiled orthophotos or maps and the elevation layer (ogElevationLayer) consisting of
previously processed (tiled triangulated geometry) elevation data (DEM). Both layers allow streaming of nearly unlimited data. In addition, combinations of different image layers are possible as shown in Figure 3. Here a high resolution image layer from Switzerland is combined with tiled data from the OpenStreetMap traffic layer.
Figure 3. Example for combination of different image layers; image layer (25cm/pixel) and osm traffic layer combined and
displayed with an elevation layer (25m grid).
Furthermore the POI layer (ogPOILayer) contains points of interest (POI), the geometry layer contains 3d objects and the voxel layer preprocessed (tiled) 3d point cloud data. All layers are streamable over the internet or from a local webserver.
As shown in Figure 4, there is also a number of more advanced objects for 3d geometry, POI description, and binary or multi-language text data described in the next sections.
Figure 4. Advanced Objects of the OpenWebGlobe SDK
3.2.1 Points of Interest (POIs)
For labeling some interesting points like mountain peaks, hotels or gas stations POI objects (ogPOI) are typically used. The graphical representation of a POI object within the globe consists of a symbol and a label. POIs are arranged in a layer object (ogPOILayer). Predefined functions for hiding, dragging or picking POI objects are implemented. The POI size, font or
color can be designed individually by changing different style attributes. Labels can be defined in any language and special characters according to UTF8 are supported. A sample scene of swiss mountain peaks labeled with POIs is shown in figure 5a.
3.2.2 3d Models
Cities, Buildings and other geometries can be loaded into the globe as a Geometry Object (ogGeometry). The definition of a geometry object has to be stored in a JSON File (JavaScript Object Notation) according to a defined file description. These JSON Files can then be loaded asynchronously into the globe. OpenWebGlobe currently supports colored and textured 3d models. Converter scripts from wavefront obj or collada format are available. Figure 5b shows some textured 3d models within the globe.
3.2.3 Billboards
Since the release of HTML5 a so called canvas element is available. It is possible to draw or write into such a canvas element by simple JavaScript functions. These painted canvas elements can then be loaded into the globe and displayed as billboards by using the ogBillboard object. This allows to display complex, dyamic graphics like graphs or charts within the globe.
3.2.4 Point Clouds
As an alternative representation for building or city models, point clouds (Nebiker et al., 2010) can be visualized within the OpenWebGlobe. The point cloud data has to be stored in a proprietary JSON format or simply as ASCII xyz-file. Large pointclouds have to be thinned out to decrease the amount of data. For this purpose a function is available in the OpenWebGlobe processing tools. An example of point cloud visualization is shown in Figure 5c. Point cloud data is statically loaded from files into the scene but it is foreseen to implement a view dependent point cloud streaming mechanism (Laine & Karras, 2010).
Figure 5 a (top left), b (top right), c (bottom). Custom geospatial contents visualized in OpenWebGlobe.
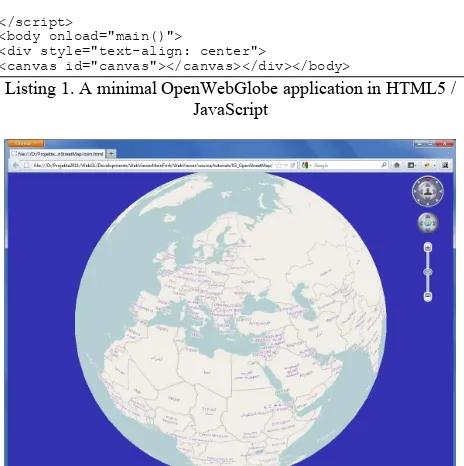
A minimal OpenWebGlobe application is shown in figure 6. The function “ogCreateContextFromCanvas” sets up the WebGL context. The second function “ogCreateGlobe” directly
creates a WGS84 scene containing a camera and a world object. This is a convenience function: there are also functions available to create scene objects, camera objects and world objects manually. With “ogAddImageLayer” an image layer can be added and with “ogAddElevationLayer”, an elevation layer is added to the scene.
<script type="text/javascript"src="openwebglobe.js"> </script>
<script type="text/javascript">
function main() {
var ctx = ogCreateContextFromCanvas("canvas",true); var globe = ogCreateGlobe(ctx);
var imgOpenStreetMap = {
url : ["http://a.tile.openstreetmap.org", "http://b.tile.openstreetmap.org", "http://c.tile.openstreetmap.org"], service : "osm"
};
ogAddImageLayer(globe, imgOpenStreetMap); }
</script>
<body onload="main()">
<div style="text-align: center">
<canvas id="canvas"></canvas></div></body>
Listing 1. A minimal OpenWebGlobe application in HTML5 / JavaScript
Figure 6. The resulting interactive virtual globe with osm map tiles coded in listing 1
3.3 Data Pre-processing for OpenWebGlobe
The OpenWebGlobe data processing algorithms (Christen & Nebiker, 2011a) have been developed with focusing on scalability to very large data volumes – for all supported data types, including imagery, map and terrain data – and have been optimized for parallelism. We adapted the algorithms to support as many cores as possible and came up with a set of OpenWebGlobe processing commands. All commands run on normal computers (regular laptops and work stations) and on HPC systems, including cloud computing services. We use the Message Passing Interface (MPI) to communicate and distribute the workload on HPC cluster and OpenMP for multiprocessing.
Our development and test platform runs on the Microsoft Windows HPC Server 2008 R2. However, our code is cross platform and runs on Linux, too. Commercial clouds, for example Amazon Elastic Compute Cloud (Amazon EC2) are also supported by the OpenWebGlobe data processing code.
One important aspect is compatibility to other geospatial data services. Therefore, we chose to use the OpenStreetMap tile layout for the tile storage. This makes it very easy to also use our processed data in 2d applications like OpenLayers.
A general data processing workflow has been created to simplify data processing from small to very large datasets. The OpenWebGlobe processing toolkit consists of a number of command line tools. A typical processing workflow is shown below:
1. The first step in data processing is determining the extent of your dataset. You can use the tool called
"ogCalcExtent" to calculate the extent of your data in WGS84 and tile coordinates.
2. Once the extent of the data is known, a new layer must be created. This is done using the "ogCreateLayer" tool.
3. After creation of the layer, data can be added. This is done using the "ogAddData" tool.
4. When elevation data is being added the "ogTriangulate" tool is used in this step to create geometry from the previously added data. A large scale delaunay triangulation is used as shown by (Christen & Nebiker, 2011a).
5. When adding data is finished, levels of detail can be calculated. This can be done using the "ogResample" tool.
Recently new tools have been developed. They are used for rasterizing vector data to image tiles using Mapnik, for creating hillshading and normal maps, as well as OpenStreetMap data with transparent background for overlays (Wüest, 2012). An introduction and a step by step tutorial for data processing with the OpenWebGlobe processing tools can be found in (Christen, 2012)
4. SELECTED APPLICATIONS
Among the 3d web applications created with the OpenWebGlobe SDK two are especially notable. The first one
is a 3d viewer of Switzerland displaying high resolution imagery (25cm/pixel) and elevation data (25m grid). The raw
data size was around 1.2TB. All data were directly preprocessed in the cloud. 26 million tiles were generated and
stored on an amazon S3 instance in a pyramidical folder structure with 19 LOD steps. This platform was created for the
Federal Office of Topography (Swisstopo) and used as a demonstrator project for the OpenWebGlobe technology. Also
some textured and untextured 3d models of swiss towns and selected buildings were integrated. Additionally a special image layer shows the country borders. The application also provides a localisation search service which allows searching and flying to a given town in Switzerland. A Screenshot of this
application is shown in figure 7. The platform is accessible online under swiss3d.openwebglobe.org.
Figure 7. Screenshot of the 3d Viewer Switzerland swiss3d.openwebglobe.org
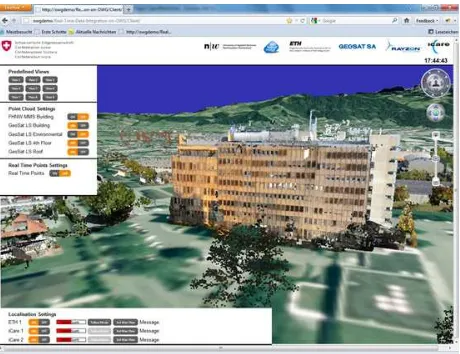
Another application for rapid 3d mapping and geolocalization was created in summer 2011 as part of a research project (Ladetto et al., 2011). The application offers possibilities to integrate and compare different 3d point clouds captured from laserscanning or stereo vision mobile mapping systems. Bulk 3d point cloud data was preprocessed prior to its integration into OpenWebGlobe. Data from a stereo vision SLAM device such as point cloud fragments, position and orientation data is continuously loaded and displayed by the application. Figure 8 shows a Screenshot of the application with a point cloud of the building exterior in an overview. Different predefined or dynamic view positions allow the user to investigate the building in more detail or to dynamically follow and observe moving objects or targets. Viewing modes like the 'follow mode' in which the user sees the virtual globe in the view of an individual or the 'third person mode' which allows observing a scene from a predefined distance and automatically follows any moving target are other useful features.
Figure 8. Screenshot of the rapid 3d mapping application
5. CONCLUSIONS AND OUTLOOK
In this paper we presented an open source framework for the creation of large scale virtual 3d globes with highly detailed contents and for their interactive visualization directly within a broad spectrum of web browsers. While commercial virtual globes are largely unrivalled in terms of global coverage and
tight integration with other web contents and web search capabilities, they suffer from a number of weaknesses, mainly the limited or lacking possibilities of integrating own high-quality and up-to-date geospatial base data and of extending the (core) functionality of the virtual globe. As it is shown in this paper, the OpenWebGlobe processing framework and the viewer SDK which is entirely based on HTML5 and WebGL offer a highly performant, extensible and rapidly evolving alternative to commercial virtual globes. Ongoing and future work includes aspects such as the integration of new content types (e.g. massive point cloud streaming, 3d model streaming), the implementation of new navigation modes or the development of web-based geospatial games.
6. REFERENCES
Ambiera, 2012. Copperlicht WebGL Engine. http://www.ambiera.com/copperlicht (02.04.2012)
Bell, G., Parisi, A., Pesce, M., 1995. The Virtual Reality Modeling Language.
Christen, M., Nebiker, S. , 2010. Neue Entwicklungen im Bereich Virtueller Globen am Beispiel der i3D-Technologie. Dreiländertagung der OVG, DGPF und SGPF. Wien
Christen, M., Nebiker, S., 2011a. Large Scale Constraint Delaunay Triangulation. Lecture Notes in Geoinformation and Cartography. Springer, Heidelberg, pp. 57-72.
Christen, M., Nebiker, S.,2011b. OpenWebGlobe SDK, an Open Source High Performance Virtual Globe SDK for Open Maps. Proceedings of the 1st European State of the Map, Wien.
Christen, M.,2012. Processing Geodata using the OpenWebGlobe Tools.
https://github.com/downloads/OpenWebGlobe/DataProcessing/ dataprocessing.pdf (02.04.2012)
Di Benedetto, M., Ponchio, F., Ganovelli, F., Scopigno, R., 2010. SpiderGL: A JavaScript 3D Graphics Library for Next-Generation WWW, 15th Conference on 3D Web technology.
Döllner, J., Baumann, K., Kersting, O., 2003. LandExplorer - Ein System für interaktive 3D-Karten. Kartographische Schriften, pp. 7:67-76.
Google Earth Plugin, 2012.
http://www.google.com/earth/explore/products/plugin.html (02.04.2012)
Google Maps, 2012.
http://maps.google.com (03.04.2012)
Jackson, D., Hyatt, D., Marrin, C., 2009. CSS 3D Transforms Module Level 3.
http://www.w3.org/TR/css3-3d-transforms/ (03.04.2012)
Ladetto et al., 2012, European Journal of Navigation, Volume 10, Number 1, April 2012, pages 4 – 15.
Laine, S., Karras T., 2010. Efficent sparse voxel octrees. Proceedings of te 2010 ACM SIGGRAPH symposium on Interactive 3D Graphics and Games, pp. 55-63
Nebiker, S., 2003. Support for visualization and animation in a scalable 3D GIS environment – Motivation, Concepts and Implementation.
Nebiker, S., Bleisch, S., Christen, M., 2010. Rich point clouds in virtual globes – A new paradigm in city modeling?
Computers, Environment and Urban Systems. pp. 34(6):508-517.
http://dx.doi.org/10.1016/j.compenvurbsys.2010.05.002. (02.04.2012)
Nokia WebGL, 2012. Nokia maps (WebGL)
http://maps3d.svc.nokia.com/webgl/index.html (02.04.2012)
Nokia, 2012.
http://maps.nokia.com/3D (02.04.2012)
OpenStreetMap, 2012: OpenStreetMap Project Wiki http://wiki.openstreetmap.org/wiki/Main_Page (02.04.2012)
OpenWebGlobe, 2012. OpenWebGlobe SDK http://www.openwebglobe.org (02.04.2012)
Osgjs, 2012. OpenSceneGraph for JavaScript (WebGL). http://osgjs.org (02.04.2012)
Pelican Mapping, 2012. ReadyMap SDK http://readymap.com (03.04.2012)
Processing, 2012. Processing.js WebGL Engine. http://www.processingjs.org (02.04.2012)
Reddy, M., Iverson, L., Leclerc YG, 2000. Under the hood of GeoVRML 1.0. Proceedings of the fifth symposium on Virtual reality modeling language (Web3D-VRML). New York, NY, USA. ACM; 2000:23-28.
SceneJS, 2012. SceneJS - 3D Scene Graph Engine for WebGL http://scenejs.org (03.04.2012)
Schilling, A., Zipf, A., 2011. From planet.osm to OSM.Planet - OSM-3D is becoming global. SOTM-EU 2011. State of the Map EU. Scientific Track. Wien.
Snyder, J. P. ,1987. Map Projections: A Working Manual. U.S. Geological Survey Profesional Paper 1395. U.S. Geological Survey.
http://pubs.er.usgs.gov/usgspubs/pp/pp1395.
Sons, K., Klein, F., Rubinstein, D., Byelozyorov, S., Slusallek, P., 2010. XML3D: interactive 3D graphics for the web,
Proceedings of the 15th International Conference on Web 3D Technology, Los Angeles, California, pp.175-184.
Three.js, 2012. Three.js JavaScript graphics engine. https://github.com/mrdoob/three.js (03.04.2012).
WebGL Earth, 2012.
http://www.webglearth.org (03.04.2012)
WebGL, 2011. WebGL Specification, Version 1.0, 10 February 2011.
https://www.khronos.org/registry/webgl/specs/1.0 (20.01.2012).
World Wind, 2007.
http://worldwind.arc.nasa.gov/index.html (02.04.2012)
Wüest, R., 2012. Paralleles Pre-processing und optimiertes Rendering globaler Openstreetmap-Daten in OpenWebGlobe, 2012. Master Thesis, University of Applied Sciences and Arts Northwestern Switzerland.