A FRAMEWORK FOR ONLINE SPATIO-TEMPORAL DATA VISUALIZATION BASED
ON HTML5
Bo Mao*, Zhiang Wu, Jie Cao
Jiangsu Provincial Key Laboratory of E-business, Nanjing University of Finance and Economics, 210003, Nanjing, P. R. China
Commission II WG II/6
KEY WORDS: Spatio-temporal data, Web based visualization, HTML5, WebSocket, Canvas
ABSTRACT:
Web is entering a new phase – HTML5. New features of HTML5 should be studied for online spatio-temporal data visualization. In the proposed framework, spatio-temporal data is stored in the data server and is sent to user browsers with WebSocket. Public geo-data such as Internet digital map is integrated into the browsers. Then animation is implemented through the canvas object defined by the HTML5 specification. To simulate the spatio-temporal data source, we collected the daily location of 15 users with GPS tracker. The current positions of the users are collected every minute and are recorded in a file. Based on this file, we generate a real time spatio-temporal data source which sends out current user location every second.By enlarging the real time scales by 60 times, we can observe the movement clearly. The data transmitted with WebSocket is the coordinates of users’ current positions, which will can be demonstrated in client browsers.
* Corresponding author. Bo Mao, [email protected] 1. INTRODUCTION
Internet has become one of the main information resources in people’s daily lives. Especially along with the development of mobile communication technology, we can connect to Internet almost anytime and anywhere. Therefore, it will be quite convenient for the common user to access the visualized information through Web with standard browsers such as Internet Explorer, Firefox, Chrome, etc.
In our daily lives, a large proportion of information is spatio-temporal related, such as taxi location, public transportation inquiry, travel route plan, event recommendation and Internet of things, because spatio-temporal data is generated from many different kinds of sensors placed in buildings, roads, cars, cell phones and so on. These datasets are fundamental for decision making in many applications. It is necessary to create a standard framework to visualize spatio-temporal data through Internet.
Meanwhile, Internet is evolving by updating its core technology, HTML (HyperText Markup Language, a language for structuring and presenting content for the World Wide Web). After the first version of HTML proposed by Tim Berners-Lee in 1989, it has developed for more than 20 years and now the Internet is entering an era of new version: HTML5. According to W3C (2011), HTML5 was originally proposed by Opera Software. It adds many new elements such as <video>, <audio>, <canvas>; it also provides new APIs like WebSocket, Web Storage, Geolocation, and Web SQL database. This paper applies some of these latest technologies into the spatio-temporal data visualization and creates a prototype framework for further extension. In this paper, Canvas and WebSocket are selected to demonstrate the capacity of HTML5.
The aim of this paper is to investigate the use of HTML5 for geovisualization especially for spatio-temporal data
visualization. The walking trajectories are considered as representation of spatio-temporal data. The proposed framework could be used by digital map providers for dynamic online map or by the taxi companies to monitor the real time distribution of their cars and so on.
Rest of the paper is structured as follows. Section 2 introduces related work; the proposed online visualization framework is described in Section 3; Section 4 reveals the details of system implementation; the experimental results are demonstrated in Section 5; Section 6 concludes the whole paper.
2. RELATED WORK
Many frameworks for online spatio-temporal data visualization are proposed in both academic and industry fields. They can be divided into two categories: thick client-server model, and thin client-server model.
In the thick client-server model, the user has to install a specific client program to access spatio-temporal data. One of the most successful thick client-server programs for geovisualization is Google Earth. Wood et al. (2007) combined MySQL, PHP with Google Earth for visual synthesis and interaction with spatio-temporal data described in KML. Askay (2010) demonstrated Map the Fallen project in the realm of data visualization within Google. However, Google Earth is still commercial software and the development based on it is constrained. Another similar commercial spatio-temporal data visualization platform is the Bing Map from Microsoft. One of the most noticeable defects of the thick Client-Server model is the difficulty to persuade users to install the client program, which limits its accessibility. Also, several versions of the client program have to be developed for different platforms, so the development workload is increased.
In thin client-server framework, browser is usually employed for retrieving and presentinginformation resources on Web. Compared to the specific user clients, web browser is much more widely available. To support spatio-temporal data visualization, different plugins are developed. Andrienko et al. (1999, 2000) proposed Web based visualization tools for movement of stork and distribution of earth quakes using Java applet. Ho et al. (2011) introduced a framework based on Adobe’s ActionScript, to shorten the time and effort needed to develop customized web-enabled applications for visual analytics or geovisual analytics tasks. Gao and Wang (2010) demonstrated the process of constructing a virtual hydraulic circuit using Flash through web. Ying et al. (2004) presented a framework based on SVG to visualize traffic dataset. Gajdos and Radecky (2009) developed an extra visualization module to integrate 3D content into their web based project. Mao and Ban(2011) employed X3DOM to visualize spatio-temporal data in 3D.
Nowadays, HTML5 is widely supported by browsers. It is the 5th major version of the core language of World Wide Web. In HTML5, new elements and features are introduced to help Web application authors based on prevailing authoring practices. Also special attention has been paied to define clear conformance criteria for user agents in an effort to improve interoperability (W3C, 2012). Currently, HTML5 has been applied in many applications such as online games (html5games, 2012), mobile apps (Grigsby 2009), web tools (Sketchpad 2012), and 3D visualizations (X3DOM 2012). Boulos et al. (2010) introduced Cartagen, an open-source, vector-based framework using native HTML5 for interactive online mapping in a wide range of Web browsers and mobile phones. Harjono et al. (2010) tried to build a smarter Web with HTML5.
It is helpful to explore the new features of HTML5 for better online geovisualization. Compared with previous approaches such as Java Applet (Andrienko and Andrienko 1999, 2000), Flash (Zhang et al. 2010) or ESRI web map services (ESRI 2012), HTML5 based visualizations have following advantages. First, it provides more descriptive semantics and richer media elements especially for mobile devices. Second, HTML5 is getting better support, because mainstream browsers such as Safari, Chrome, IE and Firefox follow HTML5 specification. Third, the development focus is shifted to HTML5, and many tools are provided for HTML5, which makes it easier for geovisualization development. Although, parts of HTML5 are very stable, the standard itself is a work in progress and new features are been adding into the specification constantly. Therefore, it is necessary to study these new features for better geovisualization. Since HTML5 is a rather new standard that started in 2008 and still under revision, it is not yet been widely applied in geovisualization. This paper will study the potential of HTML5 for geovisualization especially for spatio-temporal data.
3. VISUALIZATION FRAMEWORK
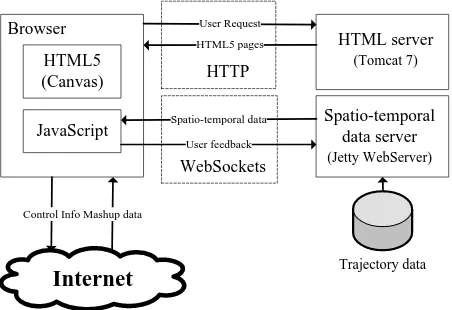
The proposed dynamic geovisualization framework is given in Figure 1. The spatio-temporal data is stored in database and is linked to spatio-temporal data server implemented with Jetty WebServer, from which browser can acquire spatio-temporal data using WebSocket with JavaScript program. The HTML server is hosted separately with Tomcat 7. Meanwhile the public geo data such as Internet digital maps are mashed up into the
Figure 1. Visualization framework based on HTML5
In the framework, when a user logs into the HTML server for real time spatial information such as current location of a bus or a train, the HTML page will be transmitted to the user with HTTP. The JavaScript code in the HTML page will then establishes a WebSocket connection to the data server. Next, the required spatio-temporal datasets will be sent to the user browser in text or binary message format. WebSocket supplies a full-duplex communication channel that allows client and server to send/receive the data at same time, which is quite suitable for the real time communication. The command or feedback from user can deliver to the server anytime without interrupting the real time spatial data receiving and dynamic visualization. The canvas object in HTML5 is a suitable solution to visualize real time spatial data and it can easily implement animation by refreshing. Since the canvas object is implemented natively by the mainstream browsers such as Chrome, Firefox and IE9, the efficiency is guaranteed. For spatial data visualization, the digital map is essential. As one of the most used online digital maps, Google Maps contain rich data sets and useful APIs for the development. In our framework, the real time spatial data will be integrated as a layer of the Google Maps that can be dynamic zoomed in and out.
The proposed framework is straightforward and can be easily implemented. It is efficient for dynamic spatio-temporal data visualization and can be extended for different purpose. In section 4, the details of a prototype system to visualize the real time user location are introduced.
4. IMPLEMENTATION
4.1 Real time data update with WebSocket
WebSocket is a technology providing bi-directional, full-duplex communications channels, over a single Transmission Control Protocol (TCP) socket. W3C and IETF have standardized the WebSocket API and protocol respectively. Mainstream browsers such as Firefox, Google Chrome, Opera, and Safari support WebSocket natively.
Compared with HTTP protocol, WebSocket reduces the network traffic dynamically. In WebSocket protocol, each message/frame has only 2 bytes overhead compared with 871 bytes overhead in HTTP; there is no latency for establishing new TCP connection, which is required for each HTTP message;
also the polling overhead is not required that means only send messages when it is necessary. These features make the WebSocket suitable for real time data transmission over Internet.
To use the WebSocket, we need to setup the server first. Currently, WebSocket has been implemented by many projects with different programming languages. For example, Autobahn is a Python/Twisted-based WebSocket library; Jetty WebSocket is based on Java; libwebsocket is implemented with C; and WebSocket-Node is a pure JavaScript client & server implementation. In this paper, we choose Jetty because it is a widely used open source web container, and can be easily integrated in the Eclipse based development environment. To configure the server, we can run a Java program which starts the Jetty server as follows:
1. Create a Jetty server at a port, such as “Server server = new Server(8085);”
2. Create a self-defined handler that implements the required WebSocket functions such as “onOpen”, “onMessage”, and “onClose” to deal with the user requests. 3. Set the handler to be the server’s default handler and start the server.
In this paper, when a user opens a WebSocket connection, “onOpen” function will be invoked, and a java thread will be initiated to send the real time spatial data to the client.
In the client side, JavaScript is chosen to send/receive message to/from server and update the HTML pages. The WebSocket communication in client side can be implemented as follows:
1. Create WebSocket object, such as “var socket = new WebSocket("ws://localhost:8085")”
2. Then implement the “onOpen”, “onMessage, and “onClose” method such as “socket.onopen = function(){...}” or “socket.onmessage = function(msg){…}”
3. The client and server can send message to each other by the function “socket.sendMessage(…)” and “socket.connection.sendMessage(…)”
4.2 Visualization on Canvas
Canvas is an element defined by HTML5. It supports dynamic, scriptable rendering of 2D shapes and images. Canvas was first introduced by Apple for their Safari browser in 2004 and then was adopted in Gecko and Opera browsers. It is now a standard element in HTML5 and is supported by the current versions of Mozilla Firefox, Google Chrome, Internet Explorer, Safari, and Opera.
The following code defines a Canvas element in HTML page:
<canvas id="example" width="200" height="200"></canvas>
In this paper, when a client receives spatio-temporal data from a server, the canvas object will be used to visualize the information. For the real time data, the animation can be implemented by redrawing the graph in the canvas. SetInterval()
function can be used to update the canvas content automatically in a given time. We also update the screen as soon as new data is received. coordinates of the given geographical location in the map object or visa versa. In this paper, we use the function “fromLatLngToContainerPixel()” to get the coordinate in the pixel space of the canvas from the GPS coordinate. By applying this method, dynamic zoom in and out functions can be automatically implemented without any complex calculation.
5. EXPERIMENTAL RESULTS
5.1 Development environment
The development platform for the proposed framework is Eclipse 3.5.2 running on a PC with Intel 2.4GHz Core2 Duo CPU, 2.39GHz 3.25GB RAM, and Microsoft Window XP SP3. The web page is deployed in Tomcat 7.0 server. The web browser is Google Chrome. The WebSocket server is implemented by Jetty 7.4.4 package. The WebSocket is deployed in port 8085. All tests and experiments are carried out in the local host.
5.2 Spatio-temporal data
To simulate the real time spatial data source, we collected the daily locations of 15 users with GPS trackers. The real time user position is collected every minute and is recorded in a file. With this file, we simulate a real time spatial data source of the current user location. The data source sends out the GPS coordinate of recorded users every second, which enlarges the real time scales by 60 times so we can observer the movement clearly. The data transmitted with WebSocket is GPS coordinates, and will be visualized in client browsers.
5.3 Visualization results
The visualization framework implementation is given in Figure 2. The current user location is indicated in the Google Maps with black dot. In the browser, these dots can move dynamically, and their GPS coordinates are listed in the console behind the map. Through the command line in the bottom, we can send request to the server. When “start” command is sent to the server, a Websocket connection will be created. The current positions of the user GPS will be transmitted to the client browser and the canvas will be updated continually to create the animation from the spatio-temporal data.
Figure 2. Dynamic visualization interface.
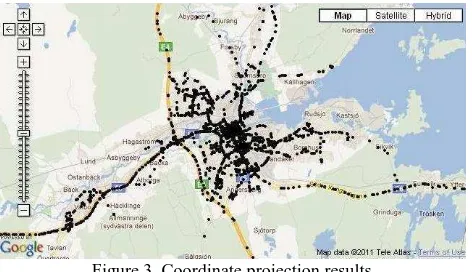
In Figure 3, all the acquired position data is drawn in the Google Maps. It is indicated that most of spots are distributed along the road line, which is reasonable since the users usually take the bus or car to their work from different places along the road.
Figure 3. Coordinate projection results
5.4 Limitations of HTML5 based geovisualization
Although the proposed framework can efficiently visualize the spatio-temporal data with mainstream browsers, there are still some problems with HTML5 based approach. First problem is browser support. Only modern browsers support HTML5 that is a problem for the people still use older version of IE. By 2012 Feb, there are still 7.1% IE6 users worldwide and 23.8% in China. For these people it is difficult to access the HTML5 based applications. The second problem is the unstability. HTML5 is still under development, new features will be added and exiting feature might be changed, which may have influence on the geovisualization framework development. A good thing is that most parts of HTML5 are already standardized and stable for different applications. The third problem is the media licensing issue, for example the users may have to only use mp3 but not ogg format for webkit browsers (safari, chrome).
6. CONCLUSIONS
In this paper, a HTML5 based framework for online spatio-temporal data visualization is proposed. The experimental results suggest that WebSocket is suitable for the
spatio-temporal data transmission and canvas object can efficiently implement the dynamic visualization. Also it is convenient and easy to use Google Maps for geo-location mashup. In the future, the generalization of the spatio-temporal data should be studied to support the large data volume and improve the visualization efficiency. Also 3D supports in HTML5 such as WebGL and X3DOM should be studied for 3D dynamic spatio-temporal data visualization.
ACKNOWLEDGEMENTS
This research is supported by National Natural Science Foundation of China (Nos.71072172 and 61103229), Industry Projects in the Jiangsu Science & Technology Pillar Program (No.BE2011198), Jiangsu Provincial Colleges and Universities Outstanding Science & Technology Innovation Team Fund(No.2001013), International Science & Technology Cooperation Program of China (No. 2011DFA12910).
REFERENCES
Andrienko, G., Andrienko, N., 1999. Interactive maps for visual data exploration, International Journal of Geographical Information Science, 13(4), pp. 355-374.
Andrienko, N., Andrienko, G., Gatalsky, P., 2000., Towards Exploratory Visualization of Spatio-Temporal Data, In: 3rd AGILE Conference on Geographic Information Science-Helsinki/Espoo, Finland, May 25th -27th, 2000.
Askay, S., 2010., Visualizing Spatio-temporal War Casualty Data in Google Earth, http://whereconf.com/where2010/public/ schedule/detail/11048 (20 Dec. 2011).
Boulos M., Warren J., Gong J., Yue P., 2010, Web GIS in practice VIII: HTML5 and the canvas element for interactive online mapping, International Journal of Health Geographics 2010, 9-14
ESRI, 2012. http://www.esri.com/software/arcgis/web-mapping/index.html (28 March 2012).
Gajdos P., Radecky M., 2009, Web Visualization Support for Disaster Management, International Conference for Internet Technology and Secured Transactions, 2009, London, UK, November 9-12, pp. 1-6
Gao Z., Wang C., 2010, Constructing virtual hydraulic circuits using Flash, Computer Applications in Engineering Education, Vol. 18, Iss. 2, pp. 356–374, June 2010
Grigsby, J., 2009 HTML5 from a Mobile Perspective, http://cloudfour.com/html5-from-a-mobile-perspective/ (28 March 2012).
Harjono J, Ng G., Kong D., Lo J., 2010, Building smarter web applications with HTML5, Proceedings of the 2010 Conference of the Center for Advanced Studies on Collaborative Research,oronto, Ontario, Canada, pp. 402-403
html5games, 2012. http://html5games.com/ (28 March 2012).
Mao, B., Yifang Ban, Y., 2011. Online Visualization of 3D City Model Using CityGML and X3DOM, Cartographica, Vol. 46, No.( 2), pp. 109-114.
Q. Ho, Q., P. Lundblad, P., T. Åström, T., and M. Jern, M., 2011,. A Web-Enabled Visualization Toolkit for Geovisual Analytics Visualisation and Data Analysis, In: Proceedings of SPIE: Electronic Imaging Science and Technology, Visualization and Data Analysis, , San Francisco, USA Jan 2011.
Sketchpad, 2012. http://mudcu.be/sketchpad/ (28 March 2012).
W3C, 20112012., HTML5, A vocabulary and associated APIs
for HTML and XHTML, available at :
http://dev.w3.org/html5/spec/Overview.html (28 March 2012).
Wood, J., Dykes, J., Slingsby, A., Clarke, K., 2007., Interactive Visual Exploration of a Large Spatio-Temporal Dataset: Reflections on a Geovisualization Mashup, IEEE Transactions on Visualization and Computer Graphics, Vol. 13, No.( 6), pp. 1176-1183.
X3DOM, 2012. http://www.x3dom.org (28 March 2012).
Ying J., Gracanin, D., Lu C., 2004, Web visualization of geo-spatial data using SVG and VRML/X3D, Third International Conference on Image and Graphics, Hong Kong, China, 18-20 Dec., 2004, pp. 497-500
Zhang, J., Zhu, Y., Yang, Y., Sun J., 2010. An Online Visualization and Data Analysis System for Social and Economic Data Based on Flash Technology, In: The International Archives of the Photogrammetry, Remote Sensing and Spatial Information Sciences, Hong Kong, Vol. 38, Part II, pp. 456-460.