A METHOD TO ESTIMATE TEMPORAL INTERACTION IN A CONDITIONAL
RANDOM FIELD BASED APPROACH FOR CROP RECOGNITION
P. M. A. Diaz a, R. Q. Feitosa a,c,*, I. D. Sanches b, G. A. O. P. Costa c
a Pontifical Catholic University of Rio de Janeiro, Brazil – (pmad9589, raul)@ele.puc-rio.br b National Institute for Space Research, Brazil – [email protected]
c Rio de Janeiro State University, Brazil – [email protected]
Commission VII, WG VII/4
KEY WORDS: Conditional Random Fields, Crop Recognition, Multitemporal Image Analysis.
ABSTRACT:
This paper presents a method to estimate the temporal interaction in a Conditional Random Field (CRF) based approach for crop recognition from multitemporal remote sensing image sequences. This approach models the phenology of different crop types as a CRF. Interaction potentials are assumed to depend only on the class labels of an image site at two consecutive epochs. In the proposed method, the estimation of temporal interaction parameters is considered as an optimization problem, whose goal is to find the transition matrix that maximizes the CRF performance, upon a set of labelled data. The objective functions underlying the optimization procedure can be formulated in terms of different accuracy metrics, such as overall and average class accuracy per crop or phenological stages. To validate the proposed approach, experiments were carried out upon a dataset consisting of 12 co-registered LANDSAT images of a region in southeast of Brazil. Pattern Search was used as the optimization algorithm. The experimental results demonstrated that the proposed method was able to substantially outperform estimates related to joint or conditional class transition probabilities, which rely on training samples.
1. INTRODUCTION
Remote sensing (RS) data has been increasingly applied to assess agricultural yield, production, and crop condition. Single date classification is inappropriate for this purpose, as the spectral appearance changes over time as crops evolve through their characteristic phenological circles.
Conditional Random Fields (CRF) have deserved considerable attention of the scientific community in the recent years for crop recognition from multitemporal images, mainly due to its ability to model interactions of neighbouring image sites both in the spatial and temporal domains. These two forms of interactions are quite different in nature and the strategies proposed so far to model them are similarly diverse. In the present work we concentrate on the temporal interactions alone.
Methods for multitemporal image analysis can be grouped into three main categories (Hoberg et al., 2011). The first one is related to the classification of single images based on a single powerful classifier or on a combination of classifiers. This approach does not take into account the temporal dependencies (Bruzone et al., 2004) (Waske and Braun, 2009). The second one is based on modelling temporal dependencies by rules (Simonneaux et al., 2008), or adaptive strategies to select the relevance of features over time for specific crops (Müller et al., 2010). The last one incorporates temporal dependencies into statistical models (Melgani and Serpico, 2004) (Leite et al., 2011).
Approaches that take the temporal dependencies into account usually model temporal interaction by class transition matrices that can be determined by an expert (Hoberg et al., 2010) (Hoberg et al., 2011) empirically from existing data sources,
* Corresponding author
or computed statistically (Leite et al., 2011) (Kenduiywo et al., 2015).
In (Hoberg et al., 2015) and (Liu et al. 2008), temporal inter-actions are represented by transition matrices � whose ele-ments are related to conditional probabilities, in other words, � , is related to the probability of an image site belonging to class at epoch � + , given that it belongs to class at epoch � , whereby and are class labels and � and � + are adjacent epochs in the multitemporal data set.
In contrast, other works model interaction potentials as joint probabilities (e.g., Niemeyer et al., 2014). In the present con-text, � , would be related in this case to the probability of an image site belonging to class in epoch � and to in epoch � + .
Both approaches lead to theoretically plausible estimates of the interaction potential, but with no guarantee that it maximizes the classification accuracy.
In this work we address this issue. We propose a supervised method to estimate the temporal interaction in a CRF based framework for crop recognition. Starting from a class transition matrix computed upon training samples either as conditional or joint probabilities, the method fine tunes the estimate so as to maximize the CRF classification accuracy.
The remainder of the paper is organized as follows. Section 2 presents the CRF based approach used in the experiments as well as the proposed method. Section 3 presents and discusses the results obtained in the experiments. Finally, Section 4 summarizes the conclusions obtained in this work and indicate future directions.
2. METHODOLOGY
2.1 Conditional Random Fields
Let = [ , , , , … , , ] denote the vector comprising the sequence of class labels associated to an image site ∈ � at dates � , … , � , with � < � + for = , … , − , where � is the set of all geographical sites in the data set. Each component
, may take values in � = { , , … , }, where is the
number of classes defined by crop types in different phenological stages. The label vector must be inferred from the image data consisting of a set � = { , , … , , } of site
wise vectors , for ∈ � and = , … , . The CRF solution for this problem is the most probable label sequence ̂, which is obtained by maximizing the posterior probability � |� given by:
where � and denote respectively the association and the temporal interaction potentials at date � , and � is the set of date indices temporally adjacent to � .
By setting �[−� ( , , , )] equal to the posterior discriminative classifier. The temporal interaction is represented by a × matrix � , whose rows refer to the class at the earlier date (� ) and columns to the class at the subsequent date (� + ).
2.2 Proposed Method
The proposed method estimates − transition matrices � , each refering to a pair of consecutive dates � and � + , for = , … , − . Instead of targeting the performance over all sequence, each � is estimated separately for each pair of consecutive dates. For sequences comprising two dates equation (2) takes the form
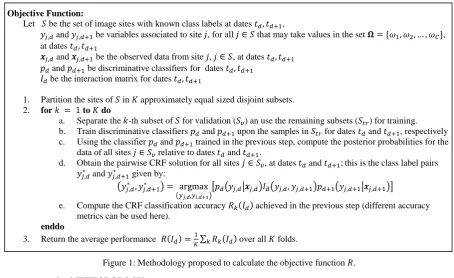
Basically, the estimation procedure computes the transition matrix that maximizes a given accuracy metric � Figure 1: Methodology proposed to calculate the objective function .
Objective Function:
1. Partition the sites of in � approximately equal sized disjoint subsets. 2. for = to � do
a. Separate the -th subset of for validation ( �) an use the remaining subsets ( ��) for training. b. Train discriminative classifiers � and �+ upon the samples in �� for dates � and � + , respectively c. Using the classifier � and �+ trained in the previous step, compute the posterior probabilities for the
data of all sites ∈ � relative to dates � and � + .
e. Compute the CRF classification accuracy � achieved in the previous step (different accuracy metrics can be used here).
enddo
3. Return the average performance � =
represents the interaction potential. Cross validation is the standard procedure in these cases.
Accordingly, the training data is split in � folds. One fold, say the k-th one, is taken for validation, while the remaining � − folds are used to train the discriminative classifiers � and � + . For a given � , the CRF accuracy � of the data in the -th fold is computed using the association potential provided by � and � + . The procedure is repeated for k varying from 1 to � and the average over all � runs are taken as the accuracy associated to � , formally
� = �∑ � (4)
The procedure to estimate the optimum transition matrix �̂ reduces to an optimization problem having � as objective function, specifically
�̂ = argmax
�� � (5)
The procedure to compute the objective function is formally presented in Figure 1. It should be noted that different accuracy functions can be used for � .
In the worst case, the number of parameters to estimate is equal to , the number of elements of � . However, this can be reduced by exploiting prior knowledge. For instance, the terms referring to class transitions that knowingly do not occur from � to � + , can be set to zero and need not to be estimated. In this way the problem may be considerably simplified and the demand for training samples alleviated.
Many optimization algorithms can be used to compute equation 5. Most of them require a good starting solution. In this study we considered two possibilities. First, we took as starting solution the joint probability estimates given by:
� solution is given by conditional probability estimates, formally
� , = #{ , = | , + = }/� (7)
where the numerator #{ , = | , + = }represents the number of training samples belonging to class at epochs � , given that it belongs to class at � + . Again, the denominator � is the total number of training samples.
3. EXPERIMENTAL ANALYSIS
3.1 Dataset
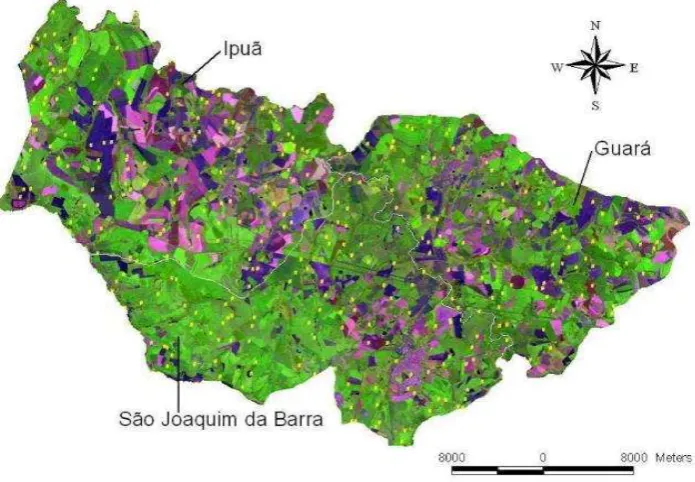
The study area corresponds to 124.100 ha in the state of São Paulo, Brazil (see Figure 3). Agriculture is the main activity in this area. The most common crops found in the region are: sugarcane, soybeans and corn. Sugarcane is a semi-perennial crop with cycles of 12 and 18 months. On the other hand,
soybeans and corn are annual crops with cycles between 3 – 6 months. Two broad phenological states were considered: Growing and Adult. The stages prior to seeding and after harvesting, which were assigned to no crop, were also modelled. Even though Pasture and Riparian Forest are actually not crops, they were also treated as crop types in our model.
The image sequence was composed of a total of 12 Landsat scenes (see acquisition dates in Table 1), from either TM/Landsat-5 or ETM+/Landsat-7 (Sanches, 2004). Bands from 1-5, 7 and NDVI were used as features. These images were stacked forming a single multi-date image with 72 bands. Then, a Gaussian smoothing and the Sobel operator were applied (c.f. Leite et al., 2011). Finally, the Watershed segmentation algorithm was employed to generate segments with consistent borders across all images. As the images were co-registered, each segment corresponds to the same geographical region, which is crucial for temporal analysis. A total of 291 reference image locations were selected in the study area and two experts classified them visually in each image indicating the crop class and corresponding phenological stage.
Table 1: Acquisition dates of the images in the dataset.
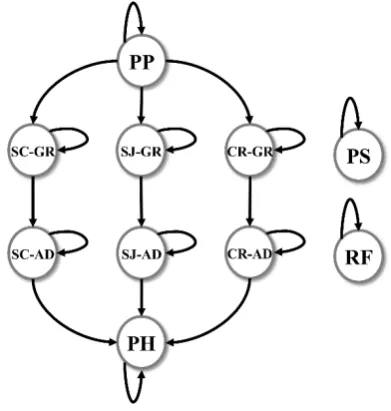
Figure 2: The underlying Markov model.
3.2 Model Description
considered for each crop: corn (CR), soybeans (SJ) and sugarcane (SC). We further regarded the prepared soil (PP) stage, which corresponds to the time after the soil was prepared for sowing before the crop sprouts and while the spectral response is mostly determined by bare soil. A fourth stage called post-harvesting (PH) was added to the model. It represents the period after harvest when the vegetation left overs still lay on the soil before it starts being prepared for the next seeding. In our model prepared soil (PP) and post-harvesting (PH) are assigned to no particular crop. As for Pasture (PS) and Riparian Forest (RP) we assumed that both are permanently in the Adult (AD) stage.
It is important to bear in mind that the basic model of Figure 2 might change depending on the pair of consecutive dates being considered. For instance, class transitions that might occur in summer might not occur in winter and vice-versa. Furthermore, some classes might not appear at some dates, implying in simpler models.
Class Crop Stage # samples
PP
No crop Prepared Soil 611
PH Post-Harvest 355
SJ-GR
Soybeans Growing 48
SJ-AD Adult 190
CR-GR
Corn Growing 23
CR-AD Adult 49
SC-GR
Sugarcane Growing 356
SC-AD Adult 1157
PS Pasture Adult 272
RF Riparian
Forest Adult 357
Table 2: Classes considered in the Markov model and their relation to crop types and phenological stages.
Table 2 relates the classes shown in Markov network of Figure 2, the crop types and the phonological stages. The rightmost column of Table 2 informs the number of samples available in our data set for each crop type and phonological stage.
Notice that it is an unbalanced dataset, being corn the class with least samples and sugarcane the class with most samples.
3.3 Experimental Protocol
Due to the scarcity of available labelled samples (image sites) we adopted the leave-one-out strategy. In other words, we separated one sample for testing, and trained the model upon the remaining 290 samples. Also, for the training procedure we followed a leave-one-out strategy, which corresponds to setting � = 9 in the scheme presented in Figure 1. This procedure was repeated for each of the 291 sites in the data set. The results presented later in this paper are averages over all runs.
To generate association potentials we coded the Rotation Forest (ROF) (Rodriguez et al., 2006) classifier in MATLAB. Prior to the training step the samples were replicated to mitigate the effect of sample imbalance among the classes.
For the optimization task we used a function available in the MATLAB Optimization Toolbox that implements the Pattern Search (Audet et al., 2003) algorithm. This function permits to impose constraints to the search procedure. In all experiments the elements of the transition matrices were constraint to be non-negative. This follows from the definition of random fields.
elements of the whole transition matrix were constrained to sum up to 1; this is necessary to deal with the fact that multiplying � on the right hand side of equation (3) by any positive factor does not alter the result.
As baseline to compare the performance of our method we took in the estimates provided by equation (6), for conditional probability based, and by equation (7) for joint probability based estimates. These were also used as starting solution for the optimization procedure. Thus, the experiments aimed at assessing how much our method was able to improve the accuracy in relation to the starting transition estimates.
As mentioned before, we reduced the number of parameters to be estimated by assuming that elements of � corresponding to impossible class transitions were known beforehand as being equal to zero.
The objective function � was formulated as the overall accuracy (OA) or the average per class accuracy (AA), for three different set of labels: classes, crop types and phenological stages, which correspond to the first, second and third columns of Table 2.
3.4 Results
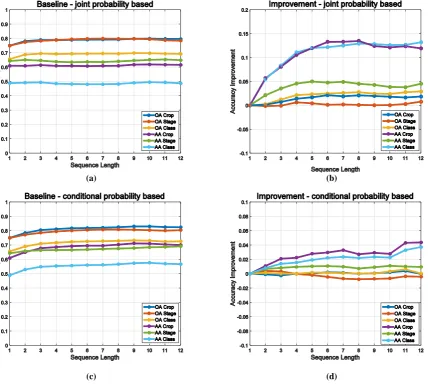
The results are shown in Figure 4 and represent average values computed over all sequences of a given length, which varies from 1 to 12.
Figure 4(a) and 4(c) refer to the baseline based on joint and on conditional probabilities, respectively. These results confirm the expectation that a multitemporal dataset allows for an improvement relative to a monotemporal one. The accuracy achieved with sequences of length 2 was higher than for a single image, for all accuracy metrics. Interestingly, adding more images brought little improvement, for some metrics it was even deleterious. This can be partially explained by the fact that more than one phenological cycle might be included as more images are added to the sequence. Indeed, no improvement should be expected from adding images if the sequence already contains one full cycle. Apart from Pasture and Riparian Forest, the phenological cycles of some crops are shorter than the time frame covered by the data set. Soybeans and corn, for instance, have short cycles (about 5 months), whereas some sorts of sugarcane have 12 month long circles.
In both plots overalll accuracies are much higher than the corresponding average class accuracies. The high imbalance in the number of samples per classes in our dataset is responsible for these results. Recall that in our experiments
(a) (b)
(c) (d)
samples were replicated to mitigate this problem as far as the association potentials was concerned. No strategy was applied to alleviate sample imbalance in the estimation of interaction potentials.
The estimates based on conditional probabilities (Figure 4c) outperformed the joint probabilities based estimates (Figure 4a) in up to 0.03. The sample imbalance can also have caused such superiority.
The accuracies reported Figure 4a and 4c are substantially inferior when expressed in terms of classes than in terms of crop or stage separately. Obviously, identifying both crop and stage as encoded in classes is much harder than identifying correctly at least one of them.
Figure 4b shows the improvement brought by the proposed method relative to the accuracies reported in Figure 4(b). It should be noted that each curve refers to a different metric. In each case the same metric was used as objective function for the optimization procedure.
The main finding from these results is that the method was consistently superior to the baseline for all metrics considered in the experiments. The improvement was significant for average class accuracies. Our method was able to offset the effect of sample imbalance, which degraded the average accuracies shown in Figure 4.
For sequence lengths longer than 5 our method outperformed the base line in about 0.13 in absolute terms, both for class and for crop recognition. For phenological stage recognition the improvement was close to 0.05. Similar to Figure 4a the curves of Figure 4c also stabilize but at a larger sequence length - around 6 instead of 2. This observation is consistent with the intuition that the benefits from the CRF based models for multitemporal crop recognition is impaired by a poor estimate of the interaction potentials. As more images are added to the sequence the inaccuracies in the interaction potential estimates accumulate, until the inclusion of more images brings no additional benefit. Thus, we presume that, in relation to the baseline, our method provides a better estimate of the interaction potentials and allows for a better exploitation of multitemporal data.
The other curves in Figure 4c refer to overall accuracies. Even though our method also outperformed the baseline, the improvement is not so significant in such cases; around 0.02 and 0.03 for class and crop recognition and close to zero for phenological stage recognition. Again, this is probably due to the high sample imbalance in the data set.
Finally, Figure 4d shows how much our method improved the accuracy in relation to the baseline derived from conditional probabilities. Clearly, the improvement was lower than what we observed for baseline based on joint probabilities. Nevertheless, most aforesaid conclusions still hold. The only exception is the curve of Figure 4d related to OA Stage that shows a slight accuracy decrease for sequences longer than 5.
4. CONCLUSIONS
This work proposed a method to estimate temporal interaction in a Conditional Random Field (CRF) based framework for crop recognition from multitemporal remote sensing images. Temporal interactions are represented by matrices, whose elements are independent from the observed data. Basically,
the method searches the space defined by the elements of the transition matrix for the set of values that maximizes the accuracy of the CRF based model upon a given set of labelled samples.
The method was validated upon a sequence of 12 Landsat multitemporal images comprising five agricultural targets. Different accuracy metrics were tested as objective function for an optimization procedure that delivers the estimates. The experiments demonstrated that the method is able to improve classification accuracy by refining initial estimates based on joint and condition class transition probabilities.
This study only considered temporal interaction. In the continuation of this research spatial interaction will be incorporated to the CRF model.
ACKNOWLEDGEMENTS
The authors acknowledge the support provided by CNPq (Conselho Nacional de Desenvolvimento e Pesquisa) and CAPES (Coordenação de Aperfeiçoamento de Pessoal de Nível Superior) .
REFERENCES
Audet, C., & Dennis, J. (2003). Analysis of Generalized Pattern Searches. SIAM J. OPTIM, 13(3), 889-903.
Bruzzone, L., Cossu, R., & Venazza, G. (2004). Detection of land-cover transitions by combining multidate classifiers. Pattern Recognition Letters, 25(13), 1491-1500.
Feitosa, R., Costa, G., Mota, G., Pakzad, K., & Costa, M. (2009). Cascade multitemporal classification based on fuzzy Markov chains. ISPRS Journal of Photogrammetry and Remote Sensing, 64(2), 159-170.
Hoberg, T., Rottensteiner, F., & Heipke, C. (2010). Classification of multitemporal remote sensing data using conditional random fields. Pattern Recognition in Remote Sensing (PRRS), 1-4.
Hoberg, T., Rottensteiner, F., & Heipke, C. (2011). Classification of multitemporal remote sensing data of different resolution using Conditional Random Fields. 2011 IEEE International Conference on Computer Vision Workshops (ICCV Workshops) (pp. 235-242). IEEE.
Hoberg, T., Rottensteiner, F., Feitosa, R., & Heipke, C. (2015). Conditional Random Fields for Multitemporal and Multiscale classification of optical satellite imagery. IEEE Transaction on Geoscience and Remote Sensing, 53(2), 659-673.
Kenduiywo, B. K., Bargiel, D., & Soergel, U. (2015). Spatial-Temporal Conditional Random Fields Crop Classification from Terrasar-X Images. ISPRS Annals of the Photogrammetry, Remote Sensing and Spatial Information Sciences, 2(3), p. 79.
Liu, D., Song, K., Townshend, J., & Gond, P. (2008). Using local transition probability models in Markov random fields for forest change detection. Remote Sensing of Environment, 112(5), 2222--2231.
Melgani, F., & Serpico, S. (2003). A Markov Random Field approach to spatio-temporal contextual image classification. IEEE-TGARS, 41(11), 2478-2487.
Müller, S., Heipke, C., & Pakzad, K. (2010). Classification of farmland using multitemporal aerial images. (Haifa, Ed.) Intenational Archive of the Photogrammetry, Remote Sensing and Spatial Information Sciences, XXXVIII(PART 4-8-2/W9), 70-74.
Niemeyer, J., Rottensteiner, F., & Soergel, U. (2014). Contextual classification or lidar data and building object detection in urban areas. ISPRS Journal of Photogrammetry and Remote Sensing, 87, 152-165.
Rodriguez, J., Kuncheva, L., & Alonso, C. (2006). Rotation forest: A new classifier ensemble method. IEEE Transactions of Pattern Analysis and Ma chine Intelligence, 28(10), 1619-1630.
Sanches, I. (n.d.). Sensoriamento remoto para o levantamento espectro-temporal e estimativa de áreas de culturas agrícolas. Master Dissertation. São José dos Campos, Brazil.
Simonneaux, V., Duchemin, B., Helson, D., Er-Raki, S., Olioso, A., & Chehbouni, A. (2008). The use of high resolution image time series for crop classification and evotranspiration estimate over an irrigated area in central Morocco. International Journal of Remote Sensing, 29(1), 95-116.