CLASSIFICATION OF CROPLANDS THROUGH FUSION OF OPTICAL AND SAR
TIME SERIES DATA
S. Park a and J. Im a*
a
School of Urban and Environmental Engineering, Ulsan National Institute of Science and Technology (UNIST), Ulsan, Republic of Korea - (qkrtjsdud5, ersgis)@unist.ac.kr
Commission VII, WG VII/6
KEY WORDS: Multi-temporal, Data fusion, Landsat 5, Radarsat-1, Machine learning, Crop classification, Paddy rice index
ABSTRACT:
Many satellite sensors including Landsat series have been extensively used for land cover classification. Studies have been conducted to mitigate classification problems associated with the use of single data (e.g., such as cloud contamination) through multi-sensor data fusion and the use of time series data. This study investigated two areas with different environment and climate conditions: one in South Korea and the other in US. Cropland classification was conducted by using multi-temporal Landsat 5, Radarsat-1 and digital elevation models (DEM) based on two machine learning approaches (i.e., random forest and support vector machines). Seven classification scenarios were examined and evaluated through accuracy assessment. Results show that SVM produced the best performance (overall accuracy of 93.87%) when using all temporal and spectral data as input variables. Normalized Difference Water Index (NDWI), SAR backscattering, and Normalized Difference Vegetation Index (NDVI) were identified as more contributing variables than the others for cropland classification.
* Corresponding author
1. INTRODUCTION
Many optical satellite sensors such as Landsat series have been widely used for land cover/land use classification. However, those sensors are often affected by weather conditions (e.g., cloud, haze). On the other hand, Synthetic Aperture Radar (SAR) sensors including RADARSAT-1 are not influenced by weather conditions, providing the dielectric properties of land surface. Some land cover types are not well classified only using optical sensor data, while they might be well classified when SAR data are incorporated. Studies fusing both optical and SAR images with various techniques have been introduced to improve land cover classification (Sheoran & Haack 2013; Stefanski et al., 2014; Amarsaikhan et al., 2012). Temporal information (i.e., time series data) can also improve classification accuracy because some land cover types have different temporal patterns. In particular, since each vegetation type has its own phenology, multi-temporal data are very useful to classify vegetation. The objective of this study is to enhance cropland classification using multi-spectral and temporal dimensions of satellite data.
2. STUDY AREA AND DATA
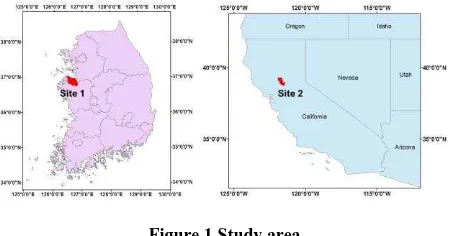
Two study areas with different environment and climate conditions were selected. Site 1 is Dangjin, South Korea and site 2 is Sutter county in California, US (Figure 1).
In this study, optical images from Landsat 5, SAR images from RADARSAT-1 and ALOS PALSAR, and digital elevation models (DEM) from Shuttle Radar Topography Mission (SRTM) in South Korea (2003-2005) and California, U.S (2006-2009) were used to classify cropland. Multi-temporal Landsat 5 band 1-6 reflectance, Normalized Difference Vegetation Index (NDVI), Normalized Difference Water Index
(NDWI), RADARSAT-1 C-band backscattering, ALOS PALSAR L-band backscattering and elevation data were used as input variables for classification.
Figure 1 Study area
3. METHODOLOGY
Two machine learning approaches—Random Forest (RF) and Support Vector Machine (SVM)—were used as classifiers to perform land cover classification. Land cover data produced by Korea Ministry of Environment, U.S. Geological Survey (USGS) and visual interpretation of google earth high resolution images were used to collect reference data. Seven classification schemes were established considering temporal and spectral dimensions of data and all schemes were evaluated through accuracy assessment using a separate validation dataset.
4. RESULTS AND DISCUSSIONS
Results show that the SVM approach resulted in the best performance with an overall accuracy of 93.87% when using all temporal and spectral data as input variables. According to the The International Archives of the Photogrammetry, Remote Sensing and Spatial Information Sciences, Volume XLI-B7, 2016
XXIII ISPRS Congress, 12–19 July 2016, Prague, Czech Republic
This contribution has been peer-reviewed.
relative variable importance provided by the machine learning approaches, data from the planting season (typically in May for paddy rice) had the largest contribution to the cropland classification. In addition, NDWI, SAR backscattering, and NDVI appeared more contributing than the other variables for cropland classification (Figure 2).
Figure 2 Rank of variable importance. The number means the rank of importance for each classification model.
NDWI, SAR backscattering, and NDVI also showed unique temporal characteristics in transplanting season (Figure 3). The growing season of vegetation (May to September) for both sites are generally between April and October. The rice paddy class shows the dramatic increase of NDVI and NDWI between the transplanting season and harvesting season when compared to the other vegetation related classes (e.g., field and grass). This is because rice paddy is planted after May when is transplanting season. SAR backscattering of the rice paddy class also shows a different pattern in the transplanting season (doy= 152) because rice paddy is full of water in that season.
Figure 3 Time series of NDVI, NDWI and backscattering
5. CONCLUSION
In this study, croplands were classified through fusing optical and SAR multi-temporal images based on machine leaning approaches. Seven classification scenarios were tested and the one that uses all temporal and spectral data as input variables with SVM showed the best performance (overall accuracy ~ 93.87%).
REFERENCES
Sheoran, A., & Haack, B., 2013. Classification of California agriculture using quad polarization radar data and Landsat Thematic Mapper data. GIScience & Remote Sensing, 50(1), pp. 50-63.
Stefanski, J., Kuemmerle, T., Chaskovskyy, O., Griffiths, P., Havryluk, V., Knorn, J., ... & Waske, B., 2014. Mapping land management regimes in western Ukraine using optical and SAR data. Remote Sensing, 6(6), pp. 5279-5305.
Amarsaikhan, D., Saandar, M., Ganzorig, M., Blotevogel, H. H., Egshiglen, E., Gantuyal, R., ... & Enkhjargal, D. (2012). Comparison of multisource image fusion methods and land cover classification. International Journal of Remote Sensing, 33(8), pp. 2532-2550.
The International Archives of the Photogrammetry, Remote Sensing and Spatial Information Sciences, Volume XLI-B7, 2016 XXIII ISPRS Congress, 12–19 July 2016, Prague, Czech Republic
This contribution has been peer-reviewed.