INDOOR NAVIGATION FROM POINT CLOUDS: 3D MODELLING AND OBSTACLE
DETECTION
L. Díaz-Vilariño a,d *, P. Boguslawskib, K. Khoshelhamc, H. Lorenzod, L. Mahdjoubib,
a Dept. of Carthographic and Land Engineering, University of Salamanca, Hornos Caleros 50, 05003, Avila, Spain – [email protected] b Faculty of Environment and Technology, Department of Architecture and the Built Environment, Frenchay Campus, Coldharbour
Lane, University of the West of England, Bristol BS16 1QY, UK – (Pawel.Boguslawski, Lamine.Mahdjoubi)@uwe.ac.uk c Department of Infrastructure Engineering, University of Melbourne, Melbourne, 3010, Australia – [email protected]
d Applied Geotechnologies Group, Dept. Natural Resources and Environmental Engineering, University of Vigo, Campus
Lagoas-Marcosende, CP 36310 Vigo, Spain – (lucia, hlorenzo)@uvigo.es
Commission IV, WG IV/7
KEY WORDS: indoor modelling, laser scanner, automation, path planning, obstacles, real navigation
ABSTRACT:
In the recent years, indoor modelling and navigation has become a research of interest because many stakeholders require navigation assistance in various application scenarios. The navigational assistance for blind or wheelchair people, building crisis management such as fire protection, augmented reality for gaming, tourism or training emergency assistance units are just some of the direct applications of indoor modelling and navigation.
Navigational information is traditionally extracted from 2D drawings or layouts. Real state of indoors, including opening position and geometry for both windows and doors, and the presence of obstacles is commonly ignored.
In this work, a real indoor-path planning methodology based on 3D point clouds is developed. The value and originality of the approach consist on considering point clouds not only for reconstructing semantically-rich 3D indoor models, but also for detecting potential obstacles in the route planning and using these for readapting the routes according to the real state of the indoor depictured by the laser scanner.
* Corresponding author
1. INTRODUCTION
It is estimated that people living in cities spend on the average 90% of their time indoors (EPA 2009). Furthermore, the United Nations estimates that over 70% of the world’s population will be living in towns and cities by 2050 (UN, 2014) where buildings and their large variety of associated spaces such as garages, underground passages are becoming increasingly complex clusters of enclosed spaces (Zlatanova et al, 2014).
Indoor navigation consists on finding the most suitable path connecting two points within an indoor environment while avoiding collision with obstacles. The navigational assistance for blind or wheelchair people is one of the direct applications of indoor path planning, where algorithms are developed to generate efficient routes according to their mobility restrictions (Swobodzinski and Raubal, 2008). Another application is related with building crisis management, such as fire protection or planned terrorist attacks, where planned routes can provide possible safe and efficient evacuation options under different emergency conditions. Augmented reality for gaming, tourism or training emergency assistance units are other direct applications of indoor navigation.
Existing literature primarily extracts navigational information from simple geometric models such as 2D drawings or building layouts (Liu and Zlatanova, 2013). However, successful path
planning for indoor spaces depends on the accurate and updated geometry, semantics and topology of the building components and spaces. On one hand, openings in buildings, such as doors and windows, are relevant for indoor planning specially in crisis management applications. On the other hand, detection and characterization of real obstacles such as furniture are of a great interest because obstacles usually disturb the navigation process.
With regard to the first issue, Xiong et al (2015) introduces a method that supports 3D indoor path planning from semantic 3D models represented in LoD4 CityGML. Although the method considers obstacles, the experiments for testing the method are carried out with models without the presence of obstacles. With regard to obstacles detection and consideration for indoor path planning, several approaches have been proposed (De Berg et al, 2000; Goetz and Zipf, 2011; Mortari et al, 2014; Liu et al, 2015) but all of them manually represent obstacles in their navigational models as 2D elements.
Building Information Models (BIMs) contain all valuable information for indoor navigation (Isikdag et al, 2013). However, they usually represent the as-designed facility rather than the real state of the building and as-built models are not available for many buildings.
In the last years, laser scanner has become an efficient instrument for collecting three-dimensional and high quality data of the as-built status of large-scale infrastructure and intense efforts have been made towards the as-built modelling from point clouds (Haala and Kada, 2010; Volk et al, 2014; Patraucean et al, 2015). Most of existing literature deals with the reconstruction of building components, spaces and openings while less attention is paid to obstacle detection. Indoor environments are often busy and cluttered with the presence of objects such as pieces of furniture that can act as obstacles in indoor path planning. Although obstacles detection is fundamental for real indoor path-finding, state of the art researchers and implementation of the indoor navigation do not usually deal with the obstacle issue and routing algorithms mostly consider empty spaces (Liu and Zlatanova, 2013).
The focus of this work is to develop a real indoor-path planning methodology based on 3D point clouds. The value and originality of this work consist on considering point clouds not only for reconstructing semantically-rich 3D indoor models, but also for detecting potential obstacles in the route planning and using it for readapting routes according to the real state depictured by the laser scanner.
This paper is organized as follows. Section 2 describes the proposed methodology. Section 3 deals with the results obtained from applying the methodology to different a real case study while Section 4 is devoted to conclude this work.
2. METHODOLOGY
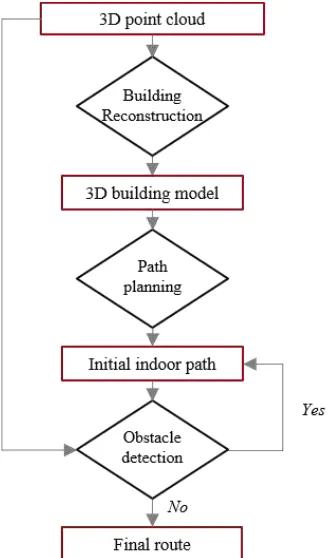
The general workflow of the methodology is summarized in Figure 1. Point cloud is segmented and regions classified as floors, ceilings or walls are used to building reconstruction. The remaining regions are used for obstacle detection and route correction.
Figure 1: General workflow of the proposed methodology.
2.1 Point cloud segmentation and building reconstruction.
Point clouds are used in this work for two main purposes. On one hand, those points corresponding to envelope elements, such as floor, ceiling and walls, are taking into account for building reconstruction. The remaining points are considered to represent indoor objects such as furniture and they are used subsequently for obstacle detection (Section 2.2.).
Point cloud segmentation is the first step of the methodology. A region-growing algorithm similar to (Rabbani et al 2006) is implemented to segment point cloud into planar regions. The algorithm includes in the region all those points satisfying two geometric conditions: planar fitting and surface smoothness. Thresholds are coarse enough that window and door elements are included in the region of the wall where they are contained.
Once the point cloud is segmented, regions are labelled into four classes. The first three classes, floors, ceilings and walls, are intersected according to their adjacency to obtain the boundary points that define the correspondent building elements. The last class encloses the remaining points considered as obstacle candidates. The obstacle class also includes structural elements such as columns since they can act as obstacles for navigation if they are inside the space enclosed by walls, ceilings and floors.
The second step of the methodology corresponds to the reconstruction of windows and doors since they are needed to complete the 3D model for real indoor navigation.
As in (Díaz-Vilariño et al, 2015, b), the method to reconstruct windows and doors consists on finding parametric shapes in images, based on the Generalized Hough Transform (GHT). However, instead of using colour information to reconstruct the images, this methodology creates binary images from the point cloud (Figure 2.c). In this regard, for each wall, its associated planar region is converted to a raster by projecting the points on the wall plane defined by its four boundary points (Figure 2.a, 2.b). A rectangular matrix is created and pixels are assigned a value of one or zero depending on whether or not points fall inside the pixel.
To ensure a successful rasterization, wall plane and regions are rotated around Z-axis in a way that they are become parallel to XZ or YZ axis, as appropriate (Díaz-Vilariño et al, 2015, a). As a result, a binarized raster is obtained which is submitted to a median filter to reduce salt and pepper noise.
Finally, an edge detector using the Canny method is performed to create the edge image which is the input to the GHT (Figure 2.d). Rectangles are searched in wall edge images taking into account a minimum and maximum width and length.
Figure 2: a) Point cloud, b) Point cloud projected into a rectangular matrix, c) Binarized image, d) Edge image. The International Archives of the Photogrammetry, Remote Sensing and Spatial Information Sciences, Volume XLI-B4, 2016
Window and door reconstruction is designed as a method to search rectangular holes in wall regions. Therefore, this step applies if no points are measured in window and door areas. This situation is obtained for instance if doors are opened and if glass windows are not covered by curtains or other objects.
In addition, windows and doors could be confused with holes caused by the presence of other objects with similar size and shape such as cupboards, bookshelves, etc. In this case, candidates can be pruned by analysing the original 3D point cloud through histograms point-to-plane as in (Díaz-Vilariño, 2014).
Finally, information extracted from point cloud is structured in an open schema: the gbXML. Although other schemas such as cityGML, indoorGML and IFC are more complete, gbXML is suitable for the purpose of this research since it contains geometry, topology and semantics, which are necessary for extracting the navigational information needed for Section 2.3.
2.2 Obstacle detection
In the proposed approach, obstacle is defined by the existence of a set of 3D points interrupting the trajectory defined by a path.
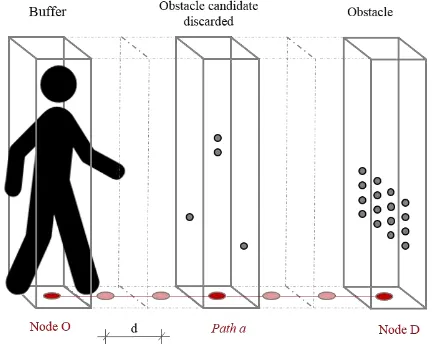
The presence of obstacles is analysed from the creation of a buffer which represents a person (Figure 3). In this approach, a rectangular prism is selected as buffer shape. The algorithm moves the buffer along the path and checks for each point trajectory if there are points of the obstacle class (segmented in Section 2.1.) inside the buffer.
Figure 3: Schema of the obstacle detection strategy.
In case a set of points is detected inside the buffer, next step is to determine if the obstacle candidate is a true of false obstacle for indoor navigation. Two features are considered for evaluating obstacle candidates: size and aggregation. Since these features depend on point cloud density, thresholds are also function of it. According to this, minimum size corresponds to the number of points in an area of 0.1m x 0.1m because we consider that the presence of an object of this size along the trajectory is condition enough for changing the navigation route. On the other hand, aggregation is measured as the mean of the Euclidean distance from each point to the closest point. trajectory defined by the origin and destination. Displacement (d) is equal to buffer depth to ensure that the whole path is analysed. For each buffer position, candidate obstacles are searched and classified as false or true positives. If a true positive obstacle is obtained, navigation is interrupted and an alternative route should be calculated (Section 2.3.).
2.3 Path planning and route correction
The original gbXML model is used to reconstruct a navigable model based on the model geometry, topology and semantics (Boguslawski et al, 2015). Surfaces representing walls and slabs are retrieved from gbXML and joined together based on their geometry to form a closed cell representing an indoor space, e.g. a room. It may be required to validate a model in order to preserve consistency between the geometry and topology. Missing faces and overlapping between adjacent rooms are experienced in case of some complex models. Information about adjacent spaces stored in a surface element is used to reconstruct adjacency relationships among spaces, which are stored in the final model as a building logical network. Location of openings and their type, such as doors or windows, are attached to the surface element and they are introduced in the logical network. Spaces and openings are identified in the final model by individual nodes. The logical network is not suitable for path planning. Additional navigable networks are calculated for selected spaces, e.g. corridors, rooms of a complex shape, etc.
The method of navigable network, Variable Density Network (VDN), calculation is based on Voronoi Diagram (VD) construction, where the dual graph to VD is used for path planning (Boguslawski et al, in press). Initial floor plan of an indoor space is tessellated into a set of adjacent cells. Initial points triggering Voronoi cells are the nodes representing doors and concave corners projected on the floor surface. Additional points are introduced in the network densification process. The level of densification can be independently specified for different spaces, for example, a coarse densification may be specified by a room name, to the closest exit from a building. In order to find a path for a point explicitly specified by xyz coordinates (see Table 1), this point is added to the network, which triggers new Voronoi cell calculation. In a similar way a new nodes are added, when obstacle points are detected by the mechanism introduced in Section 2.2 and added to the network. However, the obstacle node is excluded from navigation and is not used for path calculation. Additionally, buffer nodes around the obstacle are introduced – 0.5 m x 0.5 m square area, representing the size of a person. If buffers for obstacle points overlap, a convex hull region is calculated and used as a new buffer area. Links inside the buffer area are excluded from navigation. Then, the new path is calculated and new obstacles added until the clear way to the exit, i.e. without any obstacles, is found.
The process of obstacle point introduction in the navigable network is shown in Figure 4. In the top row, an updated fragment of the network is show. The grey area is excluded from navigation. O is the origin point for path finding. The middle row shows detected obstacle points and buffers around them, while new obstacle and buffer points added to the network are shown in the bottom row. Figure 4.a shows the initial navigable network with the origin point and two links to two doors. New obstacle point is detected on the path and it is added with the corresponding buffer to the network (see Figure 4.b). New path avoiding the excluded area is calculated and new obstacle detected. The first steps of this iterative process are presented in Figure 4.b-e. In steps d and e, a convex hull is calculated for overlapping buffers, which is used as a new buffer area.
Figure 4: Obstacles in the navigable network: O – origin point, - obstacle points - additional nodes, grey area is excluded from navigation, a)-e) network update steps.
In the proposed approach, the Dijkstra algorithm is used for path finding. The weight of links in the network is calculated based on their length. Thus, the result is the shortest path from the origin point to the closest exit.
3. RESULTS AND DISCUSSION
The methodology has been tested with a real case study under four indoor navigation routes. Section 3.1. deals with the instruments and data used, while Section 3.2. introduces the results of indoor path-finding in real scenarios from point clouds.
3.1 Instruments and data
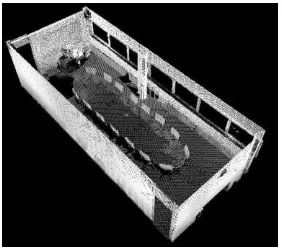
The case study corresponds to a room from an academic building. It is chosen because it presents two doors, seven windows and a big table in the middle of the room, among other pieces of furniture (Figure 5).
The survey of the case study was carried out with a Terrestrial Laser Scanner FARO Focus3D X 330 (Faro, 2013). Data was acquired from three different scan positions in order to completely depict the actual state of the building scene.
Local point clouds are registered into the same coordinate system by manually selecting at least four control points.
Afterwards, a coarse registration is carried out by minimizing the sum of squared distances among all point pairs, and followed by a fine registration performed based on the ICP method (Besl and McKay, 1992). Finally, the point cloud is submitted to a filtering process using a 0.03m octree (for X, Y and Z direction) to ensure uniform density. Registration and filtering is carried out in Riscan Pro software.
Figure 5: Perspective view of the point cloud coloured by intensity. Ceiling is toggled in order to enable visualization of
indoor scene.
3.2 Point cloud segmentation and building reconstruction.
As explained in Section 2.1., segmentation is the first step of the methodology. Point normal is calculated using Principal Component Analysis (PCA) considering a neighbourhood of 50 closest points. Segmentation is carried out by using an angle threshold of 60 degrees and a distance point-to-plane of 0.2 m, in order to include window and door components such as frames in wall regions.
With regard to labelling, regions with a size inferior to 50 points are directly classified as obstacles. The remaining regions are classified into ceiling, floor, walls and obstacles according to their tilt and their position with regard to the centre of the scene. Those regions not labelled as building envelope classes are included in the obstacle class. Figure 6 represents regions classified as walls (a) and regions classified as obstacles (b). As can be observed, in Figure 6.a. the heater equipment is included in the wall region represented in blue and in Figure 6.b. column is included as an obstacle.
Figure 6: Regions classified as walls (a) and regions classified as obstacles (b).
Wall regions are used to create raster images with a resolution of 0.03m. Initial parameters to detect windows and doors are required. The minimum and maximum width and height are 100 cm, 130 cm, 80 cm, 100 cm for windows and 70 cm, 90 cm, 180 cm, 240 cm for doors, respectively. After performing the The International Archives of the Photogrammetry, Remote Sensing and Spatial Information Sciences, Volume XLI-B4, 2016
algorithm, no false positives and no false negatives are detected for this case study.
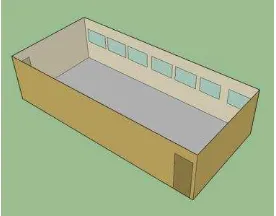
Finally, 2D geometry of openings are reprojected to 3D and information is structured in semantic 3D building models according to gbXML schema specifications (Figure 7).
Figure 7: gbXML model is visualized in Sketchup software where ceiling has been deleted for better indoor visualization.
3.3 Indoor-path finding in real scenarios
Indoor navigation has been tested in this case study for non-disabled people. Therefore, the rectangular buffer representing a person has a size of 0.5 m x 0.5m x 2m (width, depth and height respectively). The methodology could be tested for wheelchair people by just changing buffer dimensions. In order to analyse the whole path, buffer displacement is equal to buffer depth, so, in this case, obstacle analysis is carried out each 0.5m along trajectory.
As point cloud used to test the methodology has been filtered in with an octree of 0.03m in X, Y and Z direction, this value is taken as the global point cloud density. In this regard, minimum threshold size is taken as 11 points and minimum threshold aggregation is taken as 0.036m. This means that an obstacle candidate is considered as a true positive if it has a point size higher than 11 points and the mean of the Euclidean distance of each point to the closest one is lower than 0.036m, which corresponds to the density with a 20% margin (a safety coefficient). Figure 8 shows two obstacle candidates: one classified as non-obstacle (a) and another one classified as obstacle (b).
Figure 8: Image of two obstacle candidates of route B: a non-obstacle (a) and non-obstacle (b).
Four different routes have been considered for testing this methodology (Table 1). Origin nodes (O) are manually determined and destination node (D) is automatically calculated from gbXML model.
Origin node
(O)
x [m] y [m] z [m] Destination node (D)
Node A -2.236 -2.405 31.440
Closest door Node B -2.406 -8.208 31.440
Node C -2.176 0.536 31.440
Node D 0.913 -4.601 31.440
Table 1. Position of origin and destination of each route.
The solution of Route A is obtained after 10 iterations. As can be observed in Figure 9, the final path goes around the big table placed in the middle of the indoor space.
Figure 9: Attempts (grey) and result (black) of shortest path analysis for Route A.
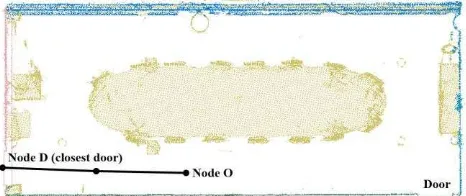
The solution of Route B is obtained after 6 iterations. Figure 10 represents the solution which avoids obstacles represented by the segmented obstacle class visualized in beige colour.
Figures 10: Attempts (grey) and result (black) of shortest path analysis for Route B.
Figure 11 and Figure 12 represent the shortest path for Route C and D. In these cases, the shortest path is directly calculated due to the absence of obstacles.
Figure 11: The shortest path for Route C is represented in black. The International Archives of the Photogrammetry, Remote Sensing and Spatial Information Sciences, Volume XLI-B4, 2016
Figure 12: The shortest path for Route C is represented in black.
4. CONCLUSIONS
This paper presents a methodology for real indoor-path planning. Point clouds are used not only for parameterizing and reconstructing indoor models but also for obstacle detection and route correction.
From the results, the following main conclusions can be drawn:
The proposed methodology is promising for indoor-path planning under the presence of obstacles.
The methodology do not enable the classification of fixed or mobile obstacles, neither the object identification. Results depend on the quality of the input data. The presence of occlusions from an incomplete survey can generate false negatives.
Future work aims to enrich 3D models with semantic information and extend the methodology to different non-disable people profiles such as wheelchair or blind people. Methodology can be also extended to urban scenes.
ACKNOWLEDGEMENTS
Authors would like to thank to the Ministerio de Economía y Competitividad (Gobierno de España), for the financial support given through human resources grant (FPU AP2010-2969, ENE2013-48015-C3-1-R). Research of the second and fifth author is supported by a National Priority Research Program NPRP award (NPRP-06-1208-2-492) from the Qatar National Research Fund (a member of The Qatar Foundation). The statements made herein are solely the responsibility of the authors.
REFERENCES
Besl, P., McKay, N. A, 1992, A method for registration of 3-d shapes. IEEE Transactions on Pattern Analysis and Machine Intelligence, 14, pp. 239–256.
Boguslawski, P., Mahdjoubi, L., Zverovich, V., Fadli, F., in press. Automated Construction of Variable Density Navigable Networks in a 3D Indoor Environment for Emergency Response. Automation in Construction.
Boguslawski, P., Mahdjoubi, L., Zverovich, V., Fadli, F. and Hichem, B., 2015. BIM-GIS Modelling In Support Of Emergency Response Applications. In: L. Mahdjoubi, C.A. Brebbia and R. Laing (Editors), Building Information Modelling (BIM) in Design, Construction and Operations,
Bristol, United Kingdom, 9-11 September 2015. WIT Press, pp. 381-392.
De Berg, M., Van Kreveld, M., Overmars, M., Schwarzkopf, O. C., 2000. Chapter 15: Visibility Graphs. Computational geometry (2nd ed.). Springer Berlin Heidelberg.
Díaz-Vilariño, L., Conde, B., Lagüela, S., Lorenzo, H., 2015. Automatic Detection and Segmentation of Columns in As-Built Buildings from Point Clouds. Remote Sensing, 7, pp.15651-15667 (a)
Díaz-Vilariño, L., Khoshelham, K., Martínez-Sánchez, J., Arias, P, 2015. 3D modelling of building indoor spaces and closes doors from imagery and point clouds. Sensors 15, pp. 3491-3512 (b)
Díaz-Vilariño, L., Martínez-Sánchez, J., Lagüela, S., Armesto, J., Khoshelham, K. 2014. Door recognition in cluttered building interiors using imagery and LiDAR data. International Archives of the Photogrammetry, Remote Sensing and Spatial Information Sciences, 40 (5), pp. 203-209.
EPA, 2009. Buildings and their Impact on the Environment: A
Statistical Summary. Available online at
http://www.epa.gov/greenbuilding/pubs/gbstats.pdf (last access 01/04/2016).
FARO Laser Scanner Focus 3D X 330 Tech Sheet, 2013. Available at: <http:// http://www.faro.com/> (last access 01/04/2016).
Goetz, M., Zipf, A., 2011. Formal definition of a user adaptive and length-optimal routing graph for complex indoor environments. Geo-Spatial Information Science, 14(2), pp. 119-128.
Haala, M., Kada, M., 2010. An update on automatic 3D building reconstruction. ISPRS Journal of Photogrammetry and Remote Sensing, 65, pp. 570–580.
Isikdag, U., Zlatanova, S., Underwood, J.,2013. A BIM-Oriented Model for supporting indoor navigation requirements, Computers, Environment and Urban Systems, 41, pp. 112-123
Liu, L., Zlatanova, S., 2013. Generating navigation models from existing building data. The International Archives of the Photogrammetry, Remote Sensing and Spatial Information Sciences 2013, Volume XL-4/W4, pp. 19-25
Liu, L., Xu, W., Penard, W., Zlatanova, S., 2015. Leveraging spatial model to improve indoor tracking, Liu, L., Zlatanova, S., 2013. Generating navigation models from existing building data. The International Annals of the Photogrammetry, Remote Sensing and Spatial Information Sciences, Volume XL-4/W5, pp. 75-80
Mortari, F., Zlatanova, S., Liu, L., Clementini, E., 2014. Improved geometric network model (IGNM): A novel approach for deriving connectivity graphs for indoor navigation. The International Annals of the Photogrammetry, Remote Sensing and Spatial Information Sciences, Volume II-4, pp. 45-51
Patraucean, V., Armeni, I., Nahangi, M., Yeung, J., Brilakis, I., Haas, C., 2015. State of research in automatic as-built modelling, Advanced Engineering Informatics, 29, 162-171. The International Archives of the Photogrammetry, Remote Sensing and Spatial Information Sciences, Volume XLI-B4, 2016
Rabbani, T., van den Heuvel, F.A., Vosselman, G., 2006. Segmentation of point clouds using smoothness constraint, The International Archives of the Photogrammetry, Remote Sensing and Spatial Information Sciences, 36 (5), pp. 248–253.
Swobodzinski, M., Raubal, M., 2008. An indoor routing algorithm for the blind: development and comparison to a routing algorithm for the sighted. International Journal of Geographical Information Science, 00, pp. 1-28.
UN, 2007. United Nations Convention on the Rights of Persons
with disabilities.
<http://www.un.org/disabilities/convention/conventionfull.shtm l> (last access 01/04/2016).
Volk, R., Stengel, J., Schultmann, F., 2014. Building Information Modeling (BIM) for existing buildings – literature review and future needs, Automation in Construction, 38, pp.84-91
Xiong, Q., Zhu, Q., Zlatanova, S., Du, Z., Zhang, Y., Yang Zeng, 2015. L. Multi-level Indoor Path Planning Method, The International Archives of the Photogrammetry, Remote Sensing and Spatial Information Sciences, XL-4/W5, pp. 19-23
Zlatanova, S., Liu, L., Sithole, G., Zhao, J., Mortari, F., 2014. Space subdivision for indoor applications, GISt Report No. 66, Delft University of Technology, OTB Research Institute for the Built Environment.