ACCELERATION OF TOPOGRAPHIC MAP PRODUCTION
USING SEMI-AUTOMATIC DTM FROM DSM RADAR DATA
Aldino Rizaldy, Ratna Mayasari
Badan Informasi Geospasial (BIG)
Jl. Raya Jakarta-Bogor KM.46, Cibinong 16911, Bogor, Indonesia Email: [email protected], [email protected]
Commission VII, WG VII/2
KEY WORDS: Automatic DTM, Classification, Topographic Map
ABSTRACT:
Badan Informasi Geospasial (BIG) is government institution in Indonesia which is responsible to provide Topographic Map at several map scale. For medium map scale, e.g. 1:25.000 or 1:50.000, DSM from Radar data is very good solution since Radar is able to penetrate cloud that usually covering tropical area in Indonesia. DSM Radar is produced using Radargrammetry and Interferrometry technique. The conventional method of DTM production is using “stereo-mate”, the stereo image created from DSM Radar and ORRI (Ortho Rectified Radar Image), and human operator will digitizing masspoint and breakline manually using digital stereoplotter workstation. This technique is accurate but very costly and time consuming, also needs large resource of human operator. Since DSMs are already generated, it is possible to filter DSM to DTM using several techniques. This paper will study the possibility of DSM to DTM filtering using technique that usually used in point cloud LIDAR filtering. Accuracy of this method will also be calculated using enough numbers of check points. If the accuracy meets the requirement, this method is very potential to accelerate the production of Topographic Map in Indonesia.
1. INTRODUCTION
Badan Informasi Geospasial (BIG) is a government institution in Indonesia, which is responsible for the provision of Topographic Map at various map scales. For implementing that role, BIG produces topographic maps in large scale (1:10.000, 1:5.000, 1:2.500), medium scale (1:100.000, 1:50.000, 1:25.000), then small scale of 1:1.000.000, 1:500.000, and 1:250.000 (Indonesian Government Regulation, 2014). The topographic map is called RBI (Rupabumi Indonesia).
Each of RBI consists of eight parts, namely hydrography, coastal line, hypsography, topographical names (toponyms), administrative boundary line, transportation and utilities, building and public facilities, then land cover (Law, 2011). Hypsography means contour and spot height. Contour is generated from DTM (Digital Terrain Model).
For medium map scale, DSM (Digital Surface Model) from Radar data is a very good solution since Radar is able to penetrate cloud that usually covering tropical areas in Indonesia. DSM Radar is produced using Radargrammetry and Interferometry technique. The conventional method of DTM production is using “stereo-mate”, the stereo image created from DSM Radar and ORRI (Ortho Rectified Radar Image), and human operator will digitize masspoint and breakline manually using the digital stereoplotter workstation. However, this technique is accurate, but very costly and time consuming, also needs large resources of human operators. Since DSMs are already generated, it is possible to filter DSM to DTM using several techniques.
Semi-automatic DTM which is generated from classified DSM radar data proposed to be used as alternative for creating contour in topographic maps production. Semi-automatic DTM will be very useful to reduce time consuming in topographic
map production with accuracy of the result will be same as contour that derived from stereoplotting. In the following discussion, we limit our study to the semi-automatic DTM for 1:50.000 map scale using 12.5m interval contour.
2. TECHNICAL BACKGROUND
Technical background for this study is the common form of the DSM from LIDAR data and RADAR data. In order that, the DSM radar data will be treated as DSM LIDAR data.
2.1 LIDAR Data
LIDAR, which stands for Light Detection and Ranging, is a remote sensing method that uses light in the form of a pulsed laser to measure ranges (variable distances) to the Earth. These light pulses—combined with other data recorded by the airborne system— generate precise, three-dimensional information about the shape of the Earth and its surface characteristics. (NOAA, 2015)
LIDAR commonly used airplanes to carry its instrument which contains component laser, scanner, navigation system and positioning system.
LIDAR point clouds are set of point which have spatial coordinates and correspond to a particular point on the Earth's surface. These contain highly accurate elevation information of the top surface and ground terrain. Point cloud derived from the reflection of LIDAR laser pulse. This point clouds are used to generate other geospatial products, such as digital elevation models and contours.
Many algorithms were investigated to filter point clouds and produce ground points to build DTM. Once ground points were
classified from other points, it is able to generate DTM automatically.
Chang et al (2008) divide classification methods into several groups. First group of classification method is proposed by Vosselman (2000). The algorithm is based on mathematical morphology. The lack of this algorithm when handle objects like large building or dense forest (Chang et al, 2008).
Second group is introduced by Axelsson (2000) based on progressive densification of a Triangular Irregular Network (TIN) in an iterative process. Third group depends on linear prediction and hierarchic robust interpolation, introduced by Kraus and Pfeifer (2001).
Another method for classification is segmentation as developed by Jacobsen and Lohmann (2003). This method uses height differences to classify the segment into ground or non-ground points.
2.2 RADAR Data
RADAR, Radio Detecting and Ranging, is a remote sensing method using radio waves. The radio waves (electromagnetic waves) sent out from the instrument to the earth and reflected by objects back to the receiver in their path.
Figure 1. Basic block diagram of typical radar system (Chan, Y.K., Koo, V.C., 2008.)
Radars in their basic form have four main components: (Bureau of Meteorology, 2015)
a. A transmitter: creates the energy pulse.
b. A transmit/receive switch: tells the antenna when to transmit and when to receive the pulses.
c. An antenna: send these pulses out into the atmosphere and receive the reflected pulse back.
d. A receiver: detects, amplifies and transforms the received signals into video format.
Components said above can be assembled on airborne or spaceborne. The main advantage of RADAR is its ability to acquire data through clouds. SAR, Synthetic Aperture Radar, is one form of radar.
In SAR, forward motion of actual antenna is used to ‘synthesize’ a very long antenna. At each position a pulse is transmitted, the return echoes pass through the receiver and recorded in an ‘echo store’. The Doppler frequency variation for each point on the ground is unique signature. SAR processing involves matching the Doppler frequency variations and demodulating by adjusting the frequency variation in the return echoes from each point on the ground. Result of this matched filter is a high-resolution image. (Chan, Y.K., Koo, V.C., 2008.)
Figure 2. Synthetic aperture (Chan, Y.K., Koo, V.C., 2008.)
Number of frequencies used to operate SAR shown in Table 1.
Band Wave Length (cm)
Frequency (GHz)
X 3 9.6
C 5.3 5.6
L 24 1.3
P 68 0.3
Table 1. Typical wavelength and frequency for SAR bands (Dowman, 2004)
Digital elevation models (DEMs) can be generated by interferometric SAR (InSAR) and radargrammetry techniques from different positions of Synthetic Aperture Radar (SAR) images. (Yu et al, 2010)
Figure 3. Radargrammetry processing (Yu et al, 2010)
Radargrammetry technique derived from photogrammetry and based on the stereoscopic principle. Interferometry technique based on the phase differences between identical imaged points in two SAR images.
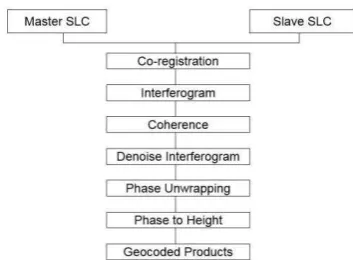
Figure 4. The flowchart of InsSAR DEM generation (Yu et al, 2010)
In BIG, these radar data (ORRI and DSM) are generated to produce a stereo model image. An activity to plot or delineate stereo model image using a stereoscopic device, usually in order to produce a 3D map is called stereoplotting.
2.3 Common Feature Specification in IFSAR and LIDAR
In this study, we processed RADAR data as LIDAR data because we assume that DSM of both data have common feature specification shown as Table 2.
Description RADAR Data LIDAR Data
Form Raster (has x, y, z). Can be converted to point with specific grid
Point Clouds with specific density (has x, y, z)
Sensor Active Active
Platform Spaceborne and airborne
Airborne
Positioning Yes Yes
Represent Earth Surface
Reflected depend on wavelength
Reflected the first surface of contact
Coverage Spaceborne: fix Airborne: depend on flying height
depend on flying height
Table 2. Common feature specification
3. METHOD
This paper will study the possibility of DSM to DTM filtering using techniques that usually used in point cloud LIDAR filtering. Accuracy of this method will also be calculated using check points. If the accuracy meets the requirement, this method is very potential to accelerate the production of Topographic Map in Indonesia.
3.1 Study Area
Study area located in Sumatera Island, 1:50.000 map scale sheet number 0619-61, 0619-62, 0619-63, and 0619-64.
Figure 5. Study Area
This location covers hilly and flat area which expected can be represent the terrain in Indonesian area. This location also has completed data that is needed for this study.
3.2 Data
In this study, we use data as follows:
a.DSM IFSAR year acquisition 2011-2012. These are interferometry data.
Figure 6. DSM IFSAR on study area
b.Topographic maps 1:50.000 scale (2014) generated from ORRI and DSM IFSAR using stereoplotting method. We use the river (hydrography) from this topographic map database to add improvement for the automatic DTM. c.DTM from aerial photo for checking geometric accuracy of
the semi-automatic DTM, especially z value.
3.3 Data Processing Work Flow
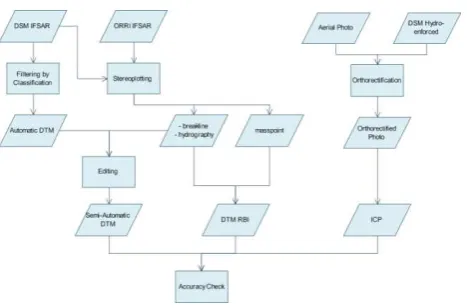
Work flow for this study shown as Figure 7.
Figure 7. Work flow for this study
Detailed work flow for filtering by classification process describes in Figure 8.
Figure 8. Work flow for an utomatic DTM generation
3.4 Filtering Algorithm
This research only uses algorithm for classification from Axelsson (2000) which rely on progressive densification of TIN. Seed points are building a sparse TIN and dense it in an iterative process. This algorithm was implemented in Ground routine in TerraSolid commercial software.
Ground routine starts its algorithm by selecting low points as initial ground points and build TIN from these points. Then the routine adds some points iteratively within particular angle and distance. After some iteration, points which believed as ground were completely classified into a ground class (TerraSolid, 2015).
3.5 Filtering by Classification
There are several parameters which are should notice while perform ground routine from TerraSolid (TerraSolid, 2015). For this filtering, the different character between LIDAR and RADAR should handle carefully. In this case, data density and band penetration are different. The density will affect the terrain angle value parameter. Beside that, LIDAR data has penetration to the ground, while RADAR penetration is reaching the top of canopy since it used x-band.
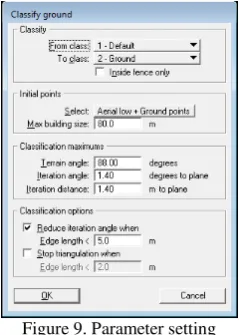
First parameter is the maximum building size to control initial ground point selection. This parameter assumes in a specific area has at least one point as initial ground. In this study area, 80 m x 80 m value was chosen as input parameter according to average of maximum building size in that area.
Second parameter is terrain angle. Terrain angle represents the steepest angle that allowed in TIN. Usually 88 – 90 degree was chosen while there are man-made objects in the area. Since almost area in this study is an urban area, 88 degrees was chosen for terrain angle value.
Third parameter is iteration angle. The smaller iteration angle must be chosen for flat terrain while bigger value must be chosen for mountainous terrain. For LIDAR data, normally 4.0 degrees value is chosen for flat terrain while 10.0 degree is chosen for mountainous terrain. But for RADAR data, from several experiments, 1.40 degrees to plane was chosen for the iteration angle in this study area considering the land cover.
Fourth parameter is iteration distance. Iteration distance is maximum distance from a point to the triangle. From the several values applied in this area, 1.40 meter is the best result appearing considered to the land cover.
Figure 9. Parameter setting
These parameters setting was applied to the study area to classify ground class. Since this classification only for generating DTM which need ground value, other class will not process to be classified.
From this ground class point, then be used for generating the DTM surface by interpolate gap with the existing value using
triangulated irregular network (TIN) method. Because derived from automatic process, so we called automatic DTM.
3.6 Manual Editing
The result of automatic classification then compared to the original DSM. We can see that several buildings and vegetation points still misclassified as ground points. This error caused by very dense vegetation or building with similar height, then the routine assumes that area as ground. This error has high relation with maximum building size parameters. Some values of building size are calculated to approach the most sizes representing the study area.
If the minor error classification remains after some parameter modification, it must be corrected manually. The error ground points should be reclassified by select manually, then assigned as non-ground.
Other manual editing approach is adding breakline morphology. Automatic DTM give unrealistic results, especially for hydrography feature. Manually 3D feature digitizing should be done to improve the morphology, not only for hydrography but also for hypsography such as mountain ridge. Line data and ground class point data are generated to be DTM surface. Since it generated from the automatic classification process and continued by manual editing, then we called this result as semi-automatic DTM.
4. RESULT
The result from semi-automatic DTM will compare with DTM from manual stereoplotting. At least there are 3 comparable aspects: geometric accuracy, time processing and production cost. Specifically for geometric accuracy, it will be checked using check points from DTM produced by Aerial Imagery as a true value.
4.1 DTM from Stereoplotting
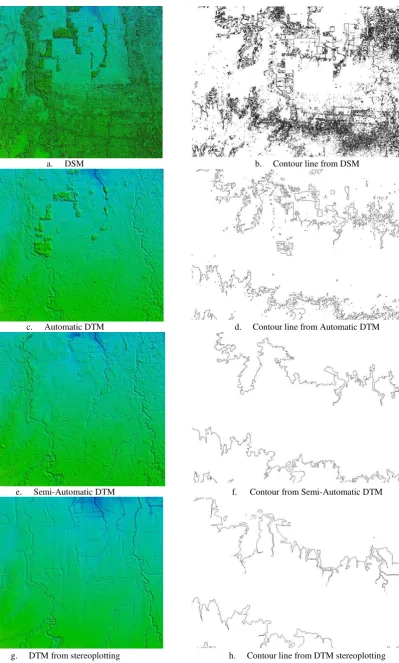
These DTM is derived from DSM IFSAR using stereoplotting method. Characteristic of DTM Stereoplotting is very smooth due to many manual editing from human operators. Morphological feature also appears very clearly like river or mountain ridge. See Figure 10.g.
4.2 Automatic DTM
Automatic DTM is the result of processing DSM IFSAR using classification method. After classification, ground class selected to be generated elevation grid and interpolate the gap.
Automatic DTM is not very good visually. Many buildings or vegetation points still misclassified as ground points. Morphological feature also not appear clearly. As an example, river is not correctly identified. See Figure 10.c
4.3 Semi-Automatic DTM
Semi-automatic DTM is automatic DTM that edited by manually reclassified the particular point which can be identified get in not an appropriate class (misclassified). This gives better result than automatic DTM. Misclassified points were manually corrected by selecting the point and assign them to the correct class. Breakline also include into processing to improve morphology feature in elevation grid generation. The gap filled by interpolation. See Figure 10.e.
a. DSM b. Contour line from DSM
c. Automatic DTM d. Contour line from Automatic DTM
e. Semi-Automatic DTM f. Contour from Semi-Automatic DTM
g. DTM from stereoplotting h. Contour line from DTM stereoplotting
Figure 10. DTM and Contour line Results
4.4 Contour Line
Contour line that directly generated from Semi-Automatic DTM is not well satisfied. Some of “small islands” contour line are also generated which need to eliminate (Figure 11). The difference between contour line generated from Manual Stereoplotting DTM and Semi-Automatic DTM showed in the picture below.
Figure 11. Contour line directly generated from Semi-Automatic DTM (red line) compared to contour line from Manual Stereoplotting DTM (blue line)
We can see that the main line showing the close position to each other. The raw generation contour line, then to be edited by selecting and simplification to eliminate unnecessary line based on contour characteristic (Figure 12). Contour line interval 12.5m derived from each DTM can be seen in Figure 10.
Figure 12. Edited contour line from DTM Semi-Automatic
4.5 Geometric Accuracy
Geometric accuracy for this area is tested by using independent check points (ICPs). The coordinate of ICP generated from aerial photo (orthorectified photo and DTM from aerial photo). DTM from aerial photo has vertical accuracy better than 1 meter.
Coverage of this study area is about 1843.095 km2. According to Specification of Geometric Accuracy Procedure for Large Scale Mapping (BIG, 2014), this study area needs at least 80 check points. For this study, 112 check points from Aerial Image DTM were used. The result of accuracy assessment showed in the Table 3.
Method IFSAR DSM Stereoplotting DTM from Automatic DTM
Semi-Automatic
DTM
RMSE (m) 4.074 0.418 1.650 1.586
LE90 Vertical
Accuracy (m) 6.721 0.689 2.722 2.617
Method IFSAR DSM Stereoplotting DTM from Automatic DTM
Semi-Automatic
DTM Maximum
difference (m) 0.422 1.497 3.877 3.622 Minimum
difference (m) -13.291 - 1.854 - 6.144 - 6.197 Table 3. Vertical accuracy
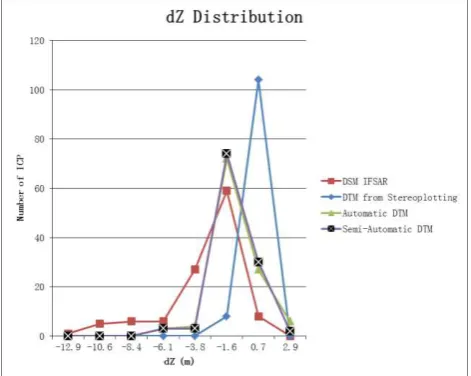
To meet the accuracy specification of 1:50.000, data should have vertical accuracy better than 10 meters. This method proved that the vertical accuracy requirement is fulfilled. The distributions of Z-residual for ICPs are shown in the Figure 13.
Figure 13. dZ distribution
4.6 Statistic Test
Statistic test calculation also needed to compare the relation between dataset is significant or not. The statistic calculation was conducted using t-test as shown below.
(1)
where t= t-value
x1, x2 = value of data set 1 and 2
At 90% significance level and two-tailed hypothesis, assumed H0 = there is a significant relation between two datasets, the t-value is 1.6517, the results of statistic tests are shown in the Table 4.
Method t-score Result
DTM Aerial Image to DTM Stereoplotting
0.0162 Significant
DTM Aerial Image to DTM Semi-Automatic
-0.4525 Significant
DTM Stereoplotting to DTM Semi-Automatic
-0.4694 Significant
DSM IFSAR to DTM Aerial Image
-1.4185 Significant
DSM IFSAR to DTM Stereoplotting
1.4364 Significant
Table 4. Result of statistic test
From the Table 4, it can be concluded that each DTM has a significant relation to others. However, DSM IFSAR has almost exceeded the significant level limit.
4.7 Processing Time
Since it was not necessary to manually collect masspoints to build DTM, time required for processing is decreased significantly. The only manual work is to collect breakline. However, collecting breakline is much faster than masspoint. Comparison of time in the processing of semi-automatic DTM from classification by filtering and DTM using stereoplotting method shown as Table 5. This table based on the same coverage area.
Method Person Time
(day, 7 works hours) DTM from Stereoplotting 4 30
Automatic DTM 1 1
Semi-Automatic DTM 4 7
Table 5. Time needed for processing data
From Table 5, we can see that the processing time for generating semi-automatic DTM is one-fourth of processing time for generating DTM for stereoplotting.
4.8 Production Cost
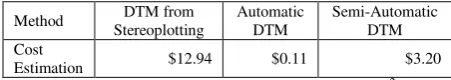
Almost similar to the time processing comparison, production cost is significantly decreased using Semi-Automatic method. Cost estimation to produce semi-automatic DTM or DTM by stereoplotting is compared in Table 6.
Method DTM from
Table 6. Cost estimation in production per km2
From Table 6, we can see that the production cost for generating semi-automatic DTM is one-fourth of production cost for generating DTM for stereoplotting.
5. DISCUSSION
This research only studied for area from IFSAR interferometry data in semi urban area. The result is sufficient for 1:50.000 topography map production. Further research needs to be done, especially for mountainous terrain with very dense vegetation. In such area, this is common characteristic of rainforest in Indonesia, x-band Radar data only containing top canopy vegetation. In the other words, Radar data only consisting surface (non-ground) points.
Since the algorithm that used in this research actually designed for LIDAR data which consisting of ground and non-ground points, it may be difficult to filter DTM from DSM for such area. Others method should be discussed to obtain the best algorithm for Semi-Automatic DTM in dense rain forest area.
Need further study for:
a. Effective area to generated semi-automatic DTM b. Factors may affect accuracy of semi-automatic DTM c. Location that fully vegetated area. Considered the
wavelength and frequency of radar data.
6. CONCLUSSION
Semi-automatic DTM derived from radar data can be used to accelerate contour line generation for topographic map production. The DTM and contour line results meet the specification for the RBI map scale 1:50.000.
The advantages of using this semi-automatic DTM:
a. Meet specification for RBI 1:50.000 map scale. This is
c. Appropriate for large data processing d. Less human resources needed.
ACKNOWLEDGEMENTS
Bureau of Meteorology, Australian Government, 2015. How
Radar Works.
http://www.bom.gov.au/australia/radar/about/what_is_radar.sht ml.
Chan, Y.K., Koo, V.C., 2008. An Introduction to Synthetic Aperture Radar (SAR). Progress In Electromagnetics ResearchB, Vol.2, pp 27–60.
Chang, Y.C., Habib, A.Y., Lee, D.C., Yom, J.H., 2008. Automatic Classification of LIDAR Data Into Ground and Non-Ground Points. In: The International Archives of the Photogrammetry, Remote Sensing and Spatial Information Sciences, Beijing, Vol. XXXVII. Part B4.
Dowman, I., 2004. Integration of LIDAR and IFSAR for Mapping. In: The International Archives of the Photogrammetry, Remote Sensing and Spatial Information Sciences, Istanbul, Turkey, Vol. XXXV Part B2.
Jacobsen, K. and Lohmann, P.2003. Segmented filtering of laser scanner DSMs. In: The International Archives of Photogrammetry and Remote Sensing, 34 (3/W13).
Kraus, K. and Pfeifer, N. 2001. Advanced DTM generation from LiDAR data. In: The International Archives of Photogrammetry and Remote Sensing, 34(3/W4), pp. 23–30.
Law, The Indonesian Republic, No. 4 of 2011 on Geospatial Information.
Mercer, B., 2001. Comparing LIDAR and IFSAR: What can you expect? In: Photogrammetric Week 01, Wichmann Verlag, Heidelberg.
NOAA, 2015. What is LIDAR?
http://oceanservice.noaa.gov/facts/lidar.html
Indonesian Government Regulation No. 9 of 2014 on Implementation of Law No.4 of 2011 on Geospatial Information.
TerraSolid. 2015. TerraScan User’s Guide.
Vosselman, G. 2000. Slope based filtering of laser altimetry data. In: The International Archives of Photogrammetry and Remote Sensing, 33(B3), pp. 935–942.
Yu, J. H., Li, X., Ge, L., Chang, H.C., 2010. Radargrammetry and Interferometry SAR for DEM Generation. http://citeseerx.ist.psu.edu/viewdoc/summary?doi=10.1.1.229.3 117.