EEG Power Abnormalities in Schizophrenia
Scott R. Sponheim, Brett A. Clementz, William G. Iacono, and Morton Beiser
Background: This study investigated the clinical and
biological concomitants of electroencephalogram power
abnormalities in schizophrenia.
Methods: We examined the power characteristics of
resting electroencephalograms in 112 schizophrenic
pa-tients. Also collected were measures of psychotic
symp-tomatology, brain morphology, ocular motor functioning,
electrodermal activity, and nailfold plexus visibility.
Sev-enty-eight nonschizophrenic psychosis patients (e.g., mood
disorder patients with psychosis) and 107 nonpsychiatric
control subjects were included for comparison.
Results: Schizophrenic patients whose
electroencephalo-grams were characterized by augmented low-frequency
power and diminished alpha-band power had more
neg-ative symptoms, larger third ventricles, larger frontal
horns of the lateral ventricles, increased cortical sulci
widths, and greater ocular motor dysfunction compared
with schizophrenic patients without these
electroencepha-logram characteristics. In nonschizophrenic psychosis
patients, augmented low-frequency and diminished
alpha-band powers failed to be associated with any clinical or
biological indices.
Conclusions: Results suggest that clinical and biological
concomitants of low-frequency and alpha-band power
abnormalities in schizophrenia are unique, perhaps
indi-cating the presence of thalamic and frontal lobe
dysfunc-tion. Biol Psychiatry 2000;48:1088 –1097 © 2000
Soci-ety of Biological Psychiatry
Key Words: Schizophrenia, electroencephalogram,
psy-chosis, symptomatology, brain morphology, ocular motor
function
Introduction
S
ince the 1970s, investigators have reliably shown
electroencephalograms (EEGs) of schizophrenic
pa-tients to contain augmented low-frequency power and
diminished alpha-band power (e.g., Iacono 1982; Itil et al
1972, 1974; Miyauchi et al 1990; Sponheim et al 1994).
Nonetheless, the significance of EEG power abnormalities
to schizophrenia is unclear. Electroencephalogram
anom-alies are not a medication phenomenon. Researchers have
found EEG anomalies in medication-free (Merrin and
Floyd 1996; Miyauchi et al 1996) and neuroleptic naive
(Nagase et al 1996; Omori et al 1995) schizophrenic
patients. Electroencephalogram power abnormalities of
schizophrenic patients are relatively independent of
cur-rent (Fenton et al 1980) and past medication status (Gattaz
et al 1992), as well as type (Sponheim et al 1994) and
dosage (Kahn et al 1993; Omori et al 1992) of medication.
Also, augmented low-frequency power and diminished
alpha-band power appear to be unrelated to chronicity in
schizophrenia (Sponheim et al 1994). Although evidence
indicates EEG power abnormalities are not due to
treat-ment or the duration of schizophrenia, low-frequency and
alpha-band power abnormalities are not specific to the
disorder (for a review, see Williamson and Kaye 1989).
For instance, patients with bipolar disorder exhibit similar
EEG anomalies (Clementz et al 1994). To determine the
significance of EEG power abnormalities to
schizophre-nia, this study examined clinical and biological
character-istics of schizophrenic patients who exhibit augmented
low-frequency power and diminished alpha-band power.
We also studied clinical and biological features of
non-schizophrenic psychosis patients to determine whether the
significance of EEG power anomalies is similar for a
variety of psychotic patients.
Several studies have demonstrated that schizophrenic
patients with augmented low-frequency EEG power show
more negative symptomatology (Fenton et al 1980; Gattaz
et al 1992; Omori et al 1992). The association between
low-frequency power and negative symptoms has been
found in middle-aged (Fenton et al 1980) and elderly
schizophrenic patients (Omori et al 1992), as well as
subjects on medications (Omori et al 1992) and off
(Fenton et al 1980). Alpha power has been found to be
inversely related to negative symptoms (motor retardation,
blunted affect, and emotional withdrawal; Merrin and
Floyd 1992, 1996), whereas beta power has generally
failed to be associated with negative symptoms (Merrin
From the Departments of Psychology (SRS, WGI) and Psychiatry (SRS),Univer-sity of Minnesota, and VA Medical Center (SRS), Minneapolis; the Department of Psychology, University of California, San Diego (BAC); and The Clarke Institute, Toronto, Canada (MB).
Address reprint requests to Scott R. Sponheim, Ph.D., VA Medical Center (116B), One Veterans Drive, Minneapolis MN 55417.
Received December 8, 1999; revised April 10, 2000; accepted April 24, 2000.
© 2000 Society of Biological Psychiatry 0006-3223/00/$20.00
and Floyd 1991, 1996; Omori et al 1992). There is little
evidence that EEG power abnormalities are related to
thought disorganization, delusions, or hallucinations in
schizophrenia.
Although some studies suggest that schizophrenic
pa-tients with EEG power abnormalities have additional
biological anomalies, evidence is too scant to provide an
understanding of the biological significance of power
abnormalities. Studies have shown delta power to be
associated with the area of the third cerebral ventricle
(Takeuchi et al 1994), glucose metabolism in frontal brain
regions (Alper et al 1998; Guich et al 1989), and
abnor-malities in visual- and auditory-evoked potentials
(Mori-hisa et al 1983) in individuals with schizophrenia.
Dimin-ished alpha power in schizophrenia has been associated
with evoked potential abnormalities (Morihisa et al 1983),
subcortical metabolism (Alper et al 1998), and high levels
of noradrenaline in cerebral spinal fluid (Kemali et al
1990). Changes in alpha peak frequency have been tied to
enlargement of the lateral cerebral ventricles (Karson et al
1988). One study identified remitted schizophrenic
pa-tients who were electrodermal responders to have lower
alpha frequencies and more beta activity than
electroder-mal nonresponders (Iacono 1982).
To investigate the clinical and biological features of
schizophrenic patients with EEG power abnormalities, we
examined the resting EEGs of a large sample of
schizo-phrenic patients. Psychotic symptoms were studied as
possible clinical concomitants of EEG power
abnormali-ties, and brain morphology, ocular motor functioning,
electrodermal activity, and nailfold plexus visibility were
examined as possible biological concomitants. Previous
work has shown schizophrenic subjects to be abnormal on
these selected biological variables (Clementz et al 1992;
Iacono 1985; Iacono et al 1992, 1999; Sponheim et al
1994). Nonschizophrenic psychosis (e.g., bipolar disorder
with psychotic features) and nonpsychiatric control
sub-jects were studied for comparison. If associations between
EEG power abnormalities and clinical or biological
char-acteristics are unique to schizophrenia, it would suggest
that abnormal brain electrical activity reflects aspects of
neuropathology in schizophrenia not shared with other
mental disorders.
Methods and Materials
Subjects
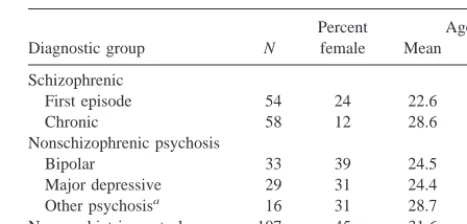
The subject sample consisted of 112 schizophrenic patients (54 first episode and 58 chronic), 78 nonschizophrenic first-episode psychosis patients (33 bipolar, 29 major depressive, and 16 other psychosis), and 107 nonpsychiatric control subjects. Table 1 summarizes the characteristics of the subjects. All subjects gave written informed consent to be in the study. Patients received a
semistructured interview (the Present State Examination [PSE], 9th edition; Wing et al 1974) by a trained psychiatrist or clinical psychologist. Because all subjects were recruited 1980 –1986, diagnoses were originally assigned according to DSM-III criteria (American Psychiatric Association 1980), after a consensus diagnosis was reached by two or more clinicians who had reviewed a patient’s data across all time points (first-episode patients) and from all sources including hospital records (first-episode and chronic patients). For this report, DSM-IV (Ameri-can Psychiatric Association 1994) consensus diagnoses were made by reviewing all interview, symptom checklist, course, and functioning data from which original diagnoses were made.
Patients were excluded if they had a history of substance dependence or head trauma or showed evidence of a neurologic disorder (including tardive dyskinesia) or mental retardation (IQ,60). Written consent was obtained from each subject after the procedures of the study were explained. (For additional information concerning the diagnostic approach, see Iacono and Beiser 1989.)
First-episode schizophrenic and first-episode nonschizo-phrenic psychosis patients were referred through a community-wide network consisting of all psychiatric hospitals and commu-nity mental health centers in Vancouver, Canada, and referrals from private practice psychiatrists and general practice physi-cians who agreed to assist in the study. An attempt was made to recruit all persons, between the ages of 16 and 54, who experienced their first episode of psychosis during a 2.5-year period. To be included in the study, subjects had to be experi-encing their first episode of disorder and have hallucinations, delusions, or grossly disorganized behavior (i.e., be psychotic; for a full listing of criteria, see Iacono and Beiser 1989). Of 318 potential subjects, 94 refused to participate, 31 could not be located in time to recruit them, 18 were not psychotic, 15 withdrew from the study before their EEGs could be recorded, and 28 patients were excluded due to data collection problems or unavailability of artifact-free EEGs. At the time of EEG testing, first-episode schizophrenic and nonschizophrenic psychosis pa-tients were clinically stable and almost all had been recently hospitalized. Eighty-three percent of first-episode schizophrenic patients and 85% of first-episode nonschizophrenic psychosis patients were on medications.
Chronic schizophrenic patients were recruited from an extended-care mental institution and affiliated board-and-extended-care homes in the Vancouver area. If after reviewing interview and hospital infor-Table 1. Characteristics of Subjects
Diagnostic group N
Percent female
Age
Mean SD
Schizophrenic
First episode 54 24 22.6 5.01
Chronic 58 12 28.6 4.36
Nonschizophrenic psychosis
Bipolar 33 39 24.5 6.47
Major depressive 29 31 24.4 5.24
Other psychosisa 16 31 28.7 12.22
Nonpsychiatric control 107 45 31.6 14.31
mation clinicians concluded at a case conference that patients met DSM criteria for chronic schizophrenia, they were included in the study. Of 65 chronic schizophrenic subjects, the EEGs of seven patients were excluded due to recording errors or a lack of artifact-free data. Of the remaining 58 patients, 29 were residing on a male inpatient ward and 29 were recruited from board-and-care homes. Chronic schizophrenic patients were characterized by an early age of onset (mean 5 18.7 years, SD 5 3.39), extended histories of schizophrenia (mean 59.9 years, SD5
4.23), and many months of hospitalization (mean523, SD5
26.90). Ninety-eight percent of the chronic schizophrenic pa-tients were on medications.
Nonpsychiatric control subjects were volunteers recruited from family practice clinics in low income neighborhoods, employment centers, community centers, and vocational col-leges. Nonpsychiatric subjects were excluded if they reported a history of mental health treatment in either themselves or their first-degree relatives. Nonpsychiatric subjects were free of drug or alcohol dependence and any chronic physical illnesses.
EEG Apparatus and Procedure
Subjects were seated in a darkened room and presented binau-rally with 55-dB (sound pressure level) white noise over head-phones. Subjects were instructed to close their eyes, sit still, and relax for several minutes while their “brain waves” were re-corded. Gold electrodes referenced to linked ears were used to record EEGs from three central scalp locations (Cz, C3, and C4), and Ag–AgCl electrodes above and below the right eye regis-tered ocular movements. All electrode connections had imped-ances below 5 kV.
The EEG was recorded with a 35-Hz, half-amplitude, low-pass filter and a 1-sec time constant and stored on reel-to-reel tape with a Vetter (Vetron Technology, Rebersburg, PA) Model A recorder. To ensure that the power of the frequency spectrum could be accurately determined, a calibration pulse was recorded with the EEG. The EEG data were digitized through 0.1-Hz high-pass and 40-Hz low-pass filters (24 dB/octave) at a rate of 256 Hz. The digitized EEG for each subject was divided into 21 8-sec segments. A digital high-pass autoregressive filter (filter parameter 5 .975; Coppola 1979) was applied to reduce low-frequency artifacts.
EEG Analysis
Procedures were implemented to reduce the contributions of bioelectric artifacts to the data. Although subjects were advised to keep their eyes closed and not talk during the EEG recordings, these instructions were not necessarily followed. From an audio track of the session recorded with the EEG, times when subjects spoke were identified and these EEG segments were eliminated from analyses. By inspecting digitized electro-oculogram (EOG) records, occasions were identified when some subjects, counter to instructions, opened their eyes (as indicated by the presence of blinks) during EEG recording. Electroencephalogram segments were rejected if they contained blink events greater than 100mV in amplitude and were from 285 to 340 msec in duration. When subjects kept their eyes closed, rolling eye movements
occasion-ally contaminated the EEG. To remove these eye movements, the EOG signal was mathematically subtracted from the EEG ac-cording to the method of Gratton et al (1983). Lastly, EEG segments were visually inspected, and those identified as con-taining high-frequency artifacts were excluded from analyses. All subjects with less than 32 sec of artifact-free data were excluded from analyses. In prior research, we have found that reliable EEG power values can be obtained from nonpsychiatric control subjects and schizophrenic subjects using 32-sec epochs (Lund et al 1995; Sponheim 1993). These previous analyses revealed internal consistencies (a; Cronbach 1951) above .83 for all frequency bands except delta, which had an internal consis-tency of .61 for schizophrenic patients and .77 for nonpsychiatric control subjects.
For each subject’s data, fast-Fourier transforms were com-puted on every artifact-free segment using a Hanning window with 100% taper length, and frequency spectra were averaged across segments within each scalp location. Square roots of EEG power values were computed; divided into delta (1–3 Hz), theta (3.125– 8 Hz), alpha (8.125–13 Hz), beta 1 (13.125–20 Hz), beta 2 (20.125–25 Hz), and beta 3 (25.125–30 Hz) power bands; and divided by the total spectrum area.
Assessment of Symptomatology
Psychosis (delusion and hallucinations), Disorganization (formal thought disorder), and Negative Symptom scores were rationally derived using items from the PSE intake interview and the guidlines of Andreasen (1981, 1983) and Andreasen et al. (1995). The Psychosis score was the total number of symptoms endorsed out of eight hallucinations and 27 delusions. The Disorganization score referred to the number on a five-point scale that was derived from ratings of neologisms and idiosyncratic use of language (PSE no. 135), incoherence of speech (PSE no. 136), and pressure of speech (PSE no. 131). A score of 0 meant all symptoms were rated as not present, a score of 2 meant that more than one symptom was rated as present in a fairly severe degree, and a score of 4 meant more than one symptom was rated as being present in a very severe degree. The Negative Symptom score referred to the number on a five-point scale that was derived from two affective flattening symptoms (PSE nos. 128 and 129), four alogia symptoms (PSE nos. 130, 133, 134, and 138), two avolition/apathy symptoms (PSE nos. 108 and 110), two anhedonia/asociality symptoms (PSE nos. 21 and 28), and two attentional impairment symptoms (PSE nos. 102 and 114). A score of 0 meant all symptoms were rated as not present, a score of 2 meant that more than one symptom was rated as present in a fairly severe degree, and a score of 4 meant that more than two symptoms were rated as being present in a very severe degree.
Brain Morphology Assessment
ventricle-to-brain ratio (i.e., lateral ventricle area divided by the total brain area and multiplied by 100). The size of the frontal horns of the lateral ventricles was measured by computing the frontal horn– to– brain ratio (i.e., frontal horn area divided by total brain area and multiplied by 100). A traveling microscope was used to measure third ventricle width at the widest point where contin-uous ventricle walls could be discerned, and cortical atrophy ratings were made on a three-point scale anchored at each level by exemplars (1, no visible sulci; 2, visible but not extensive sulci; 3, sulci clearly visible and extensive). For each index the scan that maximally revealed the ventricle area of interest was selected for measurement, with the exception being cortical atrophy ratings, which were made from the scan three above the scan that maximally revealed the lateral ventricles.
Assessment of Ocular Motor Functioning
Ocular motor functioning was assessed by having subjects track a moving dot with their eyes while their head was immobilized (Iacono et al 1992). The dot was driven by a sine wave generator, horizontally traversing 20° of visual arc, at a frequency of .4 Hz for 20 cycles. Ag–AgCl electrodes attached to the outer canthi of both eyes with an earlobe ground were used to record ocular motion. Both eye-tracking and target signals were digitized and corrected for phase differences. The root-mean-square difference between the signals was calculated for the best 16 consecutive cycles of eye tracking. The median root-mean-square error of the 16 cycles was used as the dependent measure. The log10of the root-mean-square error values was computed to correct for positive skew in their distribution.
Electrodermal Activity Assessment
The electrodermal activity of subjects was assessed during the presentation of two sound effects and two series of 0.5-sec, 1000-Hz tones with 40-msec rise and fall times (for details, see Iacono et al 1999). One tone series consisted of eight tones at 85 dB, and the other series contained 12 tones at 105 dB. Scores were calculated for each subject on a single factor identified through a principal components analysis (varimax rotation) of number of skin conductance responses, log-transformed skin conductance response amplitude to the first stimulus, log-trans-formed mean skin conductance level calculated as the average of the individual levels measured at the onset of each stimulus, log-transformed frequency of nonspecific fluctuations during the tone series, and a categoric index of response status (responder, responded to at least one tone; nonresponder, responded to none of the tones). To achieve an overall index of electrodermal activation deviance, the absolute value of factor scores minus the nonpsychiatric control group mean was computed (Ficken 1991). The use of such a score is consistent with findings indicating that psychotic patients tend to be either electrodermally hypo- or hyperresponsive in habituation studies. For instance, Iacono et al (1999) have noted that elevated rates of electrodermal nonre-sponding have been consistently observed in schizophrenia and mood disorder, and psychotic patients who are electrodermal responders appear to be hyperaroused. This hyperarousal is evidenced by elevated skin conductance levels, high rates of skin
conductance responding, and frequent nonspecific electrodermal fluctuations.
Nailfold Plexus Visibility Assessment
Maricq’s Scale for Plexus Visualization was used to quantify the visibility of the capillary plexus at the base of the nailfolds (for a detailed overview of this assessment, see Clementz et al 1992). Plexus visibility refers to the degree to which the capillaries at the base of the nailfold can be visualized on each finger with the aid of a low-power stereo microscope. Visualization scores were assigned without knowledge of diagnosis and according to a nine-point scale anchored by reference photographs; 0 repre-sented no visible plexus, 4 was extensive plexus visibility, and halfpoints were given for intermediate visibilities. The log10of ratings summed across all fingers was used to compute the plexus visibility score. The intraclass test–retest reliability of nailfold plexus visibility ratings on a subset of these subjects was greater than .95 over an interval of 9 months (Clementz et al 1992).
Results
Because previous analyses (Sponheim et al 1994) failed to
produce a recording site effect (Cz–C3–C4) for group
differences in EEG power values, analyses were limited to
data collected from site Cz. Electroencephalogram power
bands were corrected for age using linear coefficients
derived from nonpsychiatric control group data. Factor
analyses of EEG power bands were carried out to identify
common sources of variance in the dependent variables.
Analyses of schizophrenic, nonschizophrenic psychosis,
and nonpsychiatric groups identified two factors with
eigenvalues exceeding 1. The two factors accounted for
nearly three quarters of the power band variance in each
subject group (variance accounted for: schizophrenia
5
the factor loadings of EEG power bands.
1Medication
effects were examined by performing comparisons within
diagnostic categories of individuals on and off a particular
drug. These tests failed to yield a single Medication Status
or Medication Status-by-Diagnosis effect, indicating that
medication status was unrelated to scores on beta and LFA
factors.
Comparisons of Diagnostic Groups on EEG
Factors
Two analyses of variances (ANOVAs) were carried out to
determine whether subgroups within the schizophrenic
and nonschizophrenic psychosis groups exhibited
differ-ences on EEG factor scores. Between-subjects effects
were Group (for schizophrenic patients: chronic and
first-episode; for nonschizophrenic psychosis patients: major
depressive, bipolar, and other psychosis), Gender (male
and female), and the interaction of Group and Gender.
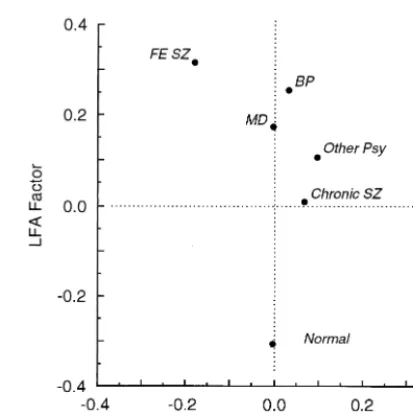
Figure 2 depicts means of EEG factor scores as a function
of group. For schizophrenic subgroups and
nonschizo-phrenic psychosis subgroups, analyses of beta and LFA
factor scores failed to yield any effects involving Group or
Gender, thus indicating that EEG factor scores did not
differ among schizophrenic subgroups (i.e., first-episode
and chronic) or among nonschizophrenic psychosis
sub-groups
(i.e.,
bipolar,
major
depressive,
and
other
psychosis).
To determine whether there were differences between
schizophrenic, nonschizophrenic psychosis, and
nonpsy-chiatric groups on EEG factor scores, ANOVAs were
carried out using beta and LFA factor scores as dependent
variables. Each ANOVA included Group (schizophrenic,
nonschizophrenic psychosis, and nonpsychiatric), Gender,
and the interaction of Group and Gender as
between-subjects effects. Analyses yielded a Group main effect for
LFA factor score [F(1,291)
5
7.00, p
5
.001] and a
Group-by-Gender effect for beta factor score [F(2,291)
5
4.83, p
5
.009]. Follow-up t tests revealed that both
schizophrenic patients [t(217)
5
3.47, p
5
.001] and
nonschizophrenic psychosis patients [t(183)
5
3.59, p
,
.001] had higher LFA scores than nonpsychiatric subjects,
but no difference was identified between schizophrenic
and nonschizophrenic psychosis groups for LFA factor
scores [t(188)
5 2
.25, p
.
.05]. Follow-up t tests for the
Group-by-Gender effect showed that female schizophrenic
patients had lower beta scores (mean
5 2
.418, SD
5
0.94) than female nonpsychiatric subjects [mean
5
.318,
SD
5
1.16; t(66)
5 2
2.51, p
5
.015] and female
1See Sponheim et al (1994) for details regarding analyses of covariation between
EEG power bands. Alpha dropout and the appearance of other frequencies is a common phenomenon in the EEG (for a review, see Niedermeyer 1999). Research suggests that alpha and low-frequency activity are generated by well-defined networks of pyramidal cells in layers IV and V of the cortex. The generation of alpha is dependent on the integrity of anatomically and function-ally distinct thalamic– cortical circuits in which the reticular nucleus of the thalamus serves as a pace maker for cortical pyramidal neurons. Pathologic low-frequency activity results from thalamic or midbrain reticular formation lesions, and more generally from partial deafferentation of the cerebral cortex through white matter pathology. Excess low frequency and diminished alpha power noted in schizophrenic patients is consistent with subcortical disruption of thalamic– cortical circuits. See Steriade et al 1990 and Steriade 1999 for reviews of the cellular basis of cerebral rhythmic electrical activity. Figure 1. Factor loadings of electroencephalogram power bands on beta and augmented-low-frequencies-diminished-alpha (LFA) factors. Factors were identified by a factor analysis with varimax rotation using data from schizophrenic, nonschizophrenic psy-chosis, and nonpsychiatric subjects (n5297).
nonschizophrenic psychosis patients (mean
5
.201, SD
5
1.09; t(45)
5 2
2.03, p
5
.048]. Beta scores for male
schizophrenic patients (mean
5
.029, SD
5
0.97) did not
differ from those of nonpsychiatric males [mean
5 2
.189,
SD
5
0.84; t(149)
5
1.41, p
.
.05] or nonschizophrenic
psychosis males [mean
5 2
.078, SD
5
0.97; t(141)
5
0.64, p
.
.05].
Clinical and Biological Concomitants of EEG
Abnormalities
To examine the clinical and biological characteristics of
schizophrenic patients with augmented low-frequency
power and diminished alpha-band power, subjects were
split into two groups defined by LFA factor scores.
Because both schizophrenic and nonschizophrenic
psy-chosis groups exhibited EEG power abnormalities, the
median LFA factor score for all patients (.1541) was used
to divide the subjects of each diagnostic category into high
LFA and low LFA groups. High and low LFA groups were
then compared on collateral indices to determine whether
patients with augmented low-frequency power and
dimin-ished alpha-band power (i.e., high LFA group) differed
from patients who did not exhibit these EEG
characteris-tics (i.e., low LFA group).
A consistent approach was taken toward testing
differ-ences between high and low LFA groups on clinical and
biological variables.
2For each clinical or biological index
high and low LFA groups were simultaneously contrasted
within first-episode and chronic schizophrenic samples to
determine whether the dependent variable(s) were
associ-ated with the presence of low-frequency and alpha-band
power abnormalities in schizophrenia, and whether the
association was related to disorder chronicity.
Between-subjects effects were LFA Score (high and low), Group
(first-episode and chronic), and the interaction of LFA
Score and Group. High and low LFA groups within the
bipolar, major depressive, and other psychosis groups
were also compared on the dependent variable(s). This
contrast tested whether the dependent variable(s) were
associated with the presence of EEG power abnormalities
in the nonschizophrenic psychosis groups, and whether the
associations were different among major depressive,
bipo-lar, and other psychosis patients. Between-subjects effects
were LFA Score (high and low), Group (bipolar, major
depressive, and other psychosis), and the interaction of
LFA Score and Group. When group comparisons yielded
effects involving LFA Score, follow-up tests were
con-ducted to detail the nature of the effect. Table 2 presents
means, SDs, and comparisons of high and low LFA Score
subjects on indices of symptomatology, brain morphology,
and other biological features.
To ascertain whether schizophrenic patients with
aug-mented low-frequency power and diminished alpha-band
power presented with distinct symptoms, we carried out
analyses of symptomatology indices in schizophrenic and
nonschizophrenic
psychosis
groups.
A
multivariate
ANOVA (MANOVA) of Psychosis, Disorganization, and
Negative Symptom scores for schizophrenic subjects
yielded an LFA Score effect [Wilks
l 5
.91, F(3,94)
5
3.18, p
5
.028] and a Group effect [Wilks
l 5
.89,
F(3,94)
5
3.96, p
5
.010]. Follow-up analyses revealed
that high LFA schizophrenic subjects exhibited more
negative symptomatology than low LFA subjects.
First-episode schizophrenic patients had higher scores than
chronic patients on the Psychosis [F(1,96)
5
6.20, p
5
.014] and Negative Symptom [F(1,96)
5
7.73, p
5
.010]
indices. In the nonschizophrenic psychosis group
multi-variate and unimulti-variate analyses of symptomatology indices
failed to yield any effects involving LFA Score.
To determine whether the brain morphology of subjects
with augmented low-frequency power and diminished
alpha-band power was different than that of subjects
without these EEG power characteristics, we conducted
analyses of brain morphology indices in schizophrenic and
nonschizophrenic psychosis patients. A MANOVA of four
brain morphology indices in schizophrenic patients
yielded a main effect for LFA Score [Wilks
l 5
.84,
F(1,74)
5
3.75, p
5
.008]. Follow-up analyses revealed
high LFA schizophrenic subjects had wider third
ventri-cles, larger frontal horns of the lateral ventriventri-cles, and
larger cortical sulci than low LFA subjects. Multivariate
and univariate analyses of brain morphology indices for
nonschizophrenic psychosis failed to yield any main or
interaction effects.
To ascertain whether subjects with augmented
low-frequency power and diminished alpha-band power had
unique ocular motor, electrodermal, or nailfold plexus
visibility features we carried out analyses of the other
biological indices under study. For schizophrenic patients,
high LFA first-episode subjects exhibited worse ocular
motor function than low LFA first-episode subjects
[t(51)
5
2.82, p
5
.007]. Also, high LFA chronic
schizophrenic patients had more deviant electrodermal
activity than low LFA chronic patients [t(48)
5
3.16, p
5
.003]. For nonschizophrenic psychosis patients the only
effect was a Group-by-LFA Score interaction for the
electrodermal activation index, but follow-up analyses
2Depending on the clinical or biological variable under examination, sample sizes
Table 2. Comparisons of High and Low LFA Score Subjects on Indices of Symptomatology, Brain Morphology, and Other Biological Features as a Function of Diagnostic Groups
Variable
Schizophrenic Subjects Nonschizophrenic Psychotic Subjects
Groups
High LFAa
[Mean (SD)]
Low LFAa
[Mean (SD)]
LFA Score effect
LFA Score3
Group effect Groups
High LFAa
[Mean (SD)]
Low LFAa
[Mean (SD)]
LFA Score effect
LFA Score3
Group effect
Symptomatologyb
Psychosis (delusions/ hallucinations)
First episode: 7.24 (5.02) 9.27 (5.74) F(1,96)53.23 F(1,96)50.01 Bipolar: 4.50 (4.32) 3.60 (3.68) F(1,66)52.14 F(2,66)50.25
Chronic: 4.67 (4.67) 6.49 (5.83) ns ns MD: 4.00 (3.21) 3.00 (4.95) ns ns
Other: 7.86 (5.05) 5.14 (4.06) Disorganization (formal
thought disorder)
First episode: 0.54 (0.95) 0.09 (0.42) F(1,99)52.68 F(1,99)53.18 Bipolar: 0.18 (0.39) 0.13 (0.35) F(1,67)52.35 F(2,67)51.22
Chronic: 0.23 (0.51) 0.25 (0.64) ns ns MD: 0.00 (NA) 0.00 (NA) ns ns
Other: 0.29 (0.49) 0.00 (NA)
Negative symptoms First episode: 3.11 (1.99) 1.83 (1.34) F(1,99)54.54 F(1,99)52.01 Bipolar: 2.00 (1.94) 1.07 (1.03) F(1,67)51.32 F(2,67)51.00
Chronic: 1.61 (2.22) 1.36 (1.63) p,.05 ns MD: 2.61 (1.39) 2.86 (2.14) ns ns
Other: 1.71 (1.11) 1.00 (1.53) Brain morphology
Third ventricle width (mm)
First episode: 4.16 (1.31) 3.15 (1.08) F(1,83)57.94 F(1,83)51.36 Bipolar: 3.54 (0.52) 3.30 (1.16) F(1,32)50.07 F(2,32)50.80
Chronic: 4.47 (0.96) 4.05 (1.21) p,.01 ns MD: 3.62 (0.84) 3.39 (1.00) ns ns
Other: 2.90 (0.03) 3.63 (0.61) Frontal horn–to– brain
ratio
First episode: 1.85 (0.66) 1.53 (0.77) F(1,88)53.80 F(1,88)50.07 Bipolar: 1.47 (0.66) 1.42 (0.36) F(1,32)50.98 F(2,32)51.63
Chronic: 2.13 (1.22) 1.71 (0.81) p5.05 ns MD: 1.79 (0.76) 1.61 (0.83) ns ns
Other: 1.40 (0.89) 2.35 (0.77) Cortical atrophy rating
(three-point scale)
First episode: 2.15 (0.74) 1.81 (0.75) F(1,84)54.09 F(1,84)50.00 Bipolar: 1.56 (0.88) 2.10 (0.88) F(1,32)50.38 F(2,32)50.70
Chronic: 2.27 (0.77) 1.93 (0.78) p5.05 ns MD: 2.25 (0.89) 2.00 (1.00) ns ns
Other: 1.67 (1.15) 2.00 (1.00)
Ventricle-to-brain ratio First episode: 6.63 (2.20) 6.57 (2.98) F(1,89)50.43 F(1,89)50.28 Bipolar: 5.71 (1.94) 6.45 (1.86) F(1,33)50.30 F(2,33)50.41
Chronic: 7.19 (1.47) 6.65 (2.03) ns ns MD: 6.40 (3.06) 5.40 (3.70) ns ns
Other: 6.51 (4.72) 6.27 (2.23) Other biological features
Eyetracking (log root-mean-square error)
First episode: 2.29 (0.26) 2.12 (0.19) F(1,107)54.47 F(1,107)53.81 Bipolar: 2.15 (0.21) 2.14 (0.28) F(1,68)50.19 F(2,68)50.47
Chronic: 2.21 (0.20) 2.20 (0.25) p,.05 p,.05 MD: 2.20 (0.21) 2.18 (0.24) ns ns
Other: 2.12 (0.20) 2.23 (0.20) Electrodermal
activation (factor score)
First episode: 0.93 (0.56) 1.09 (0.51) F(1,97)50.99 F(1,97)57.02 Bipolar: 0.86 (0.43) 0.71 (0.47) F(1,57)53.71 F(2,57)54.06
Chronic: 1.30 (0.41) 0.96 (0.34) ns p,.01 MD: 0.80 (0.43) 0.83 (0.32) ns p,.05
Other: 0.74 (0.46) 1.62 (0.71)
Plexus visibility score First episode: 0.65 (0.50) 0.61 (0.37) F(1,107)50.83 F(1,107)50.29 Bipolar: 0.40 (0.40) 0.44 (0.44) F(1,69)50.15 F(2,69)50.19
(log of score) Chronic: 0.73 (0.43) 0.61 (0.43) ns ns MD: 0.41 (0.47) 0.35 (0.35) ns ns
Other: 0.34 (0.46) 0.47 (0.44)
LFA, augmented-low-frequencies-diminished-alpha factor; MD, major depressive; Other, other psychosis.
aHigh LFA represents subjects with an LFA factor score greater than .1541, all other subjects are classified as Low LFA.
bRationally derived using items from the Present State Exam interview and the guidelines of Andreasen (1981, 1983) and Andreasen et al (1995).
S.R.
Sponheim
et
al
BIOL
PSYCHIATRY
2000;48:1088
failed to reveal any significant differences between high
and low LFA groups within the bipolar, major depressive,
and other psychosis groups.
Discussion
Results of this investigation demonstrate that
schizo-phrenic patients with augmented low-frequency power and
diminished alpha-band power (i.e., high LFA scores) have
more negative symptomatology, more deviant brain
mor-phology, worse ocular motor function, and greater
elec-trodermal deviation than schizophrenic patients without
these EEG power characteristics. Specifically,
schizo-phrenic patients who exhibited augmented low-frequency
and diminished alpha-band power had widened third
ventricles, enlarged frontal horns of the lateral ventricles,
and increased cortical sulci widths. First-episode
schizo-phrenic patients with high LFA scores showed worse
overall eyetracking than low LFA first-episode patients as
measured by root-mean-square error between
phase-cor-rected target and eye signals. Chronic schizophrenic
pa-tients with high LFA scores had more deviant
electroder-mal activation than low LFA chronic patients. Although
nonschizophrenic psychosis patients had EEG power
ab-normalities similar to those of schizophrenic patients, low
frequency and alpha-band power were not associated with
psychotic symptomatology or biological features.
Perhaps the strongest set of findings from this study
points to the presence of structural brain abnormalities in
schizophrenic patients with augmented low-frequency
power and diminished alpha-band power in their EEGs.
Both subcortical and cortical pathologies are suggested in
schizophrenic patients with EEG power abnormalities.
Third ventricle enlargement in schizophrenic patients with
augmented low-frequency power and/or diminished
alpha-band power, as demonstrated by our study and Takeuchi et
al (1994), may indicate that the thalamus plays a role in
EEG power abnormalities. Since the third ventricle is
bordered on both sides by the medial dorsal thalamic
nuclei, enlargement of the third ventricle may reflect
structural alterations in these nuclei. Neuropathology
re-search has revealed reductions in neuron and glial cell
numbers and the volume of medial dorsal nuclei in
schizophrenic patients (Pakkenberg 1990). More
gener-ally, neuroimaging studies have shown schizophrenic
patients to have reduced thalamic volumes (Andreasen et
al 1994; Buchsbaum et al 1996; Gur et al 1998; Staal et al
1998) and metabolism (Buchsbaum et al 1996). Because
EEG power abnormalities failed to be associated with
brain morphology indices in nonschizophrenic psychosis
patients, the neuropathology underlying deviation in EEG
power may be different in schizophrenic and
nonschizo-phrenic psychosis.
A brain dysfunction involving frontal cerebral areas
may also accompany brain wave anomalies in
schizophre-nia. First, the frontal horns of the lateral ventricles were
enlarged in schizophrenic patients with low-frequency and
alpha-band power abnormalities. Second, frontal lobe
metabolic activity has been associated with low-frequency
power in schizophrenic patients (Alper et al 1998). Third,
because schizophrenic patients with EEG power
abnor-malities in our study had more negative symptoms, and
investigators have shown negative symptoms in
schizo-phrenia to be associated with metabolic and structural
frontal lobe anomalies (cf. Buchsbaum and Hazlett 1998;
Gur and Pearlson 1993). Finally, an association between
frontal lobe dysfunction and low-frequency and
alpha-band power abnormalities is suggested by the positive
relationship between brain wave anomalies and ocular
motor dysfunction in first-episode schizophrenia.
Schizo-phrenic patients with ocular motor dysfunction have been
shown to perform poorly on tasks that tap frontal lobe
abilities (Bartfai et al 1985; Katsanis and Iacono 1991;
Sweeney et al 1992), and frontal lobe structures have been
suggested to play a role in the generation of
smooth-pursuit ocular motion required to perform eye-tracking
tasks (Grawe and Levander 1995; Levin 1984; MacAvoy
and Bruce 1995; Ross et al 1995). Because ocular motor
dysfunction is also a candidate marker for a genetic
vulnerability to schizophrenia (Grove et al 1992), the
association between ocular motor dysfunction and brain
wave anomalies is consistent with abnormal EEGs
result-ing from a genetically based neuropathology and not an
environmental pathogen (Sponheim et al 1997).
Geneti-cally based neuropathology is to be distinguished from
genetically
influenced
brain-based
vulnerability
for
schizophrenia. Electroencephalogram power
abnormali-ties appear not to reflect genetic vulnerability for
schizo-phrenia (Clementz et al 1994; Stassen et al 1999).
dysfunction (i.e., poor ocular motor functioning and
in-creased frontal horn of the lateral ventricle size) in our
study are consistent with thalamic– cortical disruption in
medial dorsal–prefrontal networks. Medial
dorsal–pre-frontal pathology in schizophrenia is also consistent with
low-frequency and alpha-band anomalies being most
evi-dent over frontal brain regions (Sponheim and Kodalen
1997). For future studies to test hypotheses regarding the
integrity of medial dorsal–prefrontal networks in
schizo-phrenia, they will need to employ EEG methods and brain
imaging measures that allow for more precise localization
of anomalies in EEG and brain morphology than those
used in this study.
This work was supported in part by grants from the National Institute of Mental Health (No. MN44643), the Medical Research Council of Canada, the National Health and Welfare Research Directorate of Canada, and the Psychology and Psychiatry Services at the Veterans Affairs Medical Center, Minneapolis, Minnesota. Dr. Sponheim was supported by a training grant from the National Institute of Mental Health (No. MH17069) and the Eva O. Miller Fellowship from the University of Minnesota Graduate School.
References
Alper K, Gunther W, Prichep LS, John ER, Brodie J (1998): Correlation of qEEG with PET in schizophrenia.
Neuropsy-chobiology 38:50 –56.
American Psychiatric Association (1980): Diagnostic and
Sta-tistical Manual of Mental Disorders, 3rd ed. Washington,
DC: American Psychiatric Press.
American Psychiatric Association (1994): Diagnostic and
Sta-tistical Manual of Mental Disorders, 4th ed. Washington, DC:
American Psychiatric Press.
Andreasen NC (1981): Scale of the Assessment of Negative
Symptoms (SANS). Iowa City: University of Iowa.
Andreasen NC (1983): Scale of the Assessment of Positive
Symptoms (SAPS). Iowa City: University of Iowa.
Andreasen NC, Arndt S, Alliger R, Miller D, Flaum M (1995): Symptoms of schizophrenia: Methods, meanings, and mech-anisms. Arch Gen Psychiatry 52:341–351.
Andreasen NC, Arndt S, Swayze V II, Cizaldo T, Flaum M, O’Leary D, et al (1994): Thalamic abnormalities in schizo-phrenia visualized through magnetic resonance image aver-aging. Science 266:294 –298.
Bartfai A, Levander SE, Nyback H, Berggren BM, Schalling D (1985): Smooth pursuit eye tracking, neuropsychological test performance, and computed tomography in schizophrenia.
Psychiatry Res 15:49 – 62.
Buchsbaum MS, Hazlett EA (1998): Positron emission tomog-raphy studies of abnormal glucose metabolism in schizophre-nia. Schizophr Bull 24:343–364.
Buchsbaum MS, Someya T, Teng CY, Abel L, Chin S, Najafi A, et al (1996): PET and MRI of the thalamus in never-medicated patients with schizophrenia. Am J Psychiatry 153:191–199.
Clementz BA, Iacono WG, Ficken J, Beiser M (1992): A family study of nailfold plexus visibility in psychotic disorders. Biol
Psychiatry 31:378 –390.
Clementz BA, Sponheim SR, Iacono WG, Beiser M (1994): Resting EEG in first-episode schizophrenia patients, bipolar psychosis patients, and their first-degree relatives.
Psycho-physiology 31:486 – 494.
Coppola R (1979): Isolating low frequency activity in EEG spectrum analysis. Electroencephalogr Clin Neurophysiol 46:224 –226.
Cronbach L (1951): Coefficient alpha and the internal structure of tests. Psychometrika 16:297–334.
Fenton GW, Fenwick PBC, Dollimore J, Dunn TL, Hirsch SR (1980): EEG spectral analysis in schizophrenia. Br J
Psychi-atry 136:445– 455.
Ficken JF (1991): A comprehensive study of electrodermal activity in first-episode psychotic patients and their relatives. Unpublished doctoral dissertation, University of Minnesota, Minneapolis.
Gattaz WF, Mayer S, Ziegler P, Platz M, Gasser T (1992): Hypofrontality on topographic EEG in schizophrenia. Eur
Arch Psychiatry Clin Neurosci 241:328 –332.
Gratton G, Coles MGH, Donchin E (1983): A new method of off-line removal of ocular artifact. Electroencephalogr Clin
Neurophysiol 55:468 – 484.
Grawe RW, Levander S (1995): Smooth pursuit eye movements and neuropsychological impairments in schizophrenia. Acta
Psychiatr Scand 92:108 –114.
Grove WM, Clementz BA, Iacono WG, Katsanis J (1992): Smooth pursuit ocular motor dysfunction in schizophrenia: Evidence for a major gene. Am J Psychiatry 149:1362–1368. Guich SM, Buchsbaum MS, Burgwald L, Wu J, Haier R, Asarnow R, et al (1989): Effect of attention on frontal distribution of delta activity and cerebral metabolic rate in schizophrenia. Schizophr Res 2:439 – 448.
Gur RE, Maany V, Mozley PD, Swanson C, Bilker W, Gur RC (1998): Subcortical MRI volumes in neuroleptic-naı¨ve and treated patients with schizophrenia. Am J Psychiatry 155: 1711–1717.
Gur RE, Pearlson GD (1993): Neuroimaging in schizophrenia research. Schizophr Bull 19:337–353.
Iacono WG (1982): Bilateral electrodermal habituation-disha-bituation and resting EEG in remitted schizophrenics. J Nerv
Ment Dis 170:91–101.
Iacono WG (1985): Psychophysiologic markers of psychopathol-ogy: A review. Can Psychol 26:96 –112.
Iacono WG, Beiser M (1989): Age of onset, temporal stability, and eighteen month course of first-episode psychosis. In: Cicchetti D, editor. The Emergence of a New Discipline:
Rochester Symposium on Developmental Psychopathology, Vol. 1. Hillsdale, NJ: Lawrence Erlbaum, 221–260.
Iacono WG, Ficken JW, Beiser M (1999): Electrodermal activa-tion in first-episode psychotic patients and their first-degree relatives. Psychiatry Res 88:25–39.
T, et al (1988): Ventricular and sulcal size at the onset of psychosis. Am J Psychiatry 145:820 – 824.
Itil TM, Saletu B, Davis S (1972): EEG findings in chronic schizophrenics based on digital computer period analysis and analog power spectra. Biol Psychiatry 5:1–13.
Itil TM, Saletu B, Davis S, Allen M (1974): Stability studies in schizophrenics and normals using computer-analyzed EEG.
Biol Psychiatry 8:321–335.
Jones EG (1997): Cortical development and thalamic pathology in schizophrenia. Schizophr Bull 23:483–501.
Kahn EM, Weiner RD, Coppola R, Kudler HS, Schultz K (1993): Spectral and topographic analysis of EEG in schizophrenia patients. Biol Psychiatry 33:284 –290.
Karson CN, Coppola R, Daniel DG (1988): Alpha frequency in schizophrenia: An association with enlarged cerebral ventri-cles. Am J Psychiatry 145:861– 864.
Katsanis J, Iacono WG (1991): Clinical, neuropsychological, and brain structural correlates of smooth-pursuit eye tracking performance in chronic schizophrenia. J Abnorm Psychol 100:526 –534.
Kemali D, Maj M, Galderisi S, Ariano MG, Starace F (1990): Factors associated with increased noradrenaline levels in schizophrenia patients. Prog Neuropsychopharmacol Biol
Psychiatry 14:49 –59.
Levin S (1984): Frontal lobe dysfunctions in schizophrenia: I. Eye movement impairments. J Psychiatr Res 18:27–55. Lund TR, Sponheim SR, Iacono WG, Clementz BA (1995):
Internal consistency reliability of resting EEG power spectra in schizophrenia and nonpsychiatric subjects.
Psychophysiol-ogy 32:66 –72.
MacAvoy MG, Bruce CJ (1995): Comparison of the smooth eye tracking disorder of schizophrenics with that of nonhuman primates with specific brain lesions. Int J Neurosci 80:117– 151.
Merrin EL, Floyd TC (1991): Average reference EEG lateraliza-tion in schizophrenic patients. J Neuropsychiatry Clin
Neu-rosci 3:307–314.
Merrin EL, Floyd TC (1992): Negative symptoms and EEG alpha activity in schizophrenic patients. Schizophr Res 8:11– 20.
Merrin EL, Floyd TC (1996): Negative symptoms and EEG alpha in schizophrenia: A replication. Schizophr Res 19:151–161. Miyauchi T, Endo S, Kajiwara S, Ishii M, Okajima J (1996):
Computerized electroencephalogram in untreated schizo-phrenics: A comparison between disorganized and paranoid types. Psychiatry Clin Neurosci 50:71–78.
Miyauchi T, Tanaka K, Hagimoto H, Miura T, Kishimoto H, Matsushita M (1990): Computerized EEG in schizophrenia patients. Biol Psychiatry 28:488 – 494.
Morihisa JM, Duffy FH, Wyatt RJ (1983): Brain electrical activity mapping (BEAM) in schizophrenia patients. Arch
Gen Psychiatry 40:719 –728.
Nagase Y, Okubo Y, Toru M (1996): Electroencephalography in schizophrenic patients: Comparison between neuroleptic naı¨ve state and after treatment. Biol Psychiatry 40:452– 456. Niedermeyer E (1999): The normal EEG of the waking adult. In: Niedermeyer E, Lopes da Silva F, editors.
Electroencepha-lography: Basic Principles, Clinical Applications, and Re-lated Fields, 4th ed. Baltimore: Williams & Wilkins, 28 –75.
Omori M, Koshino Y, Murata T, Murata I, Hrie T, Isaki K (1992): Quantitative EEG of elderly schizophrenia patients.
Jpn J Psychiatry 46:681– 692.
Omori M, Koshino Y, Murata T, Murata I, Nishio M, Sakamoto K, et al (1995): Quantitative EEG in never-treated schizo-phrenia patients. Biol Psychiatry 38:303–309.
Pakkenberg B (1990): Pronounced reduction of total neuron number in mediodorsal thalamic nucleus and nucleus accum-bens in schizophrenics. Arch Gen Psychiatry 47:1023–1028. Ross DE, Thaker GK, Holcomb HH, Cascella NG, Medoff DR, Tamminga CA (1995): Abnormal smooth pursuit eye move-ments in schizophrenic patients are associated with cerebral glucose metabolism in oculomotor regions. Psychiatry Res 58:53– 67.
Sponheim SR (1993): The electroencephalogram in schizophre-nia: Frequency abnormalities and the clinical, biological, and longitudinal contexts of disorder. Unpublished doctoral dis-sertation, University of Minnesota, Minneapolis.
Sponheim SR, Clementz BA, Iacono WG, Beiser M (1994): Resting EEG in first-episode and chronic schizophrenia.
Psychophysiology 31:37– 43.
Sponheim SR, Iacono WG, Clementz BA, Beiser M (1997): Season of birth and EEG power abnormalities in schizophre-nia. Biol Psychiatry 41:1020 –1027.
Sponheim SR, Kodalen KM (1997, October): Scalp distribution of EEG frequency abnormalities in schizophrenia: Prelimi-nary results. Presented at the 37th annual meeting of the Society for Psychophysiological Research, North Falmouth, Massachusetts.
Staal WG, Hulshoff HE, Schnack H, van der Schot AC, Kahn RS (1998): Partial volume decrease of the thalamus in relatives of patients with schizophrenia. Am J Psychiatry 155:1784 – 1786.
Stassen HH, Coppola R, Gottesman II, Torrey EF, Kuny S, Rickler KC, Hell D (1999): EEG differences in monozygotic twins discordant and concordant for schizophrenia.
Psycho-physiology 36:109 –117.
Steriade M (1999): The cellular substrates of brain rhythms. In: Niedermeyer E, Lopes da Silva F, editors.
Electroencepha-lography: Basic Principles, Clinical Applications, and Re-lated Fields, 4th ed. Baltimore: Williams & Wilkins, 28 –75.
Steriade M, Gloor P, Llinas RR, Lopes da Silva FH, Mesulam MM (1990): Report of IFCN committee on basic mecha-nisms: Basic mechanisms of cerebral rhythmic activities.
Electroencephalogr Clin Neurophysiol 76:481–508.
Sweeney JA, Haas GL, Li S (1992): Neuropsychological and eye movement abnormalities in first-episode and chronic schizo-phrenia. Schizophr Bull 18:283–293.
Takeuchi K, Takigawa M, Fukuzako H, Hokazono Y, Hirakawa K, Fukuzako T, et al (1994): Correlation of third ventricle enlargement and EEG slow wave activity in schizophrenia patients. Psychiatry Res 55:1–11.
Williamson PC, Kaye H (1989): EEG mapping applications in psychiatric disorders. Can J Psychiatry 34:680 – 685. Wing JK, Cooper JE, Sartorius N (1974): The Measurement and
Classification of Psychiatric Symptoms. Cambridge, UK:
Cambridge University Press.
Wrigley C, Neuhaus JO (1955): The Matching of Two Sets of
Factors, Contract Memorandum Report A-32, Task A.