Allozyme and DNA sequence comparisons
of nine species of
Encephalartos
(Zamiaceae)
Herman van der Bank
a,*, Michael Wink
b, Piet Vorster
c,
Jens Treutlein
b, Louise Brand
a, Michelle van der Bank
a,
Johan Hurter
da
Department of Zoology, Department of Botany, Rand Afrikaans University, PO Box 524, Auckland Park 2006, South Africa
bUniversita¨t Heidelberg, Institut fu¨r Pharmazeutische Biologie, Im Neuenheimer Feld 364,
69120 Heidelberg, Germany
cDepartment of Botany, University of Stellenbosch, Private Bag X1, 7602 Matieland, South Africa dLowveld National Botanical Garden, PO Box 1024, Nelspruit 1200, South Africa
Received 21 February 2000; accepted 10 April 2000
Abstract
Phylogenetic relationships betweenEncephalartos altensteiniiLehmann,E. arenariusR.A. Dyer, E. horridus (Jacquin) Lehmann, E. latifrons Lehmann, E. lehmannii Lehmann,
E. longifolius(Jacquin) Lehmann, E. princepsR.A. Dyer and E.trispinosus (Hooker) R.A. Dyer were studied, using E. ferox Bertoloni f. as outgroup. Three continuous and one discontinuous buffer systems were used and gene products of 14 enzyme coding loci were examined by horizontal starch gel-electrophoresis. Genetic variation was studied in a cultivated population ofE. lehmanniiand the average heterozygosity value for this population is 13.5%, which falls within the range reported for other cycad species. Fixed allele differences between the species studied was not found at any of the loci studied, which suggest that these species are closely related. DNA sequence analysis ofrbcL and ITS 1 & 2 genes (1428 and 895 basepairs, respectively) confirmed the close genetic relationships between these taxa. According to ITS andrbcL sequences E. altensteiniiandE. princepsare sibling taxa which form a sister group toE. arenarius, E. horridus,E. latifrons,E. lehmannii,E. longifolius, andE.
trispinosus.The genetic distances between both groups were 0.12–0.47% for ITS and 0.08– 0.16% forrbcL DNA. The results indicate recent (probably pleistocenic) speciation for this group of cycads, and the relationships are discussed with reference to affinities based on morphology and distribution. # 2001 Elsevier Science Ltd. All rights reserved.
Keywords:Phylogenetic relationships; Encephalartos; Zamiaceae; Allozyme; DNA sequence; rbcL; ITS 1 & 2
*Corresponding author. Tel.: +27-11-489-2450; fax: +27-11-489-2286. E-mail address:[email protected] (H. van der Bank).
1. Introduction
The taxonomy of the Cycadales is problematic because really distinctive morphological characteristics are lacking in most groups, and species are usually defined in terms of sets of characteristics. Furthermore, the characteristics used for identification may not be of phylogenetic significance due to a high degree of convergence or divergence. It also seems reasonable to assume that at least some of the species in a given geographical area are closely related (i.e. derived from a common ancestor) due to slow reproduction rates (Tang, 1990) and absence of long-distance dispersal mechanisms for seeds. In the Eastern Cape Province of South Africa eight of the 13 knownEncephalartosspecies are thought to be closely related. These are Encephalartos arenarius R.A. Dyer, E. horridus (Jacquin) Lehmann, E. latifrons Lehmann, E. lehmannii Lehmann, E. longifolius (Jacquin) Lehmann, E. princeps R.A. Dyer, and E. trispinosus (Hooker) R.A. Dyer, with E. altensteinii
Lehmann thought to be somewhat more distantly related. These are the species used for this study. The remaining species,E. caffer(Thunberg) Lehmann,E. cycadifolius
(Jacquin) Lehmann,E. friderici-guilielmi Lehmann, E. ghellinckii Lemaire, and E. villosusLemaire, most certainly belong to other, more distantly related groups within the genus. The studied species have either or both very strongly dentate (almost dentate–lobed) leaflets and very glaucous leaves (Dyer, 1965a, b). Such dentate leaflets are not known anywhere else in the distribution area of the genus, and glaucous leaves are uncommon elsewhere (Vorster, 1993, 1999). Apart from these two characteristics, these eight species vary greatly in respect of growth form (development of an aerial trunk) and cone morphology. The development of an aerial trunk may well be a rather plastic (albeit at present genetically fixed) reaction to local environmental conditions, as the habitat becomes markedly drier further inland from the coast. The cones, being the reproductive structures, could be expected to provide a more reliable indication of phylogenetic relationships than vegetative characteristics. However, cone morphology varies considerably, and cannot be satisfactorally correlated with vegetative morphological features (Vorster, 1993).
The purpose of this study is to compare the eight species ofEncephalartoslisted above in respect of DNA sequence (ITS 1 & 2 and rbcL) and allozyme data to determine whether they form a phylogenetically coherent group and to determine the relationships between the species. Encephalartos ferox Bertoloni f. is included as outgroup species. We have also analysed a cultivated population ofE. lehmanniito compare within- and between species allozymic variation.
2. Material and methods
2.1. Allozyme study
natural populations, and secondly because plants in nature have become very scarce due to illicit collecting for the ornamental plant trade. We have, however, used only plants of undisputed identity, and with collection data where possible. When sampling different specimens of the same species, we took care not to sample a clone twice. Herbarium voucher specimens of the plants studied were deposited at the herbarium of the Botany Department at the University of Stellenbosch (STEU) and at the herbarium of the Lowveld National Botanical garden (GLOW).Encephalartos feroxwas selected as outgroup because it has a number of characteristics not found in the Eastern Cape Province species. It has a soft-textured stem in contrast to the hard and compact stems of the Eastern Cape species: it has salmon-red cones which
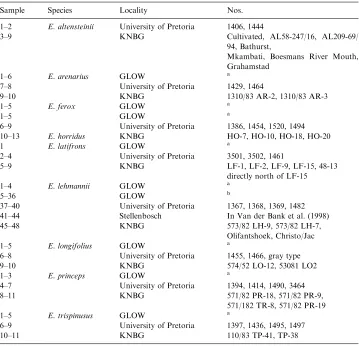
Table 1
Locality description of theEncephalartosindividuals studied
Sample Species Locality Nos.
1–2 E. altensteinii University of Pretoria 1406, 1444
3–9 KNBG Cultivated, AL58-247/16, AL209-69/
94, Bathurst,
Mkambati, Boesmans River Mouth, Grahamstad
1–6 E. arenarius GLOW a
7–8 University of Pretoria 1429, 1464
9–10 KNBG 1310/83 AR-2, 1310/83 AR-3
1–5 E. ferox GLOW a
1–5 GLOW a
6–9 University of Pretoria 1386, 1454, 1520, 1494
10–13 E. horridus KNBG HO-7, HO-10, HO-18, HO-20
1 E. latifrons GLOW a
2–4 University of Pretoria 3501, 3502, 1461
5–9 KNBG LF-1, LF-2, LF-9, LF-15, 48-13
directly north of LF-15
1–4 E. lehmannii GLOW a
5–36 GLOW b
37–40 University of Pretoria 1367, 1368, 1369, 1482
41–44 Stellenbosch In Van der Bank et al. (1998)
45–48 KNBG 573/82 LH-9, 573/82 LH-7,
Olifantshoek, Christo/Jac
1–5 E. longifolius GLOW a
6–8 University of Pretoria 1455, 1466, gray type
9–10 KNBG 574/52 LO-12, 53081 LO2
1–3 E. princeps GLOW a
4–7 University of Pretoria 1394, 1414, 1490, 3464
8–11 KNBG 571/82 PR-18, 571/82 PR-9,
571/182 TR-8, 571/82 PR-19
1–5 E. trispinusus GLOW a
6–9 University of Pretoria 1397, 1436, 1495, 1497
10–11 KNBG 110/83 TP-41, TP-38
GLOW, Lowveld National botanical Garden; KNGB, Kirstenbosch National Botanical Gardens.
are rare in Encephalartos, the male cones emerge in succession rather than simultaneously and are often borne on markedly long peduncles (a trait of tropical species), and it is geographically far separated from the Eastern Cape (Vorster, 1999).
In order to compare intra- and interspecific variation, we also used seedlings raised from field-collected seed of different plants ofE. lehmannii,and grown at GLOW. The seedlings will eventually be planted in one of several gene banks at GLOW.
Leaf tissue extracts were prepared and analysed by starch gel electrophoresis (12% gels) using the extraction buffer, standard electrophoretic procedures, method of interpretation of gel banding patterns and locus nomenclature referred to by Van der Bank et al. (1998). The buffers used are: tris–EDTA-borate (A; pH 8.6; Goncharenko et al., 1992); histidine citrate (HC; pH 5.7; Kephart, 1990); tris– EDTA-borate (MF; pH 8.6; Markert and Faulhaber, 1965), and lithium-borate (electrode: pH 8.0) tris-citrate (gel: pH 8.7) (RW; Ridgway et al., 1970). Statistical analysis of allozyme data was executed using BIOSYS-1 (Swofford and Selander, 1981) and DISPAN (Ota, 1993). We have used GENEPOP (Raymond and Rousset, 1995) to determine if significant genotypic differentiation for all species studied could be found.
2.2. DNA sequence analyses
Plant material was identical to that used for allozyme analysis; in addition fresh material ofE. altensteinii, andE. lehmannii(no. 2) was obtained from the Botanical Garden of Heidelberg University.
DNA was isolated from dried leaves of Encephalartosusing the CTAB method (Doyle and Doyle, 1990). The marker genes were amplified by polymerase chain reaction (PCR) using the following primers:rbcL-N (forward) 50-ATG TCA CCA
CAA ACA GAR ACK AAA GC-30; rbcL-R (reverse) 50- CAA AAT TAA ATM
primer, 1.5ml dNTPs (10 mM), 0.75 U Taq-Polymerase (Pharmacia), 1ml DMSO, and 1ml 20 mg/ml BSA. PCR cycle forrbcL : 2 min at 948C, then 30 cycles with 45 s at 948C, 90 s at 458C and 90 s at 728C, and finally 5 min at 728C; ITS: 2 min at 948C, then 30 cycles with 45 s at 948C, 90 s at 718C and finally 20 min at 728C.
using the phylogeny program PAUP* 4.0 (Swofford, 1991). Methods employed were maximum parsimony (MP), neighbour-joining (NJ), and maximum likelihood (MLE). A bootstrap analysis (1000 replicates) was performed to estimate how good the furcations were supported by the data.
3. Results and discussion
3.1. Allozyme study
Locus abbreviations, enzyme commission numbers, and monomorphic loci are listed in Table 2. Allele products at the following loci were monomorphic: GPI-1, MDH, PGDH, PGM-1, -2, PEPD and PEP-LT1, and those of ACP and PER migrated cathodally. Allele frequencies for polymorphic loci are presented in Table 3, and allozyme phenotypes of putative heterozygotes were congruent with those expected on the basis of the quaternary structure of the enzyme (Ward, 1977).
3.1.1. Within species variation
Ellstrand et al. (1990) reported values ofP=50%,A=1.61 andH=0.08; Byrne and James (1991) obtained values of 60%, 1.8 and 0.24; Sharma et al. (1998b) reported ranges ofP=17.6–35.3%,A=1.2–1.4 andH=0.02–0.11; and Sharma et al. (1998a) obtained values ofP=26%,A=1.3 andH=0.06. Therefore, the ranges of these values are from 17.6 to 60%, 1.2–1.8 and 0.02–0.11 respectively. We have obtained anH value of 0.135, aP value of 35.7%, and an Avalue of 1.6 for the
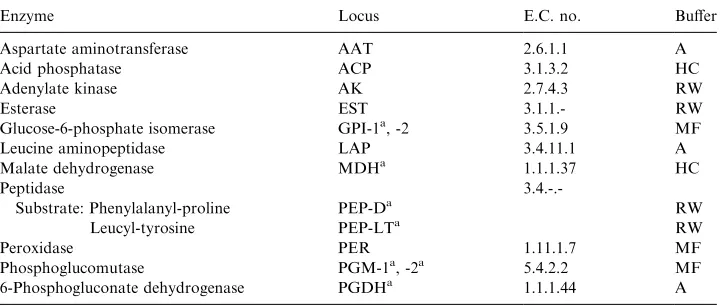
Table 2
Locus abbreviations, enzyme commission numbers (E.C. No.) and buffers are listed after each enzyme. See Material and Methods for descriptions of buffers
Enzyme Locus E.C. no. Buffer
Aspartate aminotransferase AAT 2.6.1.1 A
Acid phosphatase ACP 3.1.3.2 HC
Adenylate kinase AK 2.7.4.3 RW
Esterase EST 3.1.1.- RW
Glucose-6-phosphate isomerase GPI-1a, -2 3.5.1.9 MF
Leucine aminopeptidase LAP 3.4.11.1 A
Malate dehydrogenase MDHa 1.1.1.37 HC
Peptidase
3.4.-.-Substrate: Phenylalanyl-proline PEP-Da RW
Leucyl-tyrosine PEP-LTa RW
Peroxidase PER 1.11.1.7 MF
Phosphoglucomutase PGM-1a, -2a 5.4.2.2 MF
6-Phosphogluconate dehydrogenase PGDHa 1.1.1.44 A
a
cultivated E. lehmannii population studied. These values fall within the ranges reported above for thePandAvalues, and it is 2.5% higher for the H value. The latter value is probably due to the fact that we have studied a cultivated population selected to include the maximum phenotypic variation of the parent plants. Nevertheless, our values are also less than corresponding values reported for other outbreeding plants (Gottlieb, 1981) and for 28 studies of gymnosperms (Hamrick et al., 1979). This is in agreement with the results of the above-mentioned authors on other cycad species.
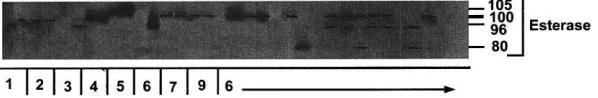
A zymogram showing more phenotypic variation within than between species in allele products at the EST enzyme coding locus is presented in Fig. 1. Gene diversity analysis revealed that 85% of the differentiation was intraspecific and only 15% interspecific. This, together with the fact that the taxa all share the most common allele at all of the enzyme coding loci studied, indicate that they are very closely related and that their divergence must be relatively recent. It also demonstrates that sample error due to small sample sizes is a significant factor to consider. For example, Van der Bank et al. (1998) recommended that the results of their preliminary study should be verified by using larger sample sizes, and it is evident that they have over estimated the amount of genetic differentiation between E. altensteiniiandE. lehmannii.
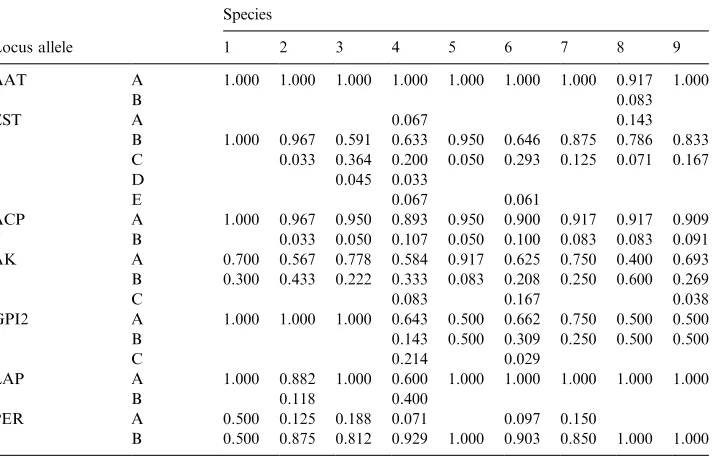
Table 3
Allele frequencies at polymorphic loci for theEncephalartosspecies studied. See Table 4 for species designations
Species
Locus allele 1 2 3 4 5 6 7 8 9
AAT A 1.000 1.000 1.000 1.000 1.000 1.000 1.000 0.917 1.000
B 0.083
EST A 0.067 0.143
B 1.000 0.967 0.591 0.633 0.950 0.646 0.875 0.786 0.833 C 0.033 0.364 0.200 0.050 0.293 0.125 0.071 0.167
D 0.045 0.033
E 0.067 0.061
ACP A 1.000 0.967 0.950 0.893 0.950 0.900 0.917 0.917 0.909 B 0.033 0.050 0.107 0.050 0.100 0.083 0.083 0.091 AK A 0.700 0.567 0.778 0.584 0.917 0.625 0.750 0.400 0.693 B 0.300 0.433 0.222 0.333 0.083 0.208 0.250 0.600 0.269
C 0.083 0.167 0.038
GPI2 A 1.000 1.000 1.000 0.643 0.500 0.662 0.750 0.500 0.500
B 0.143 0.500 0.309 0.250 0.500 0.500
C 0.214 0.029
LAP A 1.000 0.882 1.000 0.600 1.000 1.000 1.000 1.000 1.000
B 0.118 0.400
PER A 0.500 0.125 0.188 0.071 0.097 0.150
3.1.2. Between species differentiation
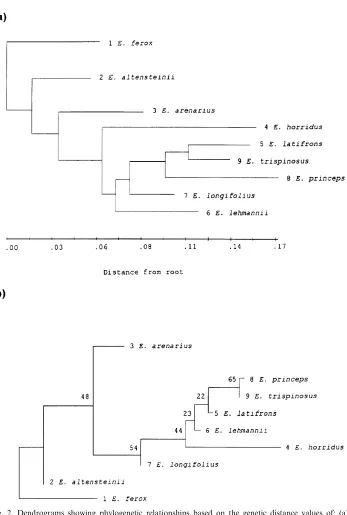
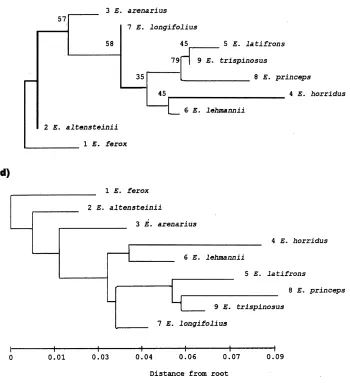
The taxonomic uses of allozyme electrophoretic data were reviewed by many authors, including Avise (1974), Thorpe (1982) and Thorpe and Sole´-Cava (1994). Several statistically based measures of genetic distance are available to reduce genetic differentiation between populations over a range of enzyme loci to a single figure level. However, the Nei (1978) measure is now used predominantly (Thorpe and Sole´-Cava, 1994). It is interesting that the consensus tree has got the same topology as the Nei (1978) tree (Figs. 2e and c).
The Nei (1978) unbiased genetic distance values (adapted for small sample sizes) between taxa are presented in Table 4. The mean genetic distance values between the ingroup taxa studied are 0.009 and 0.025 between the ingroup and outgroup taxa studied. These values were higher for the other genetic distance values reported in Table 4, but reflect similar groupings, and are included for comparisons with values listed in the literature. Phylogenetic relationships based on all four genetic distance value sets are depicted in Figs. 2a–d and a majority-rule consensus tree is shown in Fig. 2e. The cophenetic correlation value for the rooted Wagner trees in Fig. 2a is 95.1% the chord distance coefficient of (Cavalli-Sforza and Edwards (1967) and 94.9% for the Rogers (1972) genetic distance (Fig. 2d). Poor bootstrap values (average: 45.4, range: 22–79) between the branches were obtained (using DISPAN), and the only relative good values (65 and 79 in Figs. 2b and c) showed incongruent groupings between these trees. The consensus tree (Fig. 2d) showed that
E. altensteiniiis basal to the other ingroup taxa.
Shaklee et al. (1982), Thorpe (1982) and Thorpe and Sole´-Cava (1994) showed the relationship between taxonomic divergence and genetic distance, and concluded that the genetic distance (Nei, 1972) average 0.05 (range: 0.002–0.07) for conspecific populations and 0.30 (range: 0.03–0.61) for congeneric species. The genetic distance values obtained in the present study (Table 4) between the congeneric species (0.025) falls within the lower limit for populations from the same species. The close relationships between the taxa studied is responsible for the low bootstrap values in Fig. 2b (range: 22–65; average: 43) and in Fig 2c (range: 35–79; average: 53). For morphological data, bootstrap values of 50–70 are considered adequate, but for molecular data higher values are required. This supports the results of the DNA analysis, which also indicated that the species are closely related and that recent divergence has occurred.
The Wright (1978) fixation (F) index is another measure to describe differentiation between populations. The amount of differentiation among subpopulations relative to the limiting amount under complete fixation, FST, averaged 0.150 for
polymorphic loci (Table 5). This is an indication of little genetic differentiation
between the cycads studied. The mean value of the Wright (1978) fixation index of individuals relative to the total population, FIS, is 0.500 and 0.575 for the total
population and its subpopulations (FIT). The values ofFIS are close to zero in most
natural populations where random mating within subpopulations occur (Nei, 1986). TheFIT value is also indicative of limited barriers to gene flow between the taxa
studied. The loci did not contribute much to intraspecific differences (FST values
ranged from only 0.09 to 0.295) because the taxa shared the most common alleles at all loci (Table 3). Our averageFISvalue is more than the values reported by other
researchers for cycads (0.2–0.47). Conversely, the genetic distance values between the taxa in the present study are less than values obtained by other authors for cycads. For example, the Nei (1978) genetic distance values were between 0.014 and 0.250 (Sharma et al., 1998b), from 0.042 to 0.222 for sixEncephalartosspecies (Van der Bank et al., 1998), and the Rogers (1972) genetic distances ranged from 0.023 to 0.072 (Sharma et al., 1998a). Walters and Decker–Walters (1991) also reported similar (low) overall variation inZamia pumilaL.sensu latoand high geographical differentiation. Our maximum genetic distance values were 0.038 between the outgroup species andE. latifrons(Nei, 1978) and 0.118 for the Rogers (1972) genetic distance (Table 4). These values are, therefore, comparable to the values for other cycad taxa, which indicate that the species are closely related.
Even though fixed allele mobility differences between species did not occur at any of the loci studied, significant (P50.05) differences in allelic distributions were obtained at the following loci: EST (betweenE. arenariusandE. ferox,E. altensteinii
and E. latifrons; E. lehmannii and E. altensteinii, E. latifrons and E. princeps
respectively), GPI-2 (betweenE. horridusandE. altensteinii;andE. altensteiniiand
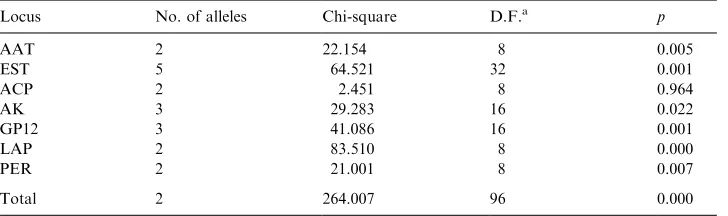
E. trispinosus, respectively) and LAP (betweenE. horridusand all of the other taxa excluding E. altensteinii and E. ferox). In addition, significant (P50.05) hetero-geneity differences was only found at the ACP locus (Table 6) for the combined analysis of all taxa studied. These differences may present insights into the relationships of the taxa studied.
3.1.3. Relationships
Encephalartos altensteiniiwas included in the study because it occurs in the same geographical area as the others and naturally hybridises with some of them. For example, it interbreeds freely withE. trispinosuswhere the two species are sympatric
(Dyer, 1965b; Vorster, 1986). Nevertheless, E. altensteinii differs from the other species in respect of its bright green, narrow, very moderately dentate leaflets, and its yellowish cones, and has been suspected of belonging to a different group of species. Not unexpectedly, in all the phenograms (Fig. 2) it occurs in a basal position.
Encephalartos arenariusclosely resembles the other species on account of its short stem, its short and very rigid fronds of which the apices tend to recurve, and its more or less glaucous and very pronounced dentate leaflets. In all the phenograms it is basal to all the remaining ingroup species studied (E. longifolius, E. horridus, E. lehmannii, E. trispinosus, E. latifronsandE. princeps). Vegetatively it very strongly
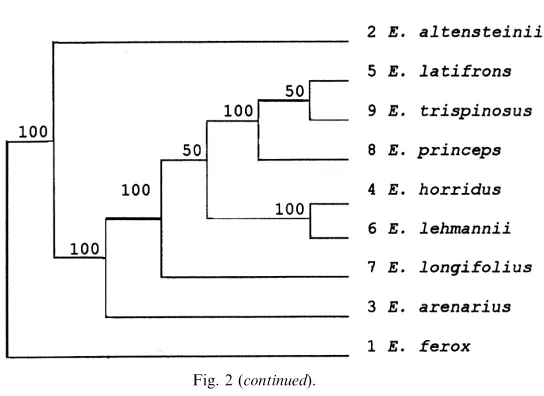
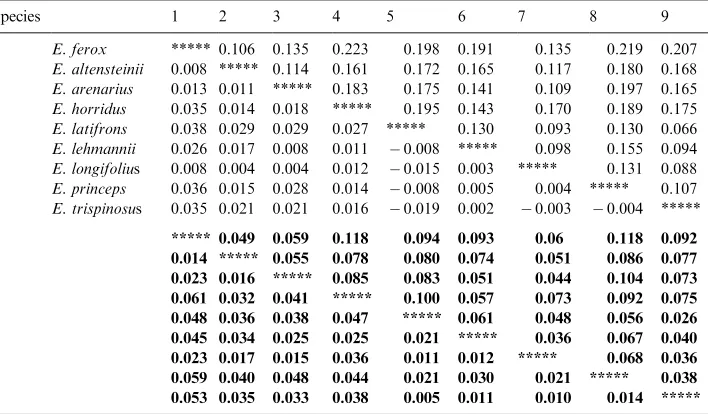
Table 4
Matrix of Nei’s (1978) unbiased genetic distance coefficient below diagonal, Cavalli-Sforza and Edwards’ (1967) chord distance above diagonal, and Rogers (1972) and Nei et al. (1983) distances (bold values above and below diagonal, respectively)
Species 1 2 3 4 5 6 7 8 9
1 E. ferox ***** 0.106 0.135 0.223 0.198 0.191 0.135 0.219 0.207 2 E. altensteinii 0.008 ***** 0.114 0.161 0.172 0.165 0.117 0.180 0.168 3 E. arenarius 0.013 0.011 ***** 0.183 0.175 0.141 0.109 0.197 0.165 4 E. horridus 0.035 0.014 0.018 ***** 0.195 0.143 0.170 0.189 0.175 5 E. latifrons 0.038 0.029 0.029 0.027 ***** 0.130 0.093 0.130 0.066 6 E. lehmannii 0.026 0.017 0.008 0.011 ÿ0.008 ***** 0.098 0.155 0.094 7 E. longifolius 0.008 0.004 0.004 0.012 ÿ0.015 0.003 ***** 0.131 0.088 8 E. princeps 0.036 0.015 0.028 0.014 ÿ0.008 0.005 0.004 ***** 0.107 9 E. trispinosus 0.035 0.021 0.021 0.016 ÿ0.019 0.002 ÿ0.003 ÿ0.004 *****
1 ***** 0.049 0.059 0.118 0.094 0.093 0.06 0.118 0.092
2 0.014 ***** 0.055 0.078 0.080 0.074 0.051 0.086 0.077
3 0.023 0.016 ***** 0.085 0.083 0.051 0.044 0.104 0.073
4 0.061 0.032 0.041 ***** 0.100 0.057 0.073 0.092 0.075
5 0.048 0.036 0.038 0.047 ***** 0.061 0.048 0.056 0.026
6 0.045 0.034 0.025 0.025 0.021 ***** 0.036 0.067 0.040
7 0.023 0.017 0.015 0.036 0.011 0.012 ***** 0.068 0.036
8 0.059 0.040 0.048 0.044 0.021 0.030 0.021 ***** 0.038
9 0.053 0.035 0.033 0.038 0.005 0.011 0.010 0.014 *****
Table 5
Summary of Wright’s (1978)F-statistics at all loci
resemblesE. latifrons to such an extent that the two species are not always easy to distinguish in the absence of cones which are distinct in their morphology (Dyer, 1956). InE. arenarius, the female cone scale faces are smooth rather than warty, and the male cone scales have much less prominently produced apices, but as yet we cannot say what the phylogenetic significance of these differences is. It therefore comes as a surprise that these two species are so far apart in all the trees. Very glaucous variants ofE. arenariusvegetatively also strongly resembleE. horridus, and the only obvious difference between the cones is the russet-brown indumentum in
E. horridus. It is therefore also unexpected that these two species are so far apart. However, the small genetic distance values and low bootstrap numbers as a result of very similar allele frequencies, indicate that it closely resembles the other species, and that the relationships and variable positions of the other ingroup taxa are probably random.
Encephalartos longifoliusis basal to E. princeps,E. trispinosus andE. latifronsin Figs. 2a and d, and basal toE. horridus,E. lehmannii,E. trispinosus,E. latifronsand
E. princeps in Figs. 2b and c as well as the consensus tree. All these species have relatively short and very rigid fronds, and typically the very base of the frond has a sharply delineated pale-coloured zone which is also present in E. arenarius. This pale-coloured zone is also present in other species to as far north as Kenya (e.g.
E. kisamboFaden and Beentje, 1989), but is usually not nearly as conspicuous as in these Eastern Cape species. However, the separation ofE. longifoliusis supported by its combination of usually an almost total absence of teeth on the leaflets and well-developed arborescent habit. Its basal position relative toE. princeps,E. trispinosus
and E. latifrons in Figs. 2a and d corresponds with the drawn-out apices of the microsporophylls and the warty faces of the megasporophylls of all four species, and the very well-developed trunks ofE. longifolius,E. latifronsandE. princeps. Of these four species,E. princepsis the only one that habitually produces multiple cones per stem.Encephalartos longifolius hybridises naturally withE. horriduswhere the two species come into contact near Uitenhage (Vorster, 1986), and where it also hybridises with E. lehmannii in the Paardepoort (JH, personal observation). It is
Table 6
Contingency Chi-square analysis at polymorphic loci
Locus No. of alleles Chi-square D.F.a p
possible that hybridisation with E. horridus was previously more extensive, as suggested by occasional specimens exhibiting strongly dentate leaflets.
Encephalartos horridus is vegetatively a very distinctive species. In Fig. 2a, it is basal toE. lehmannii,E. longifolius, E. princeps, E. trispinosusandE. latifrons,and in Fig. 2b it is basal to all these species exceptE. longifolius. While this is plausible in terms of morphological traits, it is not particularly illuminating. However, in Figs. 2c–e it is grouped together withE. lehmannii. Superficially these two species are morphologically quite different, with the leaflets of E. horridus being heavily pungent-lobed and those ofE. lehmanniibeing almost completely entire at maturity. Nevertheless, there are also close morphological resemblances between the two, including relatively poorly developed stems, hard and strongly glaucous fronds with apices more or less recurving, solitary green cones overlain with russet indumentum, microsporophylls with moderately projecting apices, and megasporophylls with mostly smooth exposed faces. The two species are geographically adjacent, and north of Uitenhage there is a morphologically intermediate population that may or may not be indicative of interbreeding between the two species. Occasional warty female cones inE. horridusmay be indicative of past hybridisation withE. longifolius.
Encephalartos lehmanniiin all the phenograms is well separated fromE. princeps,
which it remarkably resembles vegetatively although it differs profoundly in respect of morphology and number of both male and female cones. The two species are also geographically (and thus reproductively) well separated. In all the phenograms it occupies a position close to that ofE. horridus.
Encephalartos trispinosusin Figs. 2a–e presents no real conflict with morphological data, falling in the group of species with drawn-out apices of microsporophylls and warty exposed faces of megasporophylls, but nevertheless we are surprised at its wide separation fromE. horridus. Vegetatively, these two species can be very similar, both having abbreviated stems and heavily glaucous and lobed fronds. These results confirm that the two species are quite distinct.
Encephalartos latifrons, in all the phenograms, occupies unexpected positions relative toE. arenariusandE. longifolius. Its cone morphology (see above underE. longifolius) supports its grouping withE. trispinosus, E. longifolius,andE. princeps. The surprise is that it lies so far fromE. arenarius, which it vegetatively resembles to a marked degree, even though the cones of the two species are quite different. It is also surprising that it lies so far fromE. longifoliuswhich it resembles by its thick and long trunk, recurved green leaves, drawn-out microsporophylls, and warty exposed faces of the megasporophylls. Encephalartos longifolius lacks the pungently lobed leaflets of E. latifrons, and occasionally heavily lobed leaflets are suspected to be indicative of past hybridisation withE. horridus.
Encephalartos princepsoccupies a position basal toE. trispinosusandE. latifrons
morphology of the cones of these two species. Its varying positions in Fig. 2 raises the question of whether its phylogenetic affinities lie at all with the other species. Indeed, it is dissimilar to all the other species studied. It occurs further northwards than any of the other species, its well-developed trunk is more slender compared to the often massive trunks of the others, it has far narrower and softer textured leaflets (likeE. lehmanniipractically edentate though not pungent), and it habitually bears more than one cone per stem.
3.2. DNA sequence analyses
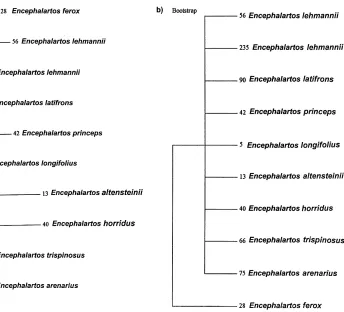
UsingE. feroxas outgroup, phylogeny reconstructions from rbcL and ITS 1&2 DNA sequences (Appendix A) produced almost identical tree topologies,
independent of the method employed (MP, NJ or MLE). In Fig. 3, respective phylograms and cladograms for MP (Fig. 3 a, c) and NJ bootstrap (Fig. 3 b, d) trees are illustrated. Because rbcL- and nuclear ITS DNA produced similar trees, it indicates that data are not distorted by past hybridisation and reticulate evolution. Two clusters are evident: E. altensteinii and E. princeps cluster together as sibling species, and form a sister group toE. arenarius, E. horridus,E. latifrons,E. lehmannii,
E. longifolius, and E.trispinosus which show no interspecific sequence variation. A single parsimony-informative character separates both groups of species, and genetic distances (p-distance) between both groups were 0.12–0.47% for ITS and 0.08– 0.16% forrbcL DNA (Table 7).
The rbcL tree resolves into three groups (Fig. 3a). The group comprising
E. altensteinii is supported by morphological evidence. The group comprising
E. princeps is to a far lesser extent supported by morphological evidence, but geographical evidence lends credibility to its separation, presumably reflecting
longer genetic isolation than between species of the main group. The third (main) group comprisingE. trispinosus, E. arenarius, E. longifolius, E. horridus, E. lehmannii
and E. latifrons shows no further resolution, confirming morphological and geographical evidence that these species form a close group, with species equally well defined.
The ITS tree (Fig. 3c) which should provide a better resolution than cpDNA sequences also separates E. altensteinii and E. princeps from the other species.
Encephalartos altensteinii and E. latifrons are well defined, as indicated by the relatively long branches on which they are situated, in contrast to E. lehmannii, E. trispinosus, E. horridus,andE. arenarius.
Encephalartos horridus has a fairly wide geographical distribution over which some genetic if not morphological variation could be expected, but plants from different origins had identical DNA sequences. Genetically, the species analysed are closely related. Using rbcL data, E. altensteinii and E. princeps show a genetic distance of 0.16–0.08% to the other Encephalartos species. For rbcL data we derived a calibration of 1% sequence divergence equalling 28 million years (Treutlein, 1998). Using this crude estimate, we can assume that divergence of the species studied started approximately 4–2 million years ago in the Late Pliozene/ Early Pleistocene.
4. Conclusions
Encephalartos ferox, selected as outgroup, is not closely related to any of the other species investigated. However, the allozyme and DNA sequence data implicate close and recent evolutionary relationships between the ingroup taxa, andE. altensteiniiis separated from the other Eastern Cape species studied by both allozyme and DNA data, as shown by its basal position in all the trees (Figs. 2 and 3).
Encephalartos arenarius, in spite of its very strong vegetative resemblance to
E. latifrons, and having rare vegetative characteristics in common with E. horridus
Table 7
Uncorrected pairwise distances between taxa; 1.0=100% divergence. Above diagonalrbcL; below diagonal: ITS 1&2
Species 1 2 3 4 5 6 7 8 9
and E. trispinosus, occupies a basal position relative to E. longifolius, E. horridus, E. lehmannii, E. trispinosus, E. latifrons and E. princeps in all the allozyme phenograms but not in the ITS and rbcL trees. From the allozyme data we conclude that it has the least recent evolutionary links to any of these species, and especially to those that it vegetatively most closely resembles.
Encephalartos longifolius also occupies a basal position in allozyme based trees relative toE. trispinosus, E. latifrons and E. princeps(Fig. 2) with which it shares conspicuously elongated apices to the microsporophylls and warty exposed faces of the megasporophylls.
Encephalartos horridusand E. lehmannii seem to be an offshoot of the previous group, rather than a separate lower branch. These two species are grouped close together in all the phenograms and DNA trees. We conclude that they are closely related, much closer than we previously suspected.
The grouping ofE. trispinosusandE. latifronsis surprising. Vegetatively, they are quite different, and the only resemblance to each other is the cone characteristics common to both as well as toE. longifoliusand E. princeps. The position of these species in all the phenograms does, however, confirm Dyer’s decision to recognise
E. arenariusas distinct from E. latifrons(Dyer, 1956), andE. trispinosusas distinct fromE. horridus(Dyer, 1965a).
The position ofE. princepsas basal to E. trispinosusandE. latifronsin allozyme analyses (Figs. 2a, c and e) agrees with the cone characteristics of these species. The grouping ofE. princepswithE. trispinosusin Figs. 2b and d probably does not reflect its true phylogenetic position, becauseE. princepsdeviates from the general pattern by its multiple cones, geographical distribution, and perhaps its somewhat softer-textured foliage. DNA data that placesE. princepsas a sister taxon toE. altensteinii conflicts between both data sets.
The genetic distance between these species is much smaller than normal for gymnosperms (Hamrick et al., 1979). The same was found in the Australian genus
Evidence of suspected past hybridization comprises phenomena like occasional heavily dentate leaflets in species with normally entire leaflets (likeE. longifoliusand
E. lehmannii), which can only be explained by former different climatic conditions which allowed species to occupy geographical ranges different from the present, allowing them to come into contact with each other. Recent origin of some species is suggested by the polymorphism of for instanceE. trispinosus.
The small genetic differences obtained in the present study are indicative of the close relationship between the species. The data confirm that, apart from
E. altensteinii, the morphologically similar species (the other ingroup taxa) in the Eastern Cape Province form a phylogenetically closely coherent group. Preliminary DNA amplification fingerprinting (DAF) results (Coetzer et al., unpublished results) indicate a similar grouping of the taxa as reported in Fig. 2e, and it supports the conclusions from the present study (i.e. little differentiation indicating recent speciation).
In conclusion, this is the first attempt at using morphological, allozyme and DNA sequence data to elucidate evolutionary relationships between these species of
Encephalartos, and although some meaningful relationships and recent speciation were noticed, it is obvious that much more data are needed before these complex relationships can be clarified satisfactorily.
Acknowledgements
We would like to thank Susan Myburg from the University of Pretoria and the curator of Kirstenbosch National Botanical Gardens for cycad samples.
Appendix A
(A)
rbcL
data
(B)
ITS
data
References
Avise, J.C., 1974. The systematic value of electrophoretic data. Syst. Zool. 23, 465–481.
Byrne, M., James, S.H., 1991. Genetic diversity in the cycadMacrozamia riedlei. Heredity 67, 35–39. Cavalli-Sforza, L.L., Edwards, A.W.F., 1967. Phylogenetic analysis: models and estimation procedures.
Evolution 21, 550–570.
Doyle, J.J., Doyle, J.L., 1990. Isolation of plant DNA from fresh tissue. Focus 12, 13–15.
Dyer, R.A., 1956. A new cycad [Encephalartos arenarius] from the Cape province. J. S. Afr. Bot. 22, 1–4. Dyer, R.A., 1965a. New species and notes on type specimens of South AfricanEncephalartos. J. S. Afr.
Bot. 31, 111–121.
Dyer, R.A., 1965b. The cycads of southern Africa. Bothalia 8, 405–515.
Ellstrand, N.C., Ornduff, R., Clegg, J.M., 1990. Genetic structure of the Australian cycad,Macrozamia communis(Zamiaceae). Amer. J. Bot. 77, 677–681.
Farris, J.S., 1972. Estimating phylogenetic trees from distance matrices. Am. Nat. 106, 645–668. Goncharenko, G.G., Padutov, V.E., Silin, A.E., 1992. Population structure, gene diversity and
differentiation in a natural population of Ceder pines (Pinussubsect.Cembae,Pinaceae) in SSR. Pl. Syst. Evol. 182, 121–134.
Gottlieb, L.D., 1981. Electrophoretic evidence and plant populations. In: Reinhold, L., Harborne, J.B., Swain, T. (Eds.), Progress in Phytochemistry. Pergamon Press, New York, pp. 1–46.
Hamrick, J.L., Mitton, J.B., Linhart, Y.B., 1979. Level of genetic variation in trees: influence of life history characteristics. In: Conke, M.T. (Ed.), Symposium on Isozymes of North American Forest Trees and Forest Insects, USDA Forest General Technical Report, pp. 35–41.
Kephart, S.R., 1990. Starch gel electrophoresis of plant isozymes: a comparative analysis of techniques. Am. J. Bot. 77, 693–712.
Markert, C.L., Faulhaber, I., 1965. Lactate dehydrogenase isozyme patterns of fish. J. Exp. Zool. 159, 319–332.
Nei, M., 1972. Genetic distance between populations. Am. Nat. 106, 283–292.
Nei, M., 1978. Estimation of average heterozygosity and genetic distance from a small number of individuals. Genetics 89, 583–590.
Nei, M., 1986. Definition and estimation of fixation indices. Evolution 40, 643–645.
Nei, M., Tajima, F., Tateno, Y., 1983. Accuracy of estimated phylogenetic trees from molecular data. J. Mol. Evol. 19, 153–170.
Norstog, K.J., Nicholls, T.J., 1997. The biology of the cycads. Ithaca, Cornell University Press. Oberprieler, R., 1995. The weevils (Coleoptera: Curculionoidea) associated with cycads 1 Classification,
relationships, and biology. In: Vorster, P. (Ed.), Proceedings of the Third International Conference on Cycad Biology. Stellenbosch, Cycad Society of South Africa, pp. 295–334.
Ota, T., 1993. DISPAN. Pennsylvania State University, Philadelphia.
Raymond, M., Rousset, F., 1995.GENEPOP(version 1.2): population genetics software for exact tests and ecumenicism. J. Hered. 86, 248–249.
Ridgway, G., Sherburne, S.W., Lewis, R.D., 1970. Polymorphism in the esterases of Atlantic herring. Trans. Amer. Fish. Soc. 99, 147–151.
Rogers, J.S., 1972. Measures of genetic similarity and genetic distance. Studies in Genetics, Univ. Texas Publ. Vol. 7213, pp. 145–153.
Shaklee, J.B., Tamaru, C.S., Waples, R.S., 1982. Speciation and evolution of marine fishes studied by electrophoretic analysis of proteins. Pac. Sci. 36, 141–157.
Sharma, I.K., Jones, D.L., Forster, P.I., Young, A.G., 1998a. Low isozymic differentiation among five species of theMacrozamia heteromeragroup (Zamiaceae). Biochem. Syst. Ecol. 27, 67–77.
Sharma, I.K., Jones, D.L., Forster, P.I., Young, A.G., 1998b. The extent and structure of genetic variation in theMacrozamia pauli-guilielmicomplex (Zamiaceae). Biochem. Syst. Ecol. 26, 45–54.
Swofford, D.L., 1991. PAUP: phylogenetic analysis using parsimony, version 3.1.1. Computer program distributed by the Illinois Natural History Survey. Champaign, IL.
Tang, W., 1990. Maturity in cycads. Encephalartos 24, 24–26.
Thorpe, J.P., 1982. The molecular clock hypothesis: biochemical evaluation, genetic differentiation and systematics. Annu. Rev. Ecol. Syst. 13, 139–168.
Thorpe, J.P., Sole´-Cava, A.M., 1994. The use of allozyme electrophoresis in invertebrate systematics. Zool. Scripta 23, 3–18.
Treutlein, J., 1998. Molekulare Phylogenie der Cycadeen Thesis (Diplom). University Heidelberg, Germany.
Van der Bank, F.H., Vorster, P., Van der Bank, M., 1998. Phylogenetic relationships, based on allozyme data, between six cycad taxa indigenous to South Africa. S. Afr. J. Bot. 64 (3), 182–188.
Vorster, P., 1986. Hybridization inEncephalartos. Excelsa 12, 101–106.
Vorster, P., 1993. Taxonomy ofEncephalartos(Zamiaceae): taxonomically useful external characteristics. In: Stevenson, D.W., Norstog, K.J. (Eds.), Proceedings of Cycad 90, the Second International Conference on Cycad Biology. Palm and Cycad Societies of Australia, Australia, Milton, pp. 294–299. Vorster, P., 1995. Aspects of the reproduction of cycads. 2. An annotated review of known information. In: Vorster, P. (Ed.), Proceedings of the Third International Conference on Cycad Biology. Cycad Society of South Africa, Stellenbosch, pp. 379–389.
Vorster, P., 1999. A review of the arborescent tropical species ofEncephalartos. In: Chen, C.J. (Ed.), Proceedings of the Fourth International Conference on Cycad Biology. International Academic Publishers, Beijing, pp. 87–91.
Walters, T.W., Decker-Walters, D.S., 1991. Patterns of allozyme diversity in the West Indies cycadZamia pumila(Zamiaceae). Am. J. Bot. 78, 436–445.
Ward, R.D., 1977. Relationships between enzyme heterozygosity and quaternary structure. Biochem. Genet. 15, 123–135.