‘‘VIRTUAL’’ EX PERIMENT
FOR UNDERSTANDING THE ELECTROCARDIOGRAM
AND THE MEAN ELECTRICAL AX IS
Jamie Anderson and Stephen E. DiCarlo
Depa rtm ent of Physiology, Wa yne Sta te University, School of Medicine, Detroit, Michiga n 48201
E
ducators have placed an emphasis on the development of laboratory materials that supplement the traditional lecture format. The laboratory materials should encourage active learning, small group discussion, and problem-solving skills. To this end, we developed a virtual experiment designed to introduce students to the theory and application of the electrocardiogram (ECG) and the mean electrical axis (MEA). After reviewing background material, the students will analyze ECG recordings from two individuals who underwent a series of experimental procedures. The students are challenged to reduce and analyze the data, calculate and plot the MEA, and answer questions related to the theory and application of the ECG. In conducting the virtual experiment, students are introduced to inquiry-based learning through experimentation.ADV PHYSIOL EDUC 23: 1–17, 2000.
Key words:active learning; problem solving; small group; education
Many students do not have the opportunity to engage in independent thinking, small group discussion, or active learning. Experimentation is an essential compo-nent to alleviate this limitation as well as promote critical thinking and effective learners. Furthermore, we have found that the most effective means by which physiology is learned is through active participation in laboratory experimentation and analysis (2, 3, 6). However, experimentation is often neglected in many curricula because of the scarcity of suitable laboratory equipment, space, experiments, and funds. To ad-dress this concern, we designed a virtual experiment for students to understand the theory and application of the electrocardiogram (ECG). The virtual experi-ment exposes students to experiexperi-mental design and procedures; however, the data are provided so that the results can be analyzed and discussed despite the lack of equipment. Furthermore, students gain informa-tion by analyzing and interpreting data, answering questions, and plotting graphs. The intent for students on completion of this experiment is to have an
understanding of the ECG, mean electrical axis (MEA), and positions and conditions that alter the MEA.
BACKGROUND
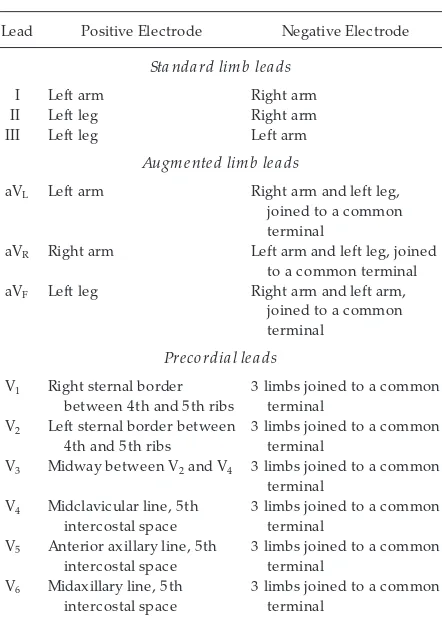
An ECG is a commonly used tool in medicine, rehabili-tation, and physiology to understand both the struc-ture and function of the heart. By definition, an ECG is a recording of the variations in voltage that are produced by depolarization and repolarization of the myocardium (muscle of the heart). The variations in voltage are measured at the surface of the body using surface electrodes. The standard ECG has 12 leads. The 12 leads are limb leads I, II, and III; augmented limb leads aVR, aVL, and aVF; and six precordial (chest)
leads V1, V2, V3, V4, V5, and V6. The standard limb leads
are bipolar, which means that they detect variations in electrical potential between two electrodes in the frontal plane of the body. The augmented limb leads and the precordial leads are unipolar. Unipolar leads measure the potential difference between one point of the body with respect to a second point, called the
I N N O V A T I O N S A N D I D E A S
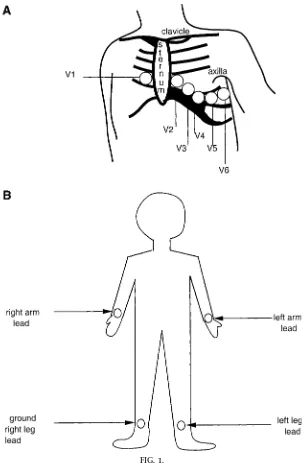
ground potential. The ground potential does not significantly differ from zero. Ten electrodes are placed on the surface of the body for the standard 12-lead ECG. The placement of the electrodes is presented in Fig. 1. Table 1 shows the placement of electrodes in terms of the positive and negative poles for each lead.
Each cell within the heart can be thought of as a dipole. Each cell can be considered a dipole because the polarity on the exterior surface of each cell changes from positive to negative as the wave of depolarization travels through the muscle of the heart. Because of the wave of depolarization, a boundary region is formed separating polarized, or positive, FIG. 1.
areas from depolarized, or negative, areas. Electrical potential at any point is dependent on the magnitude and spatial orientation of the dipole and the distance from the electrode. The ECG tracing is formed by the direction of the electrical potential over time rela-tive to the axis of the recording lead (see Fig. 2). If the dipole is parallel to the recording lead, then the deflection on the ECG tracing is maximal. If the dipole is perpendicular to the recording lead, then the deflection is zero. Thus the magnitude of the deflec-tion changes as the dipole rotates from parallel to perpendicular to parallel again about the recording lead. Understanding this concept will help the student understand the individual deflection on the ECG tracing. The flow of current is from the positive to the negative pole of the dipole. Electric current flows in both straight and circular routes. When all the cells, or dipoles, are added together, they form a vector. The magnitude and direction of the vector formed by summing the individual dipoles changes in three
dimensions during depolarization and repolarization because the heart and body are three-dimensional (see Fig. 3).
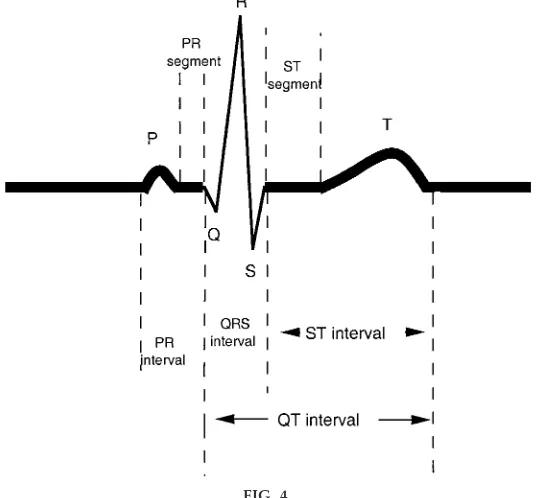
The ECG tracing is composed of several waves desig-nated P, Q, R, S, and T. The P wave represents TABLE 1
Position of positive and negative electr odes for each of the 12 leads
Lead Positive Electrode Negative Electrode
Sta nda rd lim b lea ds
I Left arm Right arm
II Left leg Right arm
III Left leg Left arm
Augm ented lim b lea ds
aVL Left arm Right arm and left leg,
joined to a common terminal
aVR Right arm Left arm and left leg, joined
to a common terminal
aVF Left leg Right arm and left arm,
joined to a common terminal
Precordia l lea ds
V1 Right sternal border
between 4th and 5th ribs
3 limbs joined to a common terminal
V2 Left sternal border between
4th and 5th ribs
3 limbs joined to a common terminal
V3 Midway between V2and V4 3 limbs joined to a common
terminal V4 Midclavicular line, 5th
intercostal space
3 limbs joined to a common terminal
V5 Anterior axillary line, 5th
intercostal space
3 limbs joined to a common terminal
V6 Midaxillary line, 5th
intercostal space
3 limbs joined to a common terminal
FIG. 2.
An ECG tracing is for med by the dir ection of the electrical potential over time r elative to the ax is of the r ecor ding lead, which is lead I in this ex ample. The initial vector (1) is in the negative dir ection and is at an D45° angle to lead I; thus the ECG tracing has an initial downwar d deflection. The vector r otates to a position parallel to lead I (2); thus the ECG tracing has a max imal negative deflection. At 3, the vector is still in the negative dir ection but no longer parallel to lead I; thus the ECG tracing is less negative. At 4, the vector is perpendicular to lead I; thus the ECG tracing is now at zer o. Students ar e challenged to use these concepts to ex plain deflection on the ECG tracing r elative to the magnitude and dir ection of the dipole to lead I.
depolarization of the atria. The P wave is a positive deflection in all leads except aVRin a tracing from a
normal heart. Waves Q, R, and S form a complex (QRS), which represents depolarization of the ven-tricles. The Q wave is the first negative deflection after the P wave. The T wave represents repolarization of the ventricles. A segment is a time in which no wave occurs on the ECG tracing, such as the P-R segment, which begins after the P wave and ends before the start of the QRS complex. An interval, on the other hand, includes both a wave and the baseline period between waves. For example, the P-R interval is from the beginning of the P wave to the beginning of the QRS complex. Figure 4 presents an ECG tracing and its segments and intervals. Using Fig. 5, students are challenged to draw the standard ECG tracing and answer questions related to its waves, segments, and intervals.
Although this experiment is not designed to include interpretations of abnormal ECG tracings, a brief description of the components to ‘‘look for’’ will be addressed. The first component the students should determine is the rate. The students should ask, ‘‘Is the rate normal (60–80 tracings/min), fast (.100 tracings/ min; tachycardia), or slow (,50 tracings/min; brady-FIG. 3.
Magnitude and dir ection of vector [mean electrical ax is (MEA)] for med by summing individual dipole changes in 3 dimensions during depolarization and r epolarization. These changes ar e due to the or der in which the heart is depolarized and r epolarized and because the heart and body ar e 3 dimensional. The heart depolarizes in the following or der:1) sinoatrial node (SA node),2) atria,3) atrioventricular node (AV node),4) atrioventricular bundle (bundle of His), 5) bundle branches, and6) Purkinje fibers.
FIG. 4.
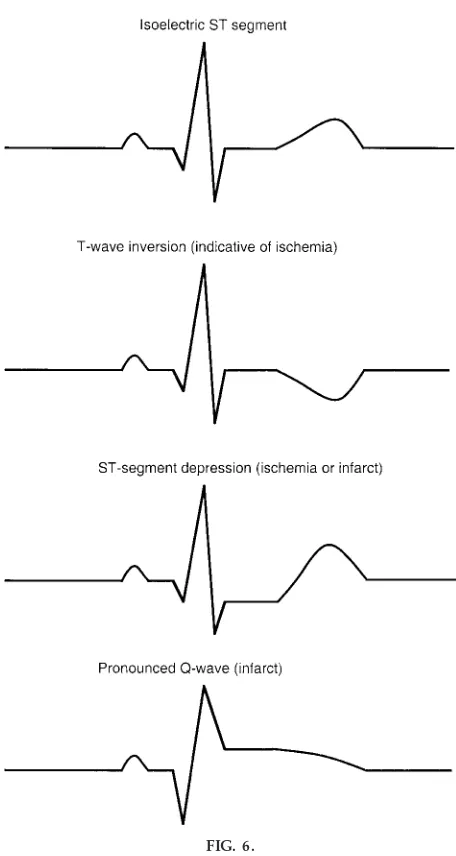
cardia)?’’ The students should determine whether the rhythm is regular, i.e., ‘‘Is the time interval between complexes regular?’’ The students should also check to be sure that a P wave precedes each QRS complex and that the P-R interval is fixed (120–200 ms). The students should examine the QRS complex to deter-mine its shape and duration. All the QRS complexes should have the same shape. Finally, the students should look at the S-T segment and T wave. The students should note whether the S-T segment is isoelectric, elevated, or depressed and whether the T wave is upright or inverted. Figure 6 presents ex-amples of normal and abnormal ECG tracings.
The mean electrical axis (MEA) is the average of all the instantaneous vectors that are generated as the ventricles depolarize. The MEA is a good indicator of the main direction of electrical activity in the frontal plane. The direction and magnitude of the
MEA can be obtained from the standard limb leads and from the projection of the MEA on the frontal plane. The steps in computing the MEA are as follows:1) the students should calculate the net height of the QRS complex by summing the Q, R, and S waves in the complex for one of the standard limb leads; 2) the students should then plot the net deflection on the coordinate system and draw a perpendicular line through the axis;3) the students should repeat these procedures for a second limb lead, and finally,4) the students should draw a line from the origin to the point at which the two perpendicular lines crossed. See Fig. 7 for the MEA reference axis and an example calculation. The magnitude of the line drawn is called the MEA of the ECG. The direction of the vector is measured in degrees from the left horizontal axis. The left horizontal axis refers to the left side of the heart, which is on the right side when the heart is viewed from the anterior side. An angle formed in the clock-FIG. 5.
Puzzle and questions designed to challenge students to draw a standar d ECG tracing and answer questions r elated to its waves, segments, and intervals.
wise direction is positive, whereas one formed in the counterclockwise direction is negative. The MEAof the normal heart is,60 degrees, but the normal range is from
0 to 90 degrees plus or minus 20 degrees (7).
PROCEDURE
Data used in this experiment were obtained from two subjects. One subject was female, and the other was male. The female is 180.3 cm in height and 68 kg in
body weight. The male is 177.8 cm in height and 79.4 kilograms in body weight. To record the ECG, each subject removed his or her shirt and was positioned on a flat surface in the supine position. An alcohol swab was used to clean each area where an electrode was placed. Cleaning the area reduced the resistance and improved the quality of the recording. The electrodes were placed in the following order:1) right and left wrist (on the pulse point), 2) right and left ankle (on the medial surface), 3) V1, 4) V2, 5) V4, 6)
V3,7) V5, and8) V6. Table 1 and Fig. 1 serve as guides
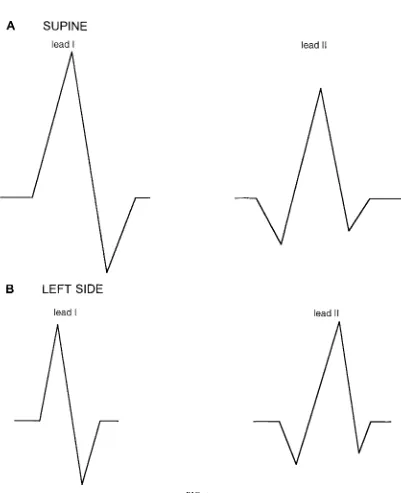
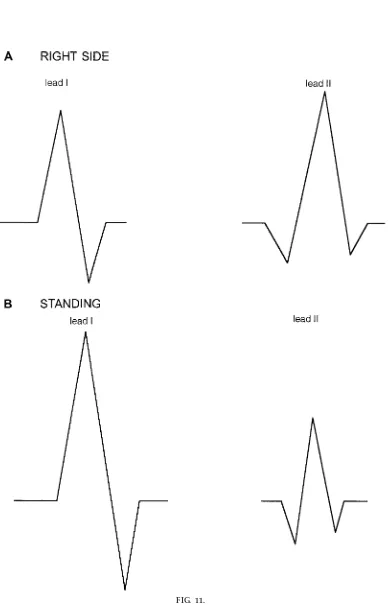
for electrode placement. The leads that corresponded to the electrode placement were attached, and the subject laid steady for 2 min to get accustomed to the situation. Subsequently, the ECG was obtained. Only the tracings for leads I and II were recorded. Traces of the ECG were obtained during the following posi-tions: 1) while the subjects were lying supine, 2) while each subject was lying on his or her left side,3) while each subject was lying on his or her right side, and4) while each subject was standing. A moment was allowed after each position change for the subject to respond to the change in body position before the ECG tracing was recorded. Figures 8 and 9 present the results for the above procedure for the female subject. Figures 10 and 11 present the results for the male subject, who had a myocardial infarct 8 yr before the present ECG.
QUESTIONS
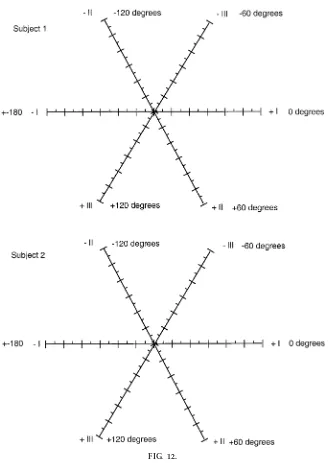
1) Calculate the MEA for both subjects from the tracings provided in Figs. 8–11. Plot the MEAs for each subject on the MEA reference axes provided in Fig. 12.
FIG. 6.
Ex ample of 1 nor mal (isoelectric) ECG tracing and 3
abnor mal ECG tracings. FIG. 7.
Sample ECG tracings for leads I and II (A), showing students how to use the QRS complex of the ECG tracing and the MEA r efer ence ax is (B) to calculate the MEA. Students should calculate net height of the QRS complex by summing the Q, R, and S waves. For lead I, the sum equals12, wher eas for lead II, the sum equals
FIG. 7.
FIG. 8.
FIG. 9.
ECG tracings for leads I and II forsubject 1while lying on right side (A) and while standing (B).
2) In which direction does the MEA from a sub-ject lying on the left side shift compared with the MEA from a subject in the supine position? In which direction does the MEA from a subject lying on the right side shift? If a shift occurred, please explain
the results. Was the response the same for both individ-uals?
3) In which direction does the MEA from a subject who is standing shift compared with the MEA from a FIG. 10.
FIG. 11.
ECG tracings for leads I and II forsubject 2while lying on right side (A) and while standing (B).
subject in the supine position? Is the response the same for both subjects?
4) On the basis of the comparison of the two subjects’ MEAs, can you determine the location ofsubject 2’s myocardial infarct?
5) What does an MEA of greater than 190 degrees indicate?
6) What does an MEA of less than 230 degrees indicate?
7) Is the position of the heart in the thorax important in attempting to determine the MEA?
8) Do you think pregnancy affects the MEA? If yes, how?
FIG. 12.
9) How do high altitude, carbon monoxide, age, and sex affect the MEA?
10) Why do you think the MEA is commonly used to diagnose right ventricular hypertrophy?
11) How does gastric distension affect the MEA and why?
12) Would an elite endurance athlete have a normal MEA, or would it be shifted? If it is shifted, in what direction would the shift be?
13) In summary, a problem such as dead tissue on the left side of the heart would cause a shift of the MEA in what direction? A similar problem on the right side of the heart will cause what type of shift?
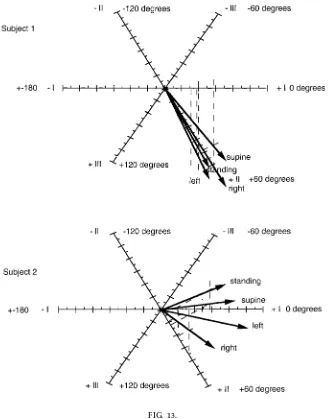
FIG. 13.
MEA plots for both subjects (answers toquestion 1).
14) In summary, an increase in mass on the left side of the heart will cause a shift in which direction? An increase in mass on the right side of the heart will cause a shift in which direction?
ANSWERS
1) The MEAs for both subjects were calculated from data below, taken from tracings in Figs. 8–11.
Subject 1 Subject 2
See Fig. 13 for plots of the MEA for both subjects in each position. Remember that the placement of your vectors may vary slightly from that shown in Fig. 13.
2) The MEA from a subject lying on the left side is shifted to the right compared with the MEA from a supine subject. This is not the expected answer. In some people the shift would be to the left. In a person with a large thoracic cavity there is room for the heart to shift to the left when the individual lies on his left side, which explains a shift of the MEA to the left. In a person with a smaller rib cage, such as both subjects
in this experiment, the heart would shift to the right. The reasoning behind this is that when a person is lying on a firm surface, the rib cage is compressed on the left side (when lying on that side), which pushes the heart to the right if the thoracic cavity is small. This would result in a shift of the MEA to the right, as occurred with both subjects in this experiment. It is important to consider the distribution of weight on the body. Althoughsubject 2weighs more, the extra weight is on the abdominal area and is not caused by a large chest cavity. The MEA shifts to the right when the subject is lying on the right side. This is due to the shift of the heart to the right in the thorax. The rightward shift that occurred after lying on the left side was of similar magnitude for the two subjects. The rightward shift that occurred after lying on the right side was much greater in subject 2’s MEA compared with that ofsubject 1.
3) The MEA for subject 1 shifted to the right on standing. The MEA for subject 2, on the other hand, shifted to the left after standing. The reason why subject 1’s MEA shifted to the right on standing is due to the pull from gravity. The reason for the leftward shift insubject 2’s MEA on standing is unclear.
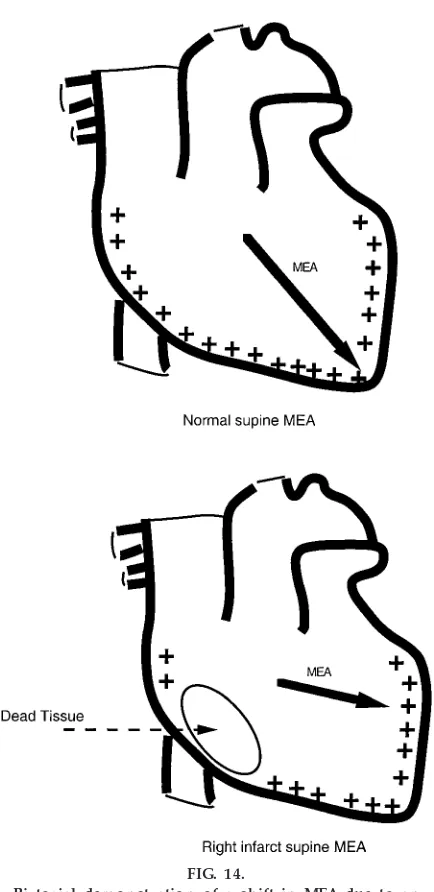
4) Because of the leftward shift in the supine MEA, the infarct most likely occurred on the right side of the heart. The supine MEA is the one used to help diagnose problems or compare MEAs. This is because the supine position is the standard position for calcu-lating the MEA. The infarct area is dead, meaning it has no electrical activity. If one area of the heart has no electrical activity, then the other areas of the heart with electrical activity will have greater influence on the MEA. Because the shift was to the left, there is greater influence from the left side of the heart, meaning that the right side must be the infarct site where some of the heart is dead (no electrical activity). See Fig. 14 for a pictorial demonstration of this concept.
shift in the direction the block is on. This is because with bundle branch block the side that has the block remains polarized longer, and thus the positive charge is still present.
6) If there is left-axis deviation there could be left ventricular hypertrophy (more positive charge on the left side), a left bundle conduction problem, left bundle branch block, inferior myocardial infarct,
hy-pertension (left ventricular hypertrophy), or left ante-rior hemiblock.
7) Yes, the position of the heart in the thorax is important in determining the MEA. A shift in the position of the heart in the thorax can lead to a change in the mean direction of electrical activity in the heart. Figure 15 presents a demonstration of this concept.
8) Yes, in the later stages of pregnancy the MEA is shifted to the left. With pregnancy the internal organs are moved from their normal position to accommo-date the fetus. This causes the organs from the abdomen to push the diaphragm up and consequently push the heart up. Because of the orientation of the heart in the thoracic cavity, pressure from the inferior side causes the heart to move up and to the left. This shift in heart position leads to the leftward shift in the MEA (5).
9) High altitude causes a rightward shift in the MEA, whereas carbon monoxide (1) and age cause a left-ward shift. Sex has no effect on the MEA; men and women of the same height and weight have compa-rable MEAs. High altitude shifts the MEA to the right because at high altitude atmospheric pressure is low, resulting in a lack of compression on the thoracic cavity. This leads to an increase in thoracic cavity space, so the heart shifts to the right. Age shifts the MEA to the left because with age there is often mild hypertrophy of the left side of the heart.
10) With an increase in right ventricular size, the MEA shifts to the right because of the greater number of electrical impulses and greater mass on the right side. Thus an MEA that is shifted to the right may signify right ventricular hypertrophy. This would be a nonin-vasive, easy first test to perform.
11) Gastric distension would shift the MEA to the left (4). This would be caused by a shift in the orientation of the heart in the thorax due to pressure from the inferior side. Because of the pressure and the way the heart is shaped, the heart would be pushed up and to the left, explaining the left shift in the MEA. This is the same logic used to explain the shift during pregnancy. FIG. 14.
Pictorial demonstration of a shift in MEA due to an infar ct (answer toquestion 4).
12) An endurance athlete would have a natural shift in the MEA. The athlete’s heart, like the other muscles in his or her body, is increased in size. The majority of the increase is in left ventricular size, thus causing a leftward shift in the MEA.
13) An infarct on the left side would cause a shift to the right, whereas an infarct on the right side would cause a shift to the left.
14) An increase in mass on the left side of the heart would cause a shift to the left, whereas an increase in mass on the right side of the heart would cause a shift to the right.
DISCUSSION
The educational materials presented in this virtual laboratory are intended for the instructor, who may select specific concepts or the entire experience for FIG. 15.
his or her individual educational needs. We present a step-by-step process for teaching this specific topic as well as numerous experimental manipulations and examples; the instructors are encouraged to modify the procedures and select the manipulations in a way that will enhance their students’ understanding.
Our goal in creating this virtual laboratory was to increase students’ understanding of the ECG and the MEA and to expose students to active learning through inquiry-based experiments. By reducing ECG data, plotting figures, and answering questions, students gain experience with experimental design, data analysis, and interpretation. The virtual experiment was designed for educational programs in which equipment, funding, or time limitations prevent the actual collection of data. Other than the actual collection of data, all components of experimentation are included in this exercise.
Traditional learning is undergoing a transformation in the classroom. Educators are challenged to design curricula that include a thorough background, pre-sented in a manner that contributes to the develop-ment of critical thinkers and problem solvers. Stu-dents must be able to apply a scientific knowledge base to analyze needs and solve problems. To achieve this goal, students must be taught in a manner that fosters analytical thought processes. To develop inde-pendent critical thinking skills, educational materials must require the students’ active involvement and encourage them to take responsibility for their educa-tion. The question-and-answer sections of this virtual laboratory were designed to promote critical thinking and enhance problem-solving skills. Although this section includes numerous examples, instructors are encouraged to select examples that will enhance their students’ understanding.
This laboratory experience works best when students discuss their findings and interpretations. Thus we suggest that the laboratory be used as a class discus-sion project. In this format students could work in groups and subsequently discuss their findings and the answers with the entire class. This discussion should generate new thoughts and ideas as well as possible new directions for future projects. We, as educators, often place an overemphasis on technical rationality or the technical knowledge base of a discipline. Consequently, students are not always
prepared to handle situations that require more than just technical knowledge to solve problems. In this setting, students became technical problem solvers instead of critical thinkers. Technical problem solvers are not capable of making decisions in ambiguous settings. Educators share a goal of transforming stu-dents from technical problem solvers to critical think-ers. To help achieve this goal, we used ECGs obtained from actual individuals, not ‘‘textbook’’ examples. We did this because, in reality, a wide range of responses can occur in a ‘‘normal’’ person. We took advantage of this idea in that the results of the present study are not always the typical responses. Using atypical results may help the student deal with ambiguous findings (findings they will encounter in the real world) and increase the level of discussion. However, this ap-proach will only be valuable when used for learning and not for grading purposes. This is because frustra-tion often occurs if the student does not get the right answer when he or she is fearful of the grade.
In summary, a virtual experiment designed to intro-duce students to inquiry-based learning through experi-ment was presented. Using this approach, students may develop critical thinking skills and become true problem solvers.
Address for reprint requests and other correspondence: S. E. DiCarlo, Dept. of Physiology, Wayne State Univ. School of Medicine, 540 East Canfield Ave., Detroit, MI 48201 (E-mail: sdicarlo@med. wayne.edu).
Received 22 January 1999; accepted in final form 1 March 2000.
Refer ences
1. Cooper R, McGrath JJ, Dooley S, and Kopetzky MT.Chronic exposure to carbon monoxide at high altitude: effects on MEA.
Physiol Beha v46: 75–79, 1989.
2. DiCarlo SE and Rosian RL.Experiments a nd Demonstra tions in Physica l Thera py. Upper Saddle River, NJ: Prentice Hall, 1999. 3. DiCarlo SE, Sipe E, Layshock SP, and Rosian RL.
Experi-m ents a nd DeExperi-m onstra tions in Physiology. Upper Saddle River, NJ: Prentice Hall, 1998.
4. Duke M.Positional effects of gastric distention upon the MEA of the QRS complex of the ECG.Va sc Dis2: 161–167, 1965. 5. Mameli P, Giraudi D, Vir dis A, Firinu C, Marini S, and
Marr osu P.Determination of the range of physiologic variation of the electrical axes using P, QRS, and T waves in pregnancy.
Boll Soc Ita l Biol Sper65: 391–398, 1989.
6. Richar dson D.Active learning: a personal view.Am J Physiol Adv Physiol Educ265 : S79–S80, 1993.
7. Rowland DJ.Electrocardiography: the electrical axis.Br J Hosp Med19: 472–481, 1978.