www.elsevier.com / locate / bres
Short communication
Corticofugal inhibition compresses all types of rate-intensity functions
of inferior collicular neurons in the big brown bat
*
Xiaoming Zhou, Philip H.-S. Jen
Division of Biological Sciences, University of Missouri, Columbia, MO 65211, USA Accepted 2 August 2000
Abstract
Recent studies have shown that the auditory corticofugal system modulates and improves signal processing in the frequency, time and spatial domains. In this study, we examine corticofugal modulation of rate-intensity functions of inferior collicular (IC) neurons of the big brown bat, Eptesicus fuscus, by electrical stimulation in the primary auditory cortex (AC). Cortical electrical stimulation compressed all types of rate-intensity functions so as to increase the slope but decrease the dynamic range of IC neurons. Cortical electrical stimulation also shifts the responsive intensity of IC neurons to higher levels. These data indicate that corticofugal modulation also improves subcortical signal processing in intensity domain. The implication of these findings to bat echolocation is discussed. 2000 Elsevier Science B.V. All rights reserved.
Theme: Sensory systems
Topic: Auditory systems: central physiology
Keywords: Bat; Corticofugal modulation; Inferior colliculus; Intensity-coding; Dynamic range
The processing of auditory information carried by frequency (same tonotopic value) or to a different fre-complex sounds has been explained by neural interactions quency than the corresponding cortical site.
based on divergent and convergent projections within the While corticofugal modulation decreases the auditory ascending auditory system, but without considering the sensitivity of corticofugally-inhibited IC neurons contribution of the descending (corticofugal) auditory [12,21,22], how this corticofugal inhibition may modulate system [19]. However, recent studies in bats have shown the rate-intensity functions and thus the intensity sensitivi-that the massive corticofugal system, which is topographi- ty has not been examined. We addressed this question by cally as well organized as the ascending system studying corticofugal modulation of rate-intensity function [1,2,8,9,17], extensively adjusts and improves subcortical of corticofugally-inhibited IC neurons in the big brown auditory signal processing in the frequency, time and bat, Eptesicus fuscus, under free field stimulation con-spatial domains [6,11,12,21–27]. These studies showed ditions. We found that corticofugal modulation compressed that the bat’s auditory cortex (AC) targets specific sites in all types of rate-intensity functions of IC neurons resulting the inferior colliculus (IC) with either transient, well- in decreasing the dynamic range, increasing the sharpness focused excitation or transient, broadly distributed inhibi- of the monotonically linear portion of the rate-intensity tion depending on whether that site is tuned to the same function, and shifting the responsive intensity to higher levels. This modulation of rate-intensity functions may improve the analysis of echo intensity during the final phase of hunting.
Abbreviations: BF, best frequency; DR, dynamic range; IC, inferior Surgical procedures and the experimental set-up were
colliculus; MT, minimum threshold
basically the same as in a previous study [13]. Briefly, 1 or
*Corresponding author. Tel.: 11-573-882-7479; fax: 1
1-573-884-2 days before the recording session, a 1.8-cm nail was
5020.
E-mail address: [email protected] (P.H.-S. Jen). glued onto the exposed skull of each of 11
anesthetized (45–50 mg / kg b.w.) bats (b.w. 18–24 g). the rate-intensity function obtained before and during AC During recording, each bat was administered the neuro- stimulation.
leptanalgesic Innovar-Vet (0.08 mg / kg b.w. of fentanyl, 4 Recorded action potentials were amplified with conven-mg / kg b.w. of droperidol) and was tied to an aluminum tional techniques and sent to a computer (Gateway 2000, plate inside a double-wall, sound-proof room (temperature
28–308C). After fixing the head with a set screw, small holes were bored in the skull above the primary auditory cortex (AC) and the inferior colliculus (IC) for insertion of electrodes. An indifferent electrode (silver wire) was placed at the nearby temporal muscles.
Acoustic stimuli (4 ms with 0.5 ms rise-decay times at 2 pps) were generated with an oscillator (KH model 1200) and a homemade electronic switch. These stimuli were then amplified after passing through a decade attenuator (HP 350D) before they were fed to a small condenser loudspeaker (AKG model CK 50, 1.5 cm diameter, 1.2 g) that was placed 23.5 cm away from the bat. The
loud-¨
speaker was calibrated with a Bruel & Kjaer 1 / 4 inch (4135) microphone placed at the bat’s ear. The output was expressed in dB SPL in reference to 20 mPa root mean square.
During experiments, sound pulses were delivered from the loudspeaker placed at 408contralateral to the recording site. A 3 M KCl glass micropipette electrode (diameter: 1
mm, impedance 5–10 MV) was used to isolate acoustically evoked IC neurons. The best frequency (BF) and minimum threshold (MT) of each isolated IC neuron were de-termined by systematically changing the frequency and intensity of sound pulses. At the MT, the neuron, on average, responded with 50% probability to BF pulses. A custom-made two tungsten-in-glass electrodes (tip: ,10
mm, inter-tip distance: 30–50 mm) [12] was inserted into the AC at depths of 600–700mm (the 5th layer of the AC) [14]. The responses of the IC neuron to BF sounds (at 10 dB above the MT) were then examined with electrical stimulation (4 ms train stimulus consisting of four mono-phasic pulses of 0.1 ms) in the AC (hereafter referred to as AC stimulation).
When responses of the IC neuron were not affected by AC stimulation, the neuron was abandoned. When re-sponses of IC neurons were affected by AC stimulation, the interval between electrical and sound stimuli was adjusted (1–6 ms, mostly 1–3 ms) to produce at least 20%
Fig. 1. Three different types of rate-intensity functions obtained from IC
corticofugal effect in terms of number of impulses. At this
neurons of the big brown bat, Eptesicus fuscus. (A) Monotonic: a
interstimulus interval, the electrical current (5–50 mA, neuron’s number of impulses increased monotonically with stimulus mostly 5–25 mA) that produced 30–50% corticofugal intensity. (B) Saturated: a neuron’s number of impulses increased with
effect was chosen for subsequent experiments. stimulus intensity to a maximum and did not change more than 25% thereafter (indicated by 25% horizontal dashed line). (C) Non-monotonic:
To study corticofugal modulation of intensity sensitivity
a neuron’s number of impulses increased with stimulus intensity to a
of each IC neuron, the neuron’s number of impulses was
maximum and decreased more than 25% thereafter. The dynamic range
recorded with BF sounds delivered at 10 dB increments (DR) of each rate-intensity function was determined according to the above the MT before, during and after AC stimulation. A intensity range corresponding to the number of impulses that was 10%
rate-intensity function was then obtained by plotting the below the maximum and 10% above the minimum (indicated by dotted lines). The slope (% / dB) of the rate-intensity function was obtained by
number of impulses against the stimulus intensity for each
dividing the change in the number of impulses in percent within the DR
stimulation condition. The effect of corticofugal
modula-by the DR (e.g. between filled arrow heads in A). The best frequency (BF,
tion on the neuron’s intensity sensitivity was then ex- kHz), minimum threshold (MT, dB SPL), recording depth (mm) and amined by comparing the width and shift in dynamic range latency (ms) of these three neurons were 59.6, 30, 1399, 14 (A); 32.0, 22,
486) for acquisition of peri-stimulus-time (PST) histo- We examined corticofugal modulation of intensity sen-grams (bin width: 500ms, sampling period: 100 ms) of the sitivity of IC neurons by measuring the variations in the neuron’s responses to 32 stimuli. The total number of width and shift in the dynamic range, as well as the slope impulses in each histogram was used to quantify the of each neuron’s rate-intensity function resulting from AC neuron’s response under each stimulation condition. stimulation. The dynamic range of each rate-intensity Corticofugal modulation of rate-intensity functions of 31 function was determined according to the intensity range corticofugally-inhibited IC neurons was studied. All these corresponding to the number of impulses that was 10% neurons discharged 3–5 impulses to presented sounds. below the maximum and 10% above the minimum (Fig. According to variation in the number of impulses with 1A–C, DR). The slope of the rate-intensity function was stimulus intensity, they had three types of rate-intensity obtained by dividing the percent change in the number of functions that differed as follows: (1) monotonic (n58, impulses within the dynamic range by the dynamic range 26%): a neuron’s number of impulses monotonically and expressed in % / dB (e.g. Fig. 1A between filled arrow increased with stimulus intensity (Fig. 1A). (2) Saturated heads). The slope is an indication of a neuron’s sensitivity (n512, 39%): a neuron’s number of impulses increased to variation in stimulus intensity. Thus a large (sharp) with stimulus intensity to a maximum and did not change slope represents a high sensitivity to variation in stimulus more than 25% thereafter (Fig. 1B). (3) Non-monotonic intensity.
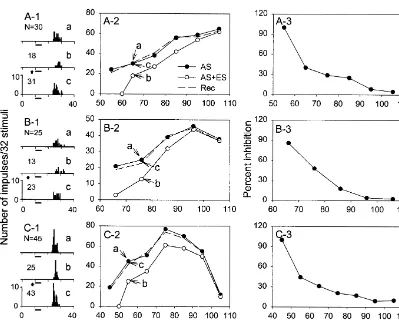
(n511, 35%): a neuron’s number of impulses increased Fig. 2A-1, B-1, C-1 show the PST histograms of three with stimulus intensity to a maximum and decreased more representative IC neurons that were obtained with BF than 25% thereafter (Fig. 1C). sounds delivered at 10 dB above the MT of each neuron
before (a), during (b), and after (c) AC stimulation. The These data also show that IC neurons with non-monotonic number of impulses of all three neurons greatly decreased rate-intensity functions had the smallest dynamic range and during AC stimulation but recovered instantly after AC largest slope while neurons with monotonic rate-intensity stimulation. Fig. 2A-2, B-2, C-2 show their rate-intensity functions had the largest dynamic range and smallest functions that were obtained before (filled circles), during slope. The dynamic range and slope of the neurons with (unfilled circles) and after (dashed) AC stimulation. In all saturated rate-intensity functions had intermediate values. three neurons, the rate-intensity functions obtained before Repeated measure one-way ANOVA indicated that the and after AC stimulation were essentially congruent (Fig. dynamic range and slope of these three types of IC neurons 2A-2, B-2, C-2, a vs. c). However, the rate-intensity were significantly different whether obtained before or functions obtained before and during AC stimulation were during AC stimulation (P,0.005).
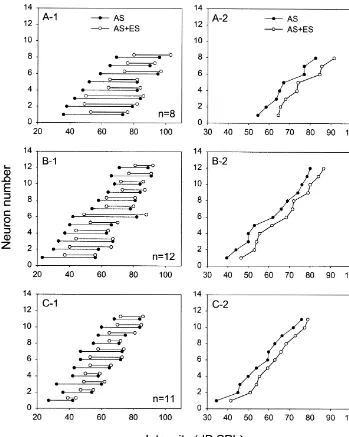
different, and the difference was larger at low sound Fig. 3A-1, B-1, C-1 show the intensity level that intensities than at high sound intensities (Fig. 2A-2, B-2, corresponds to the dynamic range of all three types of C-2, a vs. b). This observation indicates that the dynamic rate-intensity functions obtained before (filled circles) and range and slope of the rate-intensity function obtained during (unfilled circles) AC stimulation. It is clear that the before and during AC stimulation were different. This dynamic range of all three types of rate-intensity functions observation also indicates that corticofugal inhibition was became smaller and shifted to higher intensity levels more effective at low than at high sound intensities, similar during AC stimulation. This shifting of the dynamic range to previous studies [6,12]. We calculated the effectiveness mainly took place at the low end of the dynamic range. To of corticofugal inhibition in percent by dividing the highlight the change in the dynamic range of IC neurons as difference in the number of impulses due to AC stimula- a result of AC stimulation, we connected the midpoints of tion by the number of impulses obtained before AC all dynamic ranges of IC neurons determined before and stimulation. This calculation showed that percent inhibition during AC stimulation and produced a middle dynamic reduced sharply with sound intensity within 20–30 dB range curve for each stimulation condition. As shown in above the MT before reaching a plateau level at still higher Fig. 3A-2, B-2, C-2, the middle dynamic range curves of intensities (Fig. 2A-3, B-3, C-3). all three types of rate-intensity functions shifted from low
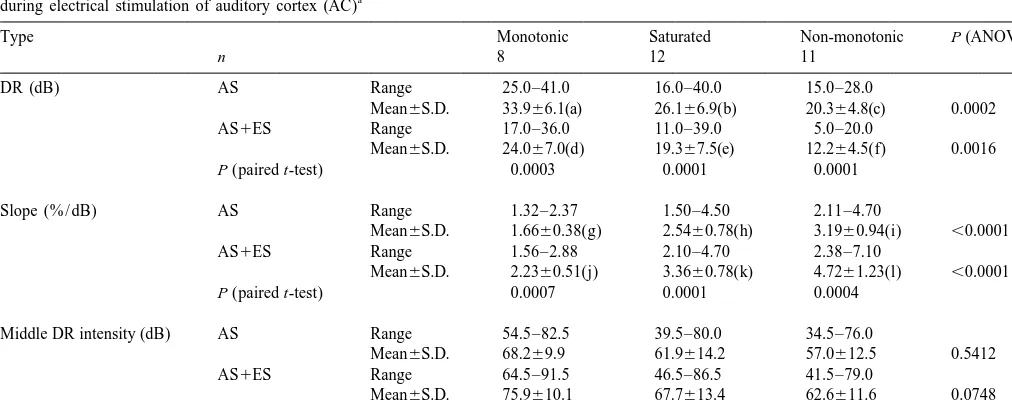
Table 1 shows that the average dynamic range (top row) to high intensity levels during AC stimulation.
of all three types of rate-intensity functions significantly Table 1 indicates that AC stimulation shifted signifi-decreased and the slope (middle row) significantly in- cantly the middle dynamic range intensity (i.e. the intensi-creased, during AC stimulation (paired t-test, P,0.005). ty that corresponds to middle dynamic range) of all IC
Table 1
The dynamic range (DR), slope and middle DR intensity of three types of rate-intensity functions obtained from inferior collicular (IC) neurons before and a
Slope (% / dB) AS Range 1.32–2.37 1.50–4.50 2.11–4.70
Mean6S.D. 1.6660.38(g) 2.5460.78(h) 3.1960.94(i) ,0.0001
AS1ES Range 1.56–2.88 2.10–4.70 2.38–7.10
Mean6S.D. 2.2360.51(j) 3.3660.78(k) 4.7261.23(l) ,0.0001
P (paired t-test) 0.0007 0.0001 0.0004
Middle DR intensity (dB) AS Range 54.5–82.5 39.5–80.0 34.5–76.0
Mean6S.D. 68.269.9 61.9614.2 57.0612.5 0.5412
AS1ES Range 64.5–91.5 46.5–86.5 41.5–79.0
Mean6S.D. 75.9610.1 67.7613.4 62.6611.6 0.0748
P (paired t-test) ,0.0001 ,0.0001 ,0.0001 a
Fig. 3. (A-1, B-1, C-1) Distribution of the dynamic ranges of three types of IC neurons (A-1, monotonic; B-1, saturated; C-1, non-monotonic) determined before (filled circles) and during (unfilled circles) AC stimulation. Note that the change in dynamic range was larger at the low than at high intensity end. (A-2, B-2, C-2) The middle dynamic range intensity of all three types of IC neurons obtained before (filled circles) and during (unfilled circles) AC stimulation. These curves are generated by connecting the midpoints of the dynamic ranges of all IC neurons shown in A-1, B-1 and C-1. Note that these curves shift from left to right during AC stimulation.
neurons to higher intensity levels (Table 1, bottom row, middle dynamic range intensity among these three differ-paired t-test, P,0.005). However, AC stimulation did not ent groups of IC neurons (repeated measures one-way produce a significant difference in the shift of the middle ANOVA, P.0.01).
Table 2
a Distribution of percent change in DR, slope and middle DR intensity of three types of rate-intensity functions of all IC neurons due to AC stimulation
Type Monotonic Saturated Non-monotonic P
n 8 12 11
DR (dB) Range 12.2–43.3 2.5–44.0 5.9–66.7
Mean6S.D. 29.6612.3 26.5613.5 39.9619.4 0.1245
Slope (% / dB) Range 12.2–51.7 1.0–71.6 4.0–91.7
Mean6S.D. 35.5617.2 35.9623.2 52.1631.7 0.2461
Middle DR intensity (dB) Range 7.1–18.3 3.6–20.5 3.9–20.7
Mean6S.D. 11.563.4 10.265.3 10.965.3 0.8411
a
Repeated measures one-way ANOVA reveals no significant difference in these changes among three different types of rate-intensity functions (P50.1245–0.8411). P, significance level; n, number of neurons.
stimulation significantly increased the slope (Fig. 2) and attenuate self-stimulation and increase the threshold for decreased the dynamic range (Fig. 3A-1, B-1, C-1) in all target detection and discrimination [4,5,15,18]. We propose corticofugally-inhibited IC neurons (Table 1, top and that bats may additionally utilize corticofugal inhibition to middle rows). improve the analysis of echo intensity by increasing AC stimulation significantly shifted the dynamic range sensitivity to change of echo intensity over a smaller (Fig. 3A-1, B-1, C-1) and the middle dynamic range intensity range at higher echo intensity levels.
intensity (Fig. 3A-2, B-2, C-2) to higher intensity levels (Table 1, bottom row). The observed shift in dynamic
range was larger at the low than at the high intensity end Acknowledgements (Fig. 3A-1, B-1, C-1). This asymmetrical shift in the
dynamic range occurred because AC stimulation produced We thank Dr. A. Chandrasekhar and an anonymous a more pronounced effect at the low than at the high reviewer for commenting on an earlier version of this intensity levels (Fig. 2A-3, B-3, C-3). manuscript. This work is supported by a research grant We observed significant differences among the three from the National Science Foundation (NS9907610). The types of IC neurons in dynamic range and slope whether experiments were conducted in compliance with NIH obtained before or during AC stimulation (Table 1, top and publication No. 85-23, ‘Principles of Laboratory Animal bottom rows). These observations indicate that there is a Care’ and with the approval of the Institutional Animal trade-off in the intensity coding properties of IC neurons. Care and Use Committee of the University of Missouri– For example, non-monotonic IC neurons had significantly Columbia.
smaller dynamic ranges and larger dynamic range slopes than the other two types of IC neurons (Table 1). These data suggest that non-monotonic IC neurons are most
References
sensitive to intensity changes over a smaller range of intensity than the other two types of IC neurons. In spite of
[1] R.A. Andersen, R.L. Snyder, M.M. Merzenich, The topographic
these differences, AC stimulation did not produce any
organization of cortico-collicular projections from physiologically
significantly differential or selective effects on intensity defined loci in the AI, AII and anterior auditory cortical fields of the coding among these three types of IC neurons (Table 2). cat, J. Comp. Neurol. 191 (1980) 479–494.
As described earlier, previous studies have shown that [2] K.D. Games, J.A. Winer, Layer V in rat auditory cortex: projections to the inferior colliculus and contralateral cortex, Hear. Res. 34
the corticofugal system extensively adjusts and improves
(1988) 1–25.
subcortical auditory signal processing in the frequency,
[3] D.R. Griffin, Listening in the Dark, Yale University Press, New
time and spatial domains [6,11,12,21–27]. We have now Haven, CT, 1958, Reprinted by Comstock Pub. Assoc. Cornell demonstrated that corticofugal modulation also improves Univ. Press 1986.
subcortical signal processing in the intensity domain by [4] D.J. Hartley, Stabilization of perceived echo amplitudes in ech-olocating bats. I. Echo detection and automatic gain control in the
increasing the sensitivity to intensity change over a smaller
big brown bat, Eptesicus fuscus, and the fishing bat, Noctilio
intensity range at higher sound intensity levels (Figs. 1–3;
leporinus, J. Acoust. Soc. Am. 91 (1992) 1120–1132.
Table 1). [5] D.J. Hartley, Stabilization of perceived echo amplitudes in ech-During hunting, bats emit sounds and analyze the olocating bats. II. The acoustic behavior of the big brown bat,
returning echoes to extract information about the targets Eptesicus fuscus, when tracking moving prey, J. Acoust. Soc. Am.
91 (1992) 1133–1149.
[3]. As the bats approach the targets, the returning echoes
[6] J. He, Modulatory effects of regional cortical activation on the onset
become stronger. To have optimal reception of echoes,
responses of the cat medial geniculate neurons, J. Neurophysiol. 77
bats reduce the pulse intensity to compensate for increas- (1997) 896–908.
ing echo intensity [4,5,10,16]. In addition, bats contract [7] O.W. Henson, The activity and function of the middle ear muscles in
[8] H. Herbert, A. Aschoff, J. Ostwald, Topography of projections from mimics the topography of intracollicular projections, J. Comp. the auditory cortex to the inferior colliculus in the rat, J. Comp. Neurol. 371 (1996) 15–40.
Neurol. 304 (1991) 103–122. [18] J.A. Simmons, A.J. Moffat, W.M. Masters, Sonar gain control and [9] R.F. Huffman, O.W. Henson, The descending auditory pathways and echo detection thresholds in the echolocating bat, Eptesicus fuscus,
acoustico motor systems: connections with the inferior colliculus, J. Acoust. Soc. Am. 91 (1992) 1150–1163.
Brain Res. Rev. 15 (1990) 295–323. [19] N. Suga, Parallel-hierarchical processing of complex sounds for [10] P.H.-S. Jen, T. Kamada, Analysis of orientation signals emitted by specialized auditory function, in: M.J. Crocker (Ed.), Encyclopedia
the CF-FM bat, Pteronotus parnellii parnellii and the FM bat, of Acoustics, John Wiley, New York, 1997, pp. 1409–1418.
Eptesicus fuscus during avoidance of moving and stationary obsta- [20] N. Suga, P.H.-S. Jen, Peripheral control of acoustic signals in the cles, J. Comp. Physiol. 148 (1982) 389–398. auditory system of echolocating bats, J. Exp. Biol. 62 (1975) [11] P.H.-S. Jen, J.P. Zhang, Corticofugal regulation of excitatory and 277–311.
inhibitory frequency tuning curves of bat inferior collicular neurons, [21] X.D. Sun, Q.C. Chen, P.H.-S. Jen, Corticofugal control of central Brain Res. 842 (1999) 184–188. auditory sensitivity, Neurosci. Lett. 212 (1996) 131–134. [12] P.H.-S. Jen, Q.C. Chen, X.D. Sun, Corticofugal regulation of [22] X.D. Sun, P.H.S. Jen, D.X. Sun, S.F. Zhang, Corticofugal influences
auditory sensitivity in bat inferior colliculus, J. Comp. Physiol. 183 on the responses of bat inferior collicular neurons to sound
(1998) 683–697. stimulation, Brain Res. 495 (1989) 1–8.
[13] P.H.-S. Jen, X.D. Sun, D.M. Chen, H.B. Teng, Auditory space [23] A.E.P. Villa, E.M. Rouiller, S.M. Simm, P. Zurita, Y. de Ribaupierre, representation in the inferior colliculus of the FM bat, Eptesicus F. de Ribaupierre, Corticofugal modulation of the information
fuscus, Brain Res. 419 (1987) 7–18. processing in the auditory thalamus of the cat, Exp. Brain Res. 86 [14] P.H.-S. Jen, X.D. Sun, J.X. Shen, Q.C. Chen, Y. Qian, Cytoarchitec- (1991) 506–517.
ture and sound activated responses in the auditory cortex of the big [24] J. Yan, N. Suga, Corticofugal modulation of time-domain processing brown bat, Eptesicus fuscus, Acta Otolaryngol. 532 (1997) 61–67. of biosonar information in bats, Science 273 (1996) 1100–1103. [15] S.A. Kick, J.A. Simmons, Automatic gain control in the bat’s sonar [25] W. Yan, N. Suga, Corticofugal modulation of the midbrain frequency
receiver and the neuroethology of echolocation, J. Neurosci. 4 map in the bat auditory system, Nature Neurosci. 1 (1998) 54–58. (1984) 2725–2737. [26] Y.F. Zhang, N. Suga, Corticofugal amplification of subcortical [16] J.B. Kobler, B.S. Wilson, O.W. Henson, A.L. Bishop, Echo intensity responses to single tone stimuli in the mustached bat, J.
Neuro-compensation by echolocating bats, Hear. Res. 20 (1985) 99–108. physiol. 78 (1997) 3489–3492.