29 SEPTEMBER 2009 SAMOA TSUNAMI
A. Annunziato1, G. Franchello1, E. Ulutas2, T. De Groeve1
1 – Joint Research Centre, European Commission 2 – University of Kocaeli, Turkey
The mission of the JRC-IPSC is to provide research results and to support EU policy-makers in their effort towards global security and towards protection of European citizens from accidents, deliberate attacks, fraud and illegal actions against EU policies.
European Commission Joint Research Centre
Institute for the Protection and Security of the Citizen
Contact information: Alessandro Annunziato
Address: Via Enrico Fermi 2749, 21027 Ispra (VA), Italy
E-mail: alessandro.annunziato@jrc.it Tel.: +39 0332 789519 http://ipsc.jrc.ec.europa.eu/ http://www.jrc.ec.europa.eu/ Legal Notice
Neither the European Commission nor any person acting on behalf of the Commission is responsible for the use which might be made of this publication.
Europe Direct is a service to help you find answers to your questions about the European Union
Freephone number (*): 00 800 6 7 8 9 10 11
(*) Certain mobile telephone operators do not allow access to 00 800 numbers or these calls may be billed.
A great deal of additional information on the European Union is available on the Internet. It can be accessed through the Europa server http://europa.eu/
JRC 54943 EUR 24068 EN
ISSN 1018-5593
Luxembourg: Office for Official Publications of the European Communities © European Communities, 2009
Table of Contents
1 Introduction...7
2 Description of the tsunami event...9
2.1 Tectonic Summary ...9
2.2 Available IN‐SITU measurements...11
2.3 Impact of the tsunami...14
2.4 GDACS Response ...15
2.5 Automatic reports for this earthquake...15
2.6 GDACS Virtual OSOCC ...16
3 Analysis and methodology ...17
3.1 Fault mechanism ...18
3.1.1 Near‐real time calculations...18
3.1.2 Post event calculations...18
3.2 Hydraulic initial conditions...20
3.3 travel time ...21
4 RESULTS OF Near‐real time CALCULATIONS ...23
5 Post Event Simulations...25
5.1 Comparison with DART measurementS ...27
5.2 COMPARISON WITH TIDAL MEASUREMENTS...33
5.2.1 Western Samoa ...33
5.3 Pago Pago ...36
5.4 Niuatoputu, Tonga...41
5.5 Ofu‐Tau, American Samoa ...44
6 Inundation calculations for selected areas ...46
7 Conclusions...49
8 References ...50
9 Appendix A – PTWS Bulletins ...51
9.1 TSUNAMI BULLETIN NUMBER 001 ...51
9.2 TSUNAMI BULLETIN NUMBER 002 ...54
9.3 TSUNAMI BULLETIN NUMBER 003 ...57
Abstract
On 29 September 2009 at 17:48:11 UTC a large earthquake of magnitude 8 struck off‐shore of the Samoa Islands and generated a large tsunami that destroyed several villages and caused more than 160 fatalities.
This report first presents the characteristics of the earthquake and discusses the best estimations for the fault
parameters. These are necessary input data for the hydrodynamic tsunami calculations. Then, a comparison between the near‐real time systems and the post‐event calculations is performed, with an analysis of the observed differences compared with observed tidal measurements. Coarse, detailed and very detailed calculations are presented in order to identify areas of maximum damage.
Executive Summary
On 29 September 2009 at 17:48:11 UTC a large earthquake of magnitude 8 struck off‐shore of the Samoa Islands and generated a large tsunami that destroyed several villages and caused more than 160 fatalities.
This report first presents the characteristics of the earthquake and discusses the best estimations for the fault
parameters. These are necessary input data for the hydrodynamic tsunami calculations. Then, a comparison between the near‐real time systems and the post‐event calculations is performed, with an analysis of the observed differences compared with observed tidal measurements. Coarse, detailed and very detailed calculations are presented in order to identify areas of maximum damage.
Over time, seismological institutions published more accurate data, which triggered new impact evaluations. The first data was received from the Pacific Tsunami Warning Centre (through the USGS/NEIC information feeds (see Appendix A). This was 16 minutes after the event, but had an underestimated magnitude, causing a green alert. The first Orange alert was generated based on information from NOAA, received 20 minutes after the event (again through the NEIC feeds). Later, magnitude was revised upwards and depth downwards, increasing the alert level to Red (with a grid‐based tsunami wave height of 4.01m).
Several in‐situ sensors are located in the area, but not all were functional during the event. The main ones against which we will compare the calculations are 2 bottom pressure measurements (DART) and 2 tidal measurements located in Apia (maximum height 0.7m) and Pago Pago (maximum measured height 1.6m).
The near‐real time calculations were automatically initialized with an initial maximum height of 3.16m. The maximum height indicated in the calculations is 3.8m in Fagamalo and Poloa and 3.1m in Fagasa all in American Samoa, in the island of Pago‐Pago. The near‐real time calculation correctly identified the severity of the event and indicated which islands were mostly affected.
Post event calculations were performed in order to better represent the event and identify more in detail the affected locations. It was found that the most damaged locations are the Southern section of Western Samoa islands, Pago Pago and Niuatoputu islands. This is in agreement with the locations indicated by the Red Cross as most affected.
It was also attempted to evaluate the inundation using a more detailed model and the results are encouraging. The flooded areas for which we had confirmation from satellite images were in effect modelled as flooded.
1 INTRODUCTION
On 29 September 2009 at 17:48:11 UTC a large earthquake of magnitude 8 struck off‐shore of the Samoa Islands and generated a large tsunami that destroyed several villages and caused more than 160 fatalities.
The Joint Research Centre of the European Commission has developed an automatic tsunami calculation system that is invoked by the Global Disasters Alert and Coordination System (GDACS) when needed. During the Samoa event the system was repeatedly activated when increasingly accurate information on the earthquake became available. Calculations are triggered when new parametric solutions (magnitude, depth and location) are published by seismological organizations (e.g. USGS, EMSC, GEOFON or others). The automatic system successfully identified a risk of a large event for the Samoa islands and its calculations were available online in less than 20 minutes after the earthquake event. The day after the event, USGS published1 the Global CMT Project Moment Tensor Solution for the earthquake and a day later the Finite Fault Model solution. The latter represents the best solution for the reconstruction of the initial fault form. This report shows the initial calculations, automatically performed by the JRC Tsunami Calculation System and the calculations performed in the days after the event, when the Finite Fault Model solution became available. Calculation accuracy is evaluated by quantifying the discrepancy between sea level measurements and the initial (near‐real time) calculations, and subsequent more detailed calculations.
It is important, however, to underline that there are several types of calculations and each of them has its own merit and needs.
• Near‐real time calculations
o These are performed very quickly after an event and can only use the information available 15‐20 min after the event. The fault mechanism is not very well known (conservative assumptions must be done) and the position or the depth is not precise at the beginning.
o The nodalisation is rather coarse (cell size between 2 and 8 km) to shorten the calculation time.
o The objective of these calculation is the identification of the affected locations without pretending to exactly predict the height in all the locations.
• Grid scenario calculations
o These are performed before an event for all likely tsunami scenarios. General assumptions on the fault mechanism must be done (conservative).
o The nodalisation is rather coarse (cell size between 2 and 8 km) to shorten the calculation time a limit the data volume.
o The objective of these calculation is the same as the near real‐time calculations, but with even faster response times: calculations are not performed but alert systems can look up the scenario results in a database.
• Post event calculations
o They are performed one or two days after an event when more information is available on the fault mechanism.
o The nodalisation becomes more detailed (cell size between 200 and 900m) in order to accurately estimate the results.
o The objective is to identify more precisely the locations and try to estimate the run‐up height and the potential damage in the various coastal areas. In case an impact assessment is requested, inundation calculations are performed. In this case it is necessary to increase the detail level by reducing the cell size, i.e. down to 10‐20m. The results are affected by the precision of the available topography and bathymetry, buildings, infrastructures, etc.
• Risk assessment and risk management calculations
o These are performed before an event and are based on historical events.
1
o These calculations are aimed at preparing evacuation plans in case of tsunami. They are very much site specific and in general it is necessary to perform very detailed calculations reducing the cell size down to 5‐20m. Correspondingly also the bathymetry has to be specified with extreme detail which is not available worldwide.
The GDACS system is triggering near‐real time calculations, which provide the appropriate information for its alerting functions. However, for this tsunami in Samoa we also performed post event calculations in order to better understand the phenomena, identify the locations affected and obtain feedback to improve the near‐real time calculations, if possible.
The analysis is conducted using 3 numerical codes: the SWAN‐JRC code, which is the basis for the overall tsunami grid scenario calculations in support of GDACS; the HyFlux2 code which solves the equations with a different numerical method which is particularly relevant for inundation calculations; the TUNAMI2 code, by Prof. Imamura, to have another reference. The calculations are also compared with the results of the NOAA unit source results as far as regards near‐real time calculations.
2 DESCRIPTION OF THE TSUNAMI EVENT
On 29/09/2009 17:48:15 UTC an earthquake of magnitude 8 and depth 18km triggered a tsunami with calculated maximum wave height of 2.2m near the coast of Samoa Islands Region. Media report local waves of up to 7m, and casualty tolls reaching 160 deaths
Widespread damage was reported to infrastructure at Pago Pago, American Samoa, and in many parts of Samoa and on Niuatoputapu, Tonga. The following peak‐to‐through wave heights were recorded: 3.14m at Pago Pago (American Samoa); 1.40m at Apia (Samoa); 0.47m at Rarotonga and 8 cm at Penrhyn (Cook Islands); 14 cm at Nuku`alofa (Tonga) and 11 cm at Papeete (French Polynesia).
According to the UN‐OCHA Situation report #6 (6 Oct 2009) the major relief effort is focused in two locations: (1) the southern coast of Upolu (Western Samoa), where the most significant damage was sustained, and (2) the small island of Manono, where infrastructure and water supply were damaged.Assessments by the Samoan Red Cross indicate that 40 villages have been affected along the south‐eastern coast, with 20 villages completely destroyed by tsunami waves. Approximately 3,200 people (640 families) have been left homeless. People are living in makeshift shelters in their gardens on higher grounds and with host families. The Government of Samoa estimated the cost of damage to infrastructure, public and private properties at around Samoan Tala 380 million (approximately €100 million).
2.1 TECTONIC SUMMARY
In order to perform correct tsunami simulation of the 29 September 2009 Samoa earthquake, it is necessary to take into account the tectonic setting and seismicity of Samoa and surrounded area. It is important to analyse the entire scenario of effects by carrying out earthquake parameters in the form of epicentre, depth, fault length, fault width, slip
distribution and fault mechanism.
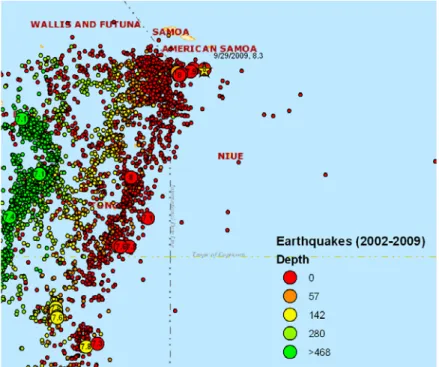
The earthquake occurred as part of a clustering of a major seismic activity in the north of Tonga Trench (TT) which may have reflected a reactivation of all major plate boundaries in the region (Error! Reference source not found.). The Tonga Trench is located in the Pacific Ocean and is 10.882 meters (35.702 ft) deep at its deepest point, known as the Horizon Deep. It is a deep canyon on the edge of the Pacific Plate. The region has a complex tectonic regime and very high level of seismic activity related to the compressional motion between Pacific and Australian Plate (Error! Reference source not found.). The Pacific tectonic plate dives beneath the Australian plate at a rate of almost a centimetre a year, making the area one of the most active earthquake regions in the world. The earthquakes occur within the Pacific plate on both sides of the trench. The trench and associated faults are forming as the Pacific Plate moves westward, sinking beneath a complex series of smaller plates on the edge of the Australian Plate. There have been around 30 quakes of magnitude 7.0 or more along this trench since 1900 (http://earthquake.usgs.gov/regional/neic). Figure 1 shows the location of the earthquake in relation to the Samoa islands. The Samoa earthquake occurred on a subtle ridge on the seafloor, called “outer rise”, near the Tango Trench. Outer rise earthquakes occur when normal faults ocean‐ward of the subduction zone are activated by flexture of the plate as it bends into the subduction. On the basis of currently available fault mechanism information after the earthquake, it could be inferred the earthquake occurred as a normal fault rupture on the outer rise of the Tonga Trench.
Figure 1 ‐Distribution of the historical earthquakes (dots) and epicentre of the 29 September 2009 Samoa earthquake (star).
Figure 2 ‐ Proposed plate tectonic map for the Tonga region (Pelletier et al., 1998). NHT :New Hebrides Trench; TT: Tonga Trench; NBAT and SBAT : resp. North and South New Hebrides Back‐Arc Troughs; CBAC :Central New Hebrides Back‐Arc Compressional zone; ESR, CSR, WSR, NSR and N160R D resp. East, Central, West, North and N160ºE spreading ridges of the North Fiji basin; ELSC, CLSC, NWLSC and NELSC: resp. East, Central, North‐West and North‐East Lau Spreading Centres; PR : Peggy ridge; FFZ : Fiji fracture zone; FP : Fiji platform; NC, SC, S, M, E, Ta, Mt, V, T, Nt, Ni and F: resp.New Caledonia, Santa Cruz, Santo, Malekula, Efate, Tanna, Matthew, Vava’u, Tongatapu, Niuatoputapu, Niuafo’ou and Futuna Islands; VTL: Vitiaz trench lineament; CKL: Conway–Kandavu lineament; shaded areas indicate subducting ridges and plateaus; DER, LyR, LR and SR : resp. d’Entrecateaux, Loyalty, Louisville and Samoan Ridges; WTP: West Torres plateau
2.2 AVAILABLE IN‐SITU MEASUREMENTS
Several in‐situ sensors are located in the area, but not all were functional during the event. The main ones against which we will compare the calculations are:
DART measurements:
• 51425
• 51426
Tidal level measurements:
• Apia
• Pago Pago
These were the closest in‐situ measurement points.
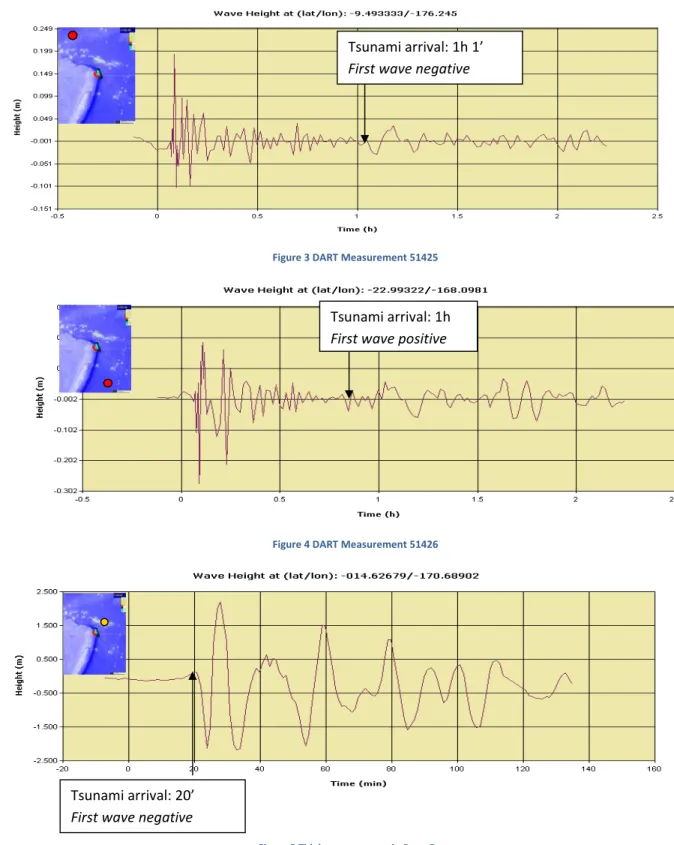
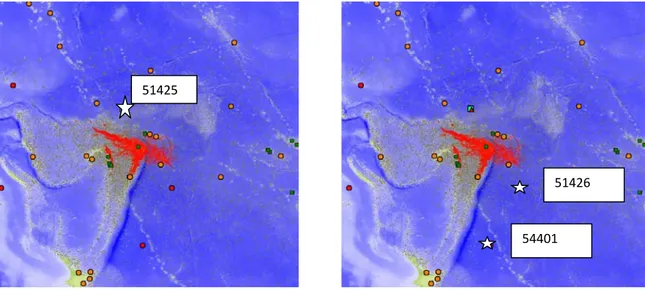
According to the tsunami travel time both DART buoys should have been reached in about 1h and the tidal measurements between 15 and 25 minutes from the event.
A negative initial wave is recorded by 3 sensors (51425, Apia and Pago Pago), which is consistent with the proposed fault mechanism (see chapter 3.1.2). The sensor on the North – North‐East side shows a negative section, while 51426 shows
an initial positive section which could indicate that a higher positive section should be present in the Southern part of the fault.
There are several other measurement points available in the Pacific Ocean that can be useful to estimate the arrival time, but the ones indicated are the most relevant to analyse in greater detail the tsunami phenomenon.
51425
51426 Pago-Pago Apia
Figure 3 DART Measurement 51425
Figure 4 DART Measurement 51426
Figure 5 Tidal measurement in Pago‐Pago Tsunami arrival: 1h 1’ First wave negative
Tsunami arrival: 1h First wave positive
Tsunami arrival: 20’ First wave negative
Figure 6 Tidal measurement in Apia
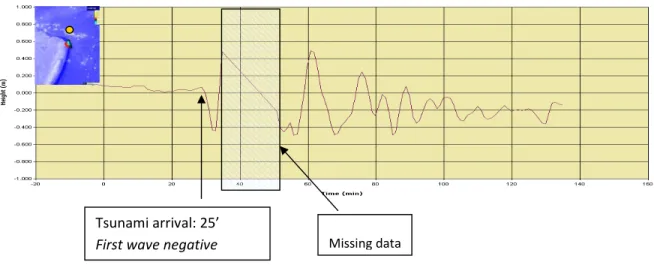
The conditions of the tide at the time of the tsunami was in the descending part of the tide that in this location and in this period of the year does not exhibit a large variation (about 0.5m between minimum and maximum).
Figure 7 DART Measurement 51425, long range, tidal data Tsunami arrival: 25’
2.3 IMPACT OF THE TSUNAMI
The table below has been compiled by NOAA and included in the NGDC database. Many more points will be available in the future. For the moment most of the measures are based on tidal measurements. The last 4 columns are related to calculations described in the following sections.
Country Location Lat. Lon. Distance
(km) HH Height (m) Deaths Estim. Time Calcul. Time Calc. Height (m) Cell size (min) Tonga Niuatoputapu ‐15.95 ‐173.75 183 7 0:22 8.8 0.1
Usa Territory Pago Pago ‐14.283 ‐170.68 208 0:11 2.16 22 20’ 0:22 3.0 0.1
Samoa Upolu ‐13.817 ‐171.75 197 0:21 0.78 27’ 0:27 0.76 0.1
Samoa Apia ‐13.817 ‐171.75 197 0:44 0.70 110 0:27 0.76 0.1
Tonga Nukualofa
(Nuku'alofa)
‐21.133 ‐175.17 700 0:59 0.15 ‐ 0:49 0.2 1.0
Cook Islands Rarotonga ‐21.18 ‐159.77 1442 1:48 0.62 1:41 0.1 4.0
Cook Islands Penryhn ‐8.59 ‐158.07 1710 2:30 0.09 2:12 0.03 4.0
Fiji Lautoka ‐17.6 177.433 1139 3:09 0.09 3:09 <0.01 4.0
French Pol. Papeete,
Tahiti
‐17.533 ‐149.57 2410 3:12 0.15 3:22 0.06 4.0
Kiribati Christmas Island 1.983 ‐157.47 2529 3:24 0.17 3:31 ‐ 4.0
Vanuatu Luganville ‐15.515 167.188 2219 4:08 0.17 3h 56’ 3:55 ‐ 4.0
New Zealand North Cape 4:24 0.23 4:49 ‐ 4.0
New Zealand Owenga ‐44.017 138.633 5598 4:26 0.32 4:45 ‐ 4.0
Table 1‐ List of run‐up locations from NGDC Database (http://www.ngdc.noaa.gov/nndc/struts/)
The figure above reports the pre‐ and post‐tsunami image of Fagasa Bay, on the Pago Pago Island. While the tide is low in the post‐image, some damage among the houses can be seen where the tsunami ran up the land.
2.4 GDACS RESPONSE
The Global Disaster Alert and Coordination System aims at alerting the international humanitarian response community for disaster that will require international response. GDACS consists of an automatic alerting system (sending SMS, email and fax alerts to around 10000 users) and a restricted website for professional responders (the Virtual OSOCC).
2.5 AUTOMATIC REPORTS FOR THIS EARTHQUAKE
Over time, seismological institutions published more accurate data, which triggered new impact evaluations. The first data was received from the Pacific Tsunami Warning Centre (through the USGS/NEIC information feeds (see Appendix A). This was 16 minutes after the event, but had an underestimated magnitude, causing a green alert. The first Orange alert was generated based on information from NOAA, received 20 minutes after the event (again through the NEIC feeds). Later, magnitude was revised upwards and depth downwards, increasing the alert level to Red (with a grid‐based tsunami wave height of 4.01m). Alert level Estimated tsunami wave height (m) Lat/Lon Magn itude (M) Depth (km)
Source Publication Date/Time (UTC) Delay
0.06 -15.27, -171.5 7.1 33 PTWC 9/29/2009 06:04:30 PM 16 min 2.27 -15.4, -171.6 7.9 33 NOAA 9/29/2009 06:09:11 PM 20 min 2.27 -15.5538, -172.1409 7.9 35 NEIC 9/29/2009 06:14:51 PM 26 min 2.27 -15.42, -172.21 7.9 60 EMSC 9/29/2009 06:14:59 PM 26 min 2.27 -15.43, -172.2 8.1 60 EMSC 9/29/2009 06:30:02 PM 42 min 4.01 -15.3, -171.0 8.3 33 NOAA 9/29/2009 07:05:59 PM 1h17min 2.27 -15.5577, -172.0726 8.0 18 NEIC 9/29/2009 07:37:36 PM 1h49min 2.27 -15.3, -171.0 8.0 33 NOAA 9/29/2009 10:11:46 PM 3h23min 3.3 -15.559, -172.0926 8.0 18 NEIC 9/30/2009 03:15:21 PM >21h
Table 2 – List of epicentres identified by the GDACS system as they were collected
While these response times are effective for the international community, the systems would have been too slow to alert some of the most affected areas. The first tsunami waves arrived2 in Western Samoa 17 minutes after the earthquake. Most cities in Western and American Samoa were reached within 20 minutes. The highest waves higher than 7 meters and generated by local geographic conditions, arrived 30 minutes after the event.
Note that the uncertainty on the earthquake parameters caused an underestimation of wave heights: the maximum wave height reported by the GDACS system increased from 0.06m to 4.01m (1h17 minutes after the event), while the true maximum wave heights were up to 7m.
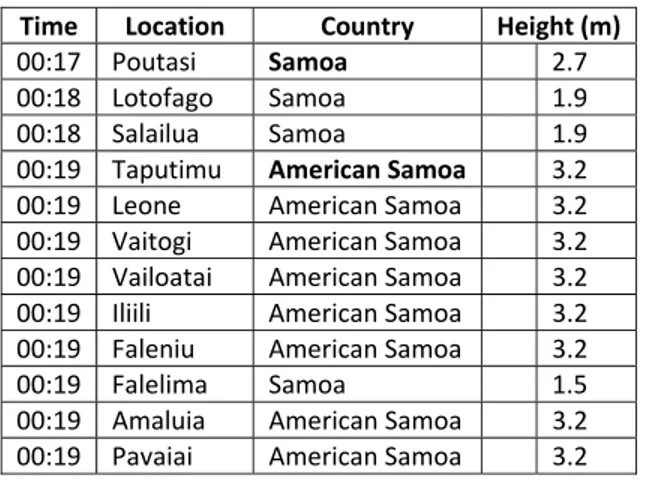
Table 3. Arrival times according to best simulation.
Time Location Country Height (m)
00:17 Poutasi Samoa 2.7
00:18 Lotofago Samoa 1.9
00:18 Salailua Samoa 1.9
00:19 Taputimu American Samoa 3.2 00:19 Leone American Samoa 3.2 00:19 Vaitogi American Samoa 3.2 00:19 Vailoatai American Samoa 3.2 00:19 Iliili American Samoa 3.2 00:19 Faleniu American Samoa 3.2
00:19 Falelima Samoa 1.5
00:19 Amaluia American Samoa 3.2 00:19 Pavaiai American Samoa 3.2
2
In this paragraph, arrival times refer to the time of arrival of the maximum wave height. If the negative part of the wave arrives first (i.e. retreating water), this is not taken into account.
00:19 Mesepa American Samoa 3.2 00:19 Futiga American Samoa 3.2
00:19 Satupaitea Samoa 1.8
00:19 Gautavai Samoa 1.6
00:19 Faleaseela Samoa 3.5
00:19 Matautu Samoa 2.9
00:20 Fagasa American Samoa 3.1 00:20 Aasu American Samoa 3.1
00:20 Falealupo Samoa 1.2
00:21 Hihifo Tonga 3.9
00:22 Falehau Tonga 5.4
00:23 Fagamalo American Samoa 4.7
… … …
00:30 Alaufau American Samoa 7.4 00:31 Olosega American Samoa 5.8 00:31 Lalomoana American Samoa 5.8 00:32 Tau American Samoa 7.1 00:32 Faleasau American Samoa 7.1
2.6 GDACS VIRTUAL OSOCC
The second trigger in the GDACS system is the creation of a new disaster page for an event. For the Samoan tsunami, this happened on 29 September 2009 at 21:00 UTC (5h after the event). Although the first message in the Virtual OSOCC was the PTWC Tsunami Bulletin (posted at 18:12 UTC), response information became available only after the creation of the Samoan disaster page. At that time, the international response community was actively providing information on this event in the GDACS system, including information on declaration of state of emergency, contact information of local Red Cross societies, the first OCHA situation report, etc.
3 ANALYSIS AND METHODOLOGY
The tsunami analysis depends strongly on: a) the initial fault mechanism; b) the hydraulic conditions (e.g. bathymetry cell size). It is also important to point out that the information available immediately after the event are only epicentre, magnitude and depth. All these quantities may change significantly due to progressive improvement of the seismological parameters. The day after the event the fault mechanism was identified and two‐three days later USGS published the finite fault model solution, which is the best characterization of the fault.
The choice of the tsunami source is usually a complicated problem because it requires good knowledge of the earthquake parameters such as epicentre, depth, fault length, fault width, slip distribution and rupture mechanism. It is assumed that the tsunami is generated by coseismic displacement of the sea floor. Thus, the initial condition for the expected tsunami in the region is assumed to coincide with the vertical coseismic displacement of the sea bottom induced by the
earthquake. The initial conditions are one of the major factors that affect the wave propagation and the resulting run up amplitudes along the shoreline. Different approaches can be used to calculate the initial conditions from the motion of the fault.
JRC uses three approaches for this purpose. One of them is to evaluate the earth deformation caused by the earthquake and impose an initial water height proposed by Ward (2001). This approach gives the initial water level increase by using the empirical relationships between the magnitude of the earthquake and fault length and width. The second one was developed by Okada (1985). This algorithm calculates the distribution of coseismic uplift and subsidence by using the epicentre of the earthquake, fault strike, fault dip, fault rake and amount of average displacement on the fault. The third approach is to use the fault and the direction of slips by separating the fault plane into the subfaults. In order to reveal the rupture process of the fault with this approach, USGS uses GSN broadband waveforms downloaded from the National Earthquake Information Center (NEIC) waveform server. They analyses teleseismic broadband P waveforms, broadband SH wave forms and long period surface waves selected based upon data quality and azimuthal distribution. Waveforms are first converted to displacement by removing the instrument response and then used to constrain the slip history based on a finite fault inverse algorithm (Ji et al, 2002). These approaches have been used for the tsunami simulation of Samoa earthquake in subsequent sections.
The earthquake parameters, fault mechanism solutions and cross‐section of slip distribution of the fault model – which are available after the earthquake from the different organizations – are given respectively in Table 4Error! Reference source not found., Table 5 and Figure 3. The mechanism solutions show an almost normal fault, on a plane striking roughly parallel to the Tonga Trench axis, with seismic moment of 1.82 × 1028 dyn cm.
Table 4. Earthquake parameters (USGS/NEIC)
Magnitude (Mw) 8.0
Date and Time 29, September 2009 at 17:48:10 UTC
Location 15.509°S, 172.034°W
Depth (km) 18
Region Samoa Island Region
3.1 FAULT MECHANISM
3.1.1 NEAR‐REAL TIME CALCULATIONS
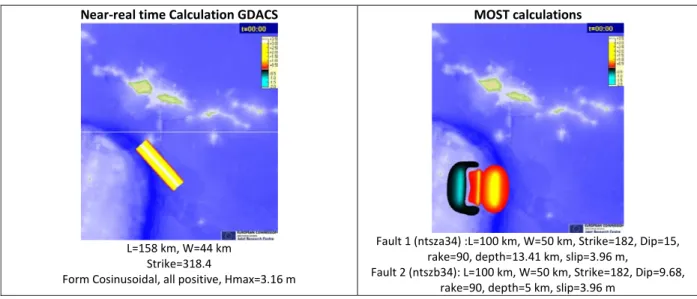
The near‐real time calculations were performed using the original JRC fault model which should be considered as an upper bound or worst case. Several calculations were requested (10) as the epicentre was better identified (see previous chapter). The final case has been performed with the following parameters:
• L=158 km, W=44 km, Strike=318.4, Form Cosinusoidal, all positive, Hmax=3.16m
The JRC fault model assumes a cosinusoidal shape all positive, in order to maximize the impact. The model assumes a standards earthquake depth, and applies a scaling factor for the real depth. For a depth of 18km, the depth factor is 0.8. This, the calculated wave height of 3.16m is reduced to 2.5m. This however was not done for the near‐real time calculations.
Other near‐real time calculations during the event were the ones performed by NOAA, with the MOST code; they found that the best solution for the current fault (as compared with the buoys measurements), was obtained using the unit sources ntsza34 plus the ntszb34 solution, both multiplied by the factor 3.96. It should be reminded that every NOAA unit fault source correspond to a 100 km x 50 km fault of elevation 1m (e.g. corresponding to a magnitude of 7.5); thus it is necessary to multiply for a factor to take into account the different magnitude.
Near‐real time Calculation GDACS
L=158 km, W=44 km Strike=318.4
Form Cosinusoidal, all positive, Hmax=3.16 m
MOST calculations
Fault 1 (ntsza34) :L=100 km, W=50 km, Strike=182, Dip=15, rake=90, depth=13.41 km, slip=3.96 m,
Fault 2 (ntszb34): L=100 km, W=50 km, Strike=182, Dip=9.68, rake=90, depth=5 km, slip=3.96 m
3.1.2 POST EVENT CALCULATIONS
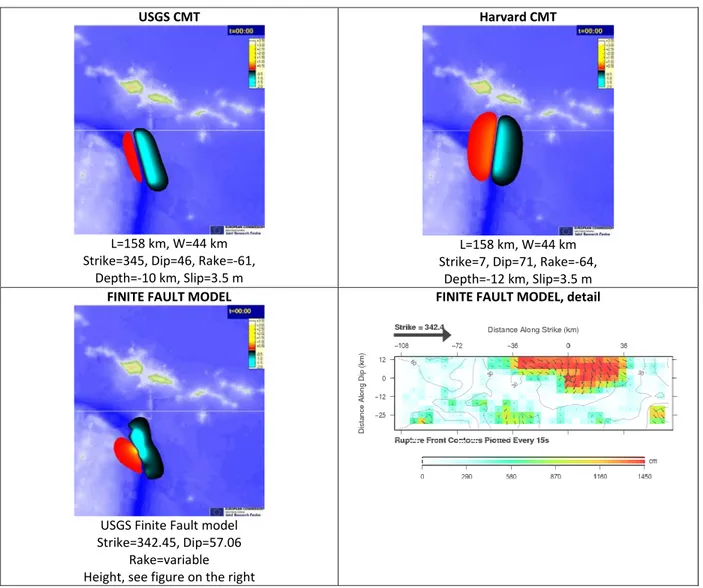
According to the fault mechanisms published by USGS the day after the event two possible solutions can be analyzed, the USGS one and the Harvard one. They differ for the location and mostly for the strike angle (more vertical in the Harvard one).
The parameters below have been included in the Okada (1985) model in order to setup the initial deformation.
Table 5. Fault mechanism solutions
Time 17:48:10.57 Lat/Lon Mag (Mw) Strike Dip Rake Depth (km)
USGS Centroid Moment Tensor Solution ‐15.418/‐172.005 8.0 345 46 ‐61 10
Two days after the event the Finite Fault Model solution has been published by USGS3. This solution has been obtained using GSN broadband waveforms downloaded from the NEIC data server. They analyzed 18 teleseismic broadband P waveforms, 13 broadband SH waveforms, and 36 long period surface waves selected based upon data quality and azimuthal distribution. Waveforms were first converted to displacement by removing the instrument response and then used to constrain the slip history based on a finite fault inverse algorithm (Ji et al, 2002). The hypocenter adopted was the USGS (Lon.=‐15.60 deg.; Lat.=‐172.30 deg.). The fault planes are defined using the quick moment tensor solution from Jascha Polet at Cal Poly Ponoma.
The result of this procedure is a series of 432 individual sources of 5 km by 4 km, all at strike 342.45 and dip 57.06. All fault planes have their own rake and slip. Combined, the sources produce an initial deformation as shown in the previous figure, which indicates that the best “simple” solution is the one proposed by CMT USGS.
In order to evaluate the effect of each solution on the wave height results it is necessary to run simulations for the various source solutions. It may be anticipated however that, differently from the near‐real time calculation initial condition, all the solutions show a negative section on the North‐East side.
In the following, most of the calculations have been performed using as initial conditions the Finite Fault model because it is considered to be the best one, as confirmed by sea level measurements.
Table 6. Different sources for post‐event calculations. The best “simple” solution is the one proposed by CMT USGS.
USGS CMT
L=158 km, W=44 km Strike=345, Dip=46, Rake=‐61,
Depth=‐10 km, Slip=3.5 m
Harvard CMT
L=158 km, W=44 km Strike=7, Dip=71, Rake=‐64,
Depth=‐12 km, Slip=3.5 m FINITE FAULT MODEL
USGS Finite Fault model Strike=342.45, Dip=57.06
Rake=variable Height, see figure on the right
FINITE FAULT MODEL, detail
3
3.2 HYDRAULIC INITIAL CONDITIONS
The hydraulic initial condition always assumes that the bottom floor earth deformation is instantaneously transmitted to the water. Thus the initial water level field is initialized with the bottom deformation indicated in the previous section. The available bathymetry and topography for this area include the following
• ETOPO2, 2 minute bathymetry and topography
• GEBCO 30” bathymetry and topography
• Swith & Sandwell 30”, which is very similar to the GEBCO
• In some areas more detailed bathymetries, like in the Pago Pago Harbour, where we found a 5m resolution bathymetry that has been used for the specific detailed calculations.
3.3 TRAVEL TIME
The travel time has been calculated adopting a technique developed at JRC which is based on ray path travel time based on the local bathymetry. The travel time to reach the first islands is in the order of 15‐20 min. The travel time in the Pacific basin is shown in Figure 9.
4 RESULTS OF NEAR‐REAL TIME CALCULATIONS
In this section only the last performed simulation (the last row in Table 2) is compared. However, all the results of the other simulations are available online in the GDACS report page.
Figure 10 ‐ Near‐real time calculation of the Samoa event: on the left the maximum calculated height, on the right the list of identified locations and their height
The system was initialized with an initial maximum height of 3.16m. The maximum height indicated in the calculations is 3.8m in Fagamalo and Poloa and 3.1m in Fagasa, all in the island of Pago‐Pago (American Samoa Islands). This calculation, performed with 2.64 min grid size bathymetry was not able to identify the small island where Niuatoputapu Village is located but a very high energy above that island is shown.
The comparison with the DART shows that the calculation anticipates the signal on the DART by 5 min and the height is overestimated, while it is very close in height for the signal in Pago Pago. Nevertheless, the initial negative wave is not predicted. The reason is in the oversimplified initial condition which does not allow for an initial negative wave. As explained before, the JRC fault model assumes an all positive cosinusoidal shape in order to calculate a worst case scenario for early warning.
While the near‐real time calculations are performed, the users could access the grid pre‐calculations, which should be seen as a preview of the near‐real time calculations. The grid points corresponding to the pre‐calculated scenarios are represented in the figure on the right. The white points
represent the available scenario epicentres, the blue points are the ones that were invoked by the JRC tsunami system as being the ones closest to the epicentres identified by the seismological organizations.
Figure 11 ‐Comparison of sea level in the DART buoy (red) with the near‐real time calculation (blue) .
Figure 12 ‐Comparison of tidal level in Pago Pago for the near‐real time calculation (blue calculation, red data).
The two figures above represent the maximum height in the grid pre‐calculation (left) and in the near‐real time calculation (right). Even if they were performed with slightly different parameters the result is very similar.
5 POST EVENT SIMULATIONS
The following calculations were performed in the days after the event.
Calc. Latitude Limits Longitude Limits Cell size
(min / km) Cells (ncols x nrows)
Time Input from calc.
Pacific wide calculation
1 Pacific ‐60 +60 ‐240 ‐66 4 / 7.4 2614x1804 14 h ‐
Regional calculations
2 Near‐real time calculation ‐29.8 ‐2.4 ‐185.2 ‐158.8 2.64 / 4.8 600x600 ‐
3 Tonga/Samoa ‐23 ‐9 ‐178 ‐167 1 / 1.8 660x840 2 h ‐
4 Samoa ‐17.5 ‐12 ‐174 ‐169 0.5 / 0.9 542x392 2 h ‐
Detailed local calculations
5a Western Samoa ‐14.3 ‐13.3 ‐173 ‐171 0.1 / 0.18 1200x600 1 h 4 5b Pago Pago ‐14.65 ‐14 ‐171.1 ‐170.2 0.1 / 0.18 540x390 1 h 4 5c Niuatoputu, Tonga ‐16.45 ‐15.45 ‐173.99 ‐173.23 0.1 / 0.18 456x600 1 h 4 5d Ofu Tau ‐13.9 ‐13.3 ‐170.1 ‐169.1 0.1 / 0.18 604x380 1h 4 Inundation calculations 6a Pago Pago ‐14.412 ‐14.972 ‐170.972 ‐170.4515 1 / 30 1874x864 1h 5b 6b Pago Pago and Fagasa Bay ‐14.3092 ‐14.2749 ‐170.7317 ‐170.6516 0.166 / 5 1728x740 1h 6a Regional calculations are performed in order to have a quick estimate of the impact of the tsunami. Detailed and more local calculations are needed in order to correctly analyze the local behaviour and estimate the height in specified locations, previously identified by regional calculations as most affected. The detailed calculations are performed with initial and boundary conditions obtained by coarser simulations, as indicated in the last column of the table above. It should be noted that the near‐real time system only performs calculations of the type 2. The reason for performing the more and more detailed calculations in subsequent steps, with smaller window and cell size, is that the CPU time
necessary for a calculation increases as a cubic function of the cell size reduction, i.e., if the cell size is halved and the window remains the same, the CPU time becomes 8 times higher. It is not foreseen for the moment to perform very detailed calculations in near‐real time or with the pre‐calculated grid. The detailed calculations are performed on a case‐ by‐case basis after specific important events, such as this one.
The calculations have been performed with the JRC calculation system powered by different hydraulic models: SWAN, HyFlux2 and TUNAMI (only 1 min grid size calculation, calc. 3 in above table).
Figure 13. Calculations domain for the Pacific basin
5.1 COMPARISON WITH DART MEASUREMENTS
Three DART sensors are available: 51426, 51426, 54401. For the comparison of the DART measurements we used the 1 min calculations (calc. 3 in above table).
Figure 15. Location of DART measurement 51425 Figure 16. Location of DART measurement 51426
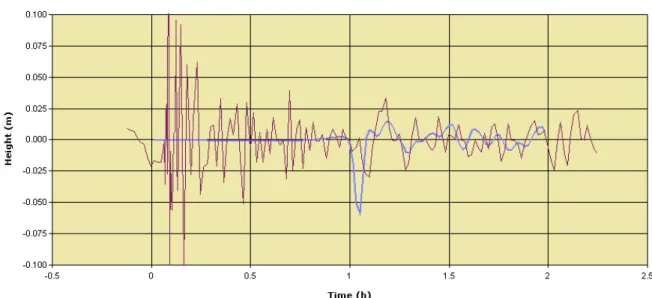
DART sensor 55425, located at latitude ‐9.49 and longitude ‐176.24, is located North of the fault. The comparison with the measurements (Figure 17 for SWAN and Figure 18 for HyFlux2) shows that the initial sea level drop is correctly
reproduced at 1h.
Also the maximum height is well reproduced. In the case of SWAN‐JRC the trend is more oscillatory rather than with HyFlux2 but the peak height of 2.5 cm is well identified.
In the case of NOAA (Figure 19) the initial peak is not negative because the initial NOAA fault shows a positive side on north east. However the maximum peak is well reproduced despite the fact that this is a 4 min simulation.
The TUNAMI simulation (Figure 20) shows results very similar to the SWAN code.
The comparison with DART sensor 51426 (Figure 21 to Figure 24) shows that the initial peak is better reproduced in the NOAA simulation while in the SWAN, Hyflux2 and Tunami simulations, all initialized with the finite fault model the initial peak is negative.
However it should be noted that both SWAN‐JRC, Hyflux2 and TUNAMI reproduce well the oscillations at 1.6 h, which are caused by reflection waves coming from the lower bathymetry section and from the islands of Pago‐Pago.
These oscillations are not present in the NOAA calculation, which had a lower resolution bathymetry (4 min instead of the 1 min grid size bathymetry).
51425
51426
Figure 17 ‐ Comparison of SWAN‐JRC results with data on DART 51425
Figure 19 ‐ Comparison of MOST with data on DART 51425
Figure 21 ‐ Comparison of SWAN‐JRC with data on DART 51426
Figure 23 ‐ Comparison of MOST NOAA with data on DART 51426
Figure 25 ‐ Comparison of SWAN‐JRC with data on DART 54401
Figure 26 ‐ Comparison of NOAA MOST with data on DART 54401
The last measurement, related to DART 54401, shows an initial peak predicted very well by the NOAA calculation and less accurate by SWAN‐JRC simulation. This comparison is performed using the 4 min grid size bathymetry also in the SWAN‐ JRC calculation. It should be noted that this measurement is relatively far from the source: notwithstanding the NOAA curves are performing very well.
5.2 COMPARISON WITH TIDAL MEASUREMENTS
Tidal measurements are generally located very close to the coast or even within ports. Therefore it is necessary to adopt very detailed cells to be able to specify the bathymetry, the shoreline and the possible run‐up topography. The precision of such information’s’ will strongly influence the simulation accuracy, and the capability of the code to reproduce the real phenomena.
If we use a rather coarse simulation (such as the one available with near‐real time calculations) the prediction cannot be accurate, but it can still give qualitative correct information.
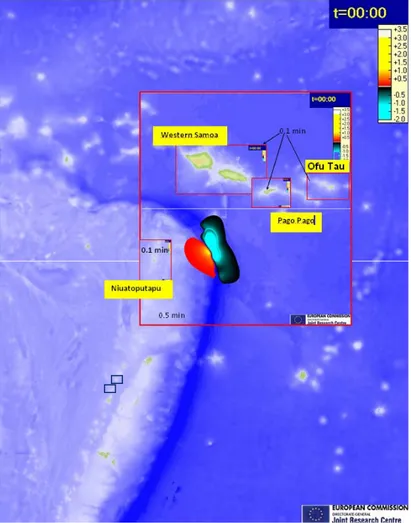
We decided to analyze in detail 4 areas which showed the highest sea level in the coarser results:
• Western Samoa
• Pago Pago, American Samoa
• Niuatoputu, Tonga
• Ofu‐Tau, American Samoa
The simulations are performed adopting a 0.1 min grid size bathymetry.
5.2.1 WESTERN SAMOA
Western Samoa Island has been one of the most affected islands in the archipelago with more than 100 fatalities in the area of Apia.
According to the calculations the greatest wave occurred in the Southern part of the two islands. There is only one measurement point on the island, in the location Apia. Here a maximum of 0.7m or 1.4 from crest to trough was measured. The calculation correctly predicts a maximum level between 0.6 and 0.7 on the Northern part of the island but about 3.1m in Matautu, on the Southern part of the island.
The figure below represents the behaviour of the sea level during the event. It is possible to note that the northern part of the islands is reached at a later time with the lower height. The lower part of the islands show heights between 1.3 and 3.8m. The small island of Manono shows a maximum height of 1m but according to Red Cross this is one of the most affected locations. Probably even a more detailed simulation would be necessary there.
Figure 27 – Maximum Sea level distribution in Western Samoa
Figure 28 – Sea level distribution over time on Western Samoa
Matatu 3.1 m Samatau 3.6 m Salailua 1.3 m Apia 0.7 m Amalie 1.8 m Fagamalo 0.6 m Manono 1.0 m
Figure 29 – Comparison of the measured value (red) and calculated value with SWAN‐JRC (blue) in Apia, Western Samoa
Figure 30 – Comparison of the measured value (red) and calculated value with HyFlux2 (blue) in Apia, Western Samoa
Meas. Unavailable in this period
Meas. Unavailable in this period
5.3 PAGO PAGO
Waterfront in Pago Pago, (John Newton / AFP / Getty Images) Pago Pago was reached by the negative wave about 15 minutes after the event. Local witnesses indicated a water recession4 and then a subsequent increase. According to our calculations the negative section lasted about 7‐8 minutes before the positive wave arrived.
The comparison with the available measurement is extremely good. The water level initially decreases by 3m and then rises of almost the same value. However, it should be noted that the best bathymetry available is 30” (i.e. 1 km) , which was interpolated to 200m to perform these calculations. One can note a slight anticipation of the negative wave, but the real measurement point is within a bay that is not represented by the 30” grid size bathymetry.
The HyFlux2 calculation shows a behaviour similar to SWAN‐JRC, with a slightly higher maximum value for the height. In the figures we also included the NOAA simulation in order to show that – contrary to the tidal measurement – the initial simulated disturbance is positive due to the type of fault adopted. This is only a qualitative comparison, knowing that for any numerical models the simulation accuracy is very poor near the coast when the grid size bathymetry is coarse.
4
… He told me the water receded and then started to rise. It rose to the top of the seawall where the mgmt parks their cars….
Figure 32 ‐ Comparison of measured (red) and calculated (blue) sea level in Pago Pago bay with SWAN‐JRC (see next figure)
Figure 34 ‐ Comparison of measured (red) and calculated (blue) sea level in Pago Pago bay with Hyflux2
Figure 35 ‐ Comparison of measured (red) and calculated (blue) sea level in Pago Pago bay with NOAA‐MOST. This comparison is shown only to show that the initial wave is positive. To have a real comparison it should be necessary to run a detailed analysis with MOST
Figure 36 – Maximum Sea level distribution in Pago Pago Poloa 4 m Vallotai 3.4 m Ulutei 3. m Auniuu 2.9 m Fagamalo 4 m Pago Pago 3. m
5.4 NIUATOPUTU, TONGA
Hihifo, Tonga, (Pesi Fonua / Associated Press)
This island of Niuatoputu is one of the ones most damaged by the tsunami wave which arrived first with a small positive wave , followed by a larger negative wave. The arrival time is about 19 min and the maximum height is about 9m. In this island, even if small, there were 6 fatalities.
14 min 15 min 17 min
19 min 22 min 24 min
Figure 38 – Sea level at Hihifo , Niuatoputu
Figure 39 – Final sea level at Niuatoputu
Hihifo 6.1 m
Falehau 8.8 m
5.5 OFU‐TAU, AMERICAN SAMOA
Ofu and Tau are two small islands located North‐East of Pago Pago. The 0.5” calculations showed high sea levels. Therefore a more detailed analysis was performed and we found that the islands should have experienced waves up to 7m. At the time of writing, no information could be found to confirm these calculations.
Figure 40 – Final sea level in Ofu Tau
Olosega 7 m
Falesau 3.7 m
32 min 34.5 min
6 INUNDATION CALCULATIONS FOR SELECTED AREAS
In order to exploit the capabilities of the HyFlux2 in simulating inundation processes, an attempt was made to analyse a location for which we found a post‐disaster satellite image which can give an idea of the Tsunami wave run‐up. For this type of calculation, extremely detailed maps on bathymetry and topography are required. We found a 5m grid size bathymetry that was used for the calculations. Eventually a nautical map such the one below, for the Pago Pago bay, could be digitized in order to produce even a more detailed bathymetry and topography close to the shoreline bay.
The relevant information to simulate the run‐up processes are a) the bathymetry b) the shoreline and c) the topography. In the Pago Pago bay a bathymetry of 5m grid size resolution has been found in the web (see
http://dusk.geo.orst.edu/djl/samoa/#gmt). Outside the bay the SRTM 30” grid size (~ 900m) bathymetry is used: such information is very poor for distance to the coast lower than half pixel size, i.e. 450m. For topography, the most accurate data are the SRTM 1” data, available for Pago Pago Island (because part of the US territory; for the rest of the world the SRTM 3” data are available). A 200m buffer containing the bathymetry, extrapolated from the shoreline identified by the SRTM 1” data is included. For the inundation simulation a raster map with combined bathymetry and topography is required (see Figure 42). Missing information between these sources (black pixels in the figure) are covered by an inverse distance interpolation.
The results represented in the following figures are obtained using the Hyflux2 code applied in nested calculations with smaller window and finer grid up to 5m cell size.
The first wave is entering the Pago Pago bay on the right and is approaching Fagasa Bay at the top left.
The area shown here is relatively small, measuring about 4x8 km.
The image represents a time of 24 min after the
earthquake.
At 27 min inundation starts in the Fagasa Bay. The
inundation is depicted in pink colour.
At 28 minutes the inundation is occurring also in the Pago Pago bay.
At 31 min the water retracts from the bay, leaving a larger area inundated.
The following waves add new water but do not increase the extent of the inundated area.
Figure 44 – Comparison of the calculated inundation with the extent deduced from satellite images from Digital Globe
The comparison of the calculated inundation extent with the one roughly identified from two satellite images by Digital Globe found on the internet, indicates that the real inundation was wider than calculated one. However it should be noted that: a) these are very preliminary results that needs to be better analysed; b) the bathymetry/topography adopted is obtained from different sources with different accuracy and is strongly affected by the interpolation/extrapolation models adopted; c) some difficulties on georeferencing the images and the calculation results with the Google earth map are evident in the figure
Nevertheless, the Hyflux2 code was able to simulate the inundation in these two inundated areas. In this particular simulation, it is evident that other areas appear flooded, for which we do not have images which can confirm the simulation.
7 CONCLUSIONS
The report highlights the characteristics and the impact of the tsunami occurred in Samoa on 29 September 2009. The report describes the event, the available measurements and the seismological situation of the area.
It was shown that the near‐real time calculations in the GDACS system were able to give a correct preliminary estimate of the dimension of the event, even if the incoming new evaluations of the epicentre location and magnitude from the seismological organizations generated different expected impact from 6 cm to 4m with the last evaluations, performed 1h after the event.
In order to assess the impact and draw a more detailed situation map finer calculations were performed after the event and it was possible to identify the most affected areas. The comparison of the calculations with the few available measurements indicated an accurate estimate. These are the Southern sections of Western Samoa islands, Pago Pago and Niuatoputu islands.
It was also attempted to evaluate the inundation using a detailed model and the results are encouraging. The flooded areas for which we had satellite images were in effect flooded. The extent of the flood was slightly underestimated but the detail and accuracy of the used DEM is probably not sufficient for this level of comparison.
8 REFERENCES
Annunziato, A. 2007 . The Tsunami Assessment Modelling System by the Joint Research Centre, Science of Tsunami Hazards, Volume 26, N. 2 (2007)
Franchello, G., 2008. Modelling shallow water flows by a High Resolution Riemann Solver, EUR 23307 EN ‐ 2008, ISSN 1018‐5593.
http://bookshop.europa.eu/eubookshop/download.action?fileName=LBNA23307ENC_002.pdf&eubphfUid=627660&cata logNbr=LB‐NA‐23307‐EN‐C
Franchello, G., 2009, Shoreline tracking and implicit source terms for a well balanced inundation model. Int. Journal for Numerical Methods in Fluids, in press
http://www3.interscience.wiley.com/journal/122528271/abstract
Okada, Y. 1985. Surface deformation due to shear and tensile faults in a half‐space. Bulletin of the Seismological Society of America. 75. 1135–1154.
Ward, S .N., 2002. Tsunamis, Encyclopedia of Physical Science and Technology, Vol. 17, pp. 175–191, ed. Meyers, R.A., Academic Press.
Pelletier, B., Calmant, S., and Pillet, R., 1998. Current tectonics of the Tonga–New Hebrides region, Earth and Planetary Science Letters 164, 263–276.
9 APPENDIX A – PTWS BULLETINS
9.1 TSUNAMI BULLETIN NUMBER 001
TSUNAMI BULLETIN NUMBER 001
PACIFIC TSUNAMI WARNING CENTER/NOAA/NWS ISSUED AT 1804Z 29 SEP 2009
THIS BULLETIN APPLIES TO AREAS WITHIN AND BORDERING THE PACIFIC OCEAN AND ADJACENT SEAS...EXCEPT ALASKA...BRITISH COLUMBIA... WASHINGTON...OREGON AND CALIFORNIA.
... A TSUNAMI WARNING AND WATCH ARE IN EFFECT ... A TSUNAMI WARNING IS IN EFFECT FOR
AMERICAN SAMOA / SAMOA / NIUE / WALLIS-FUTUNA / TOKELAU / COOK ISLANDS / TONGA / TUVALU / KIRIBATI / KERMADEC IS / FIJI / HOWLAND-BAKER / JARVIS IS. / NEW ZEALAND / FR. POLYNESIA / PALMYRA IS.
A TSUNAMI WATCH IS IN EFFECT FOR
VANUATU / NAURU / MARSHALL IS. / SOLOMON IS. / JOHNSTON IS. / NEW CALEDONIA / KOSRAE / PAPUA NEW GUINEA / HAWAII / POHNPEI / WAKE IS. / PITCAIRN / MIDWAY IS.
FOR ALL OTHER AREAS COVERED BY THIS BULLETIN... IT IS FOR INFORMATION ONLY AT THIS TIME.
THIS BULLETIN IS ISSUED AS ADVICE TO GOVERNMENT AGENCIES. ONLY NATIONAL AND LOCAL GOVERNMENT AGENCIES HAVE THE AUTHORITY TO MAKE DECISIONS REGARDING THE OFFICIAL STATE OF ALERT IN THEIR AREA AND ANY ACTIONS TO BE TAKEN IN RESPONSE.
AN EARTHQUAKE HAS OCCURRED WITH THESE PRELIMINARY PARAMETERS ORIGIN TIME - 1748Z 29 SEP 2009
COORDINATES - 15.3 SOUTH 171.0 WEST DEPTH - SHALLOWER THAN 100 KM LOCATION - SAMOA ISLANDS REGION MAGNITUDE - 7.9
EVALUATION
IT IS NOT KNOWN THAT A TSUNAMI WAS GENERATED. THIS WARNING IS BASED ONLY ON THE EARTHQUAKE EVALUATION. AN EARTHQUAKE OF THIS SIZE HAS THE POTENTIAL TO GENERATE A DESTRUCTIVE TSUNAMI THAT CAN STRIKE COASTLINES NEAR THE EPICENTER WITHIN MINUTES AND MORE DISTANT COASTLINES WITHIN HOURS. AUTHORITIES SHOULD TAKE
APPROPRIATE ACTION IN RESPONSE TO THIS POSSIBILITY. THIS CENTER WILL MONITOR SEA LEVEL DATA FROM GAUGES NEAR THE EARTHQUAKE TO DETERMINE IF A TSUNAMI WAS GENERATED AND ESTIMATE THE SEVERITY OF THE THREAT.
ESTIMATED INITIAL TSUNAMI WAVE ARRIVAL TIMES AT FORECAST POINTS WITHIN THE WARNING AND WATCH AREAS ARE GIVEN BELOW. ACTUAL ARRIVAL TIMES MAY DIFFER AND THE INITIAL WAVE MAY NOT BE THE LARGEST. A TSUNAMI IS A SERIES OF WAVES AND THE TIME BETWEEN
SUCCESSIVE WAVES CAN BE FIVE MINUTES TO ONE HOUR.
LOCATION FORECAST POINT COORDINATES ARRIVAL TIME --- --- --- AMERICAN SAMOA PAGO PAGO 14.3S 170.7W 1759Z 29 SEP SAMOA APIA 13.8S 171.8W 1810Z 29 SEP NIUE NIUE IS. 19.0S 170.0W 1822Z 29 SEP WALLIS-FUTUNA WALLIS IS. 13.2S 176.2W 1835Z 29 SEP TOKELAU NUKUNONU IS. 9.2S 171.8W 1844Z 29 SEP COOK ISLANDS PUKAPUKA IS. 10.8S 165.9W 1846Z 29 SEP RAROTONGA 21.2S 159.8W 1929Z 29 SEP PENRYN IS. 8.9S 157.8W 1954Z 29 SEP TONGA NUKUALOFA 21.0S 175.2W 1851Z 29 SEP TUVALU FUNAFUTI IS. 7.9S 178.5E 1932Z 29 SEP KIRIBATI KANTON IS. 2.8S 171.7W 1935Z 29 SEP FLINT IS. 11.4S 151.8W 2025Z 29 SEP MALDEN IS. 3.9S 154.9W 2037Z 29 SEP CHRISTMAS IS. 2.0N 157.5W 2100Z 29 SEP TARAWA IS. 1.5N 173.0E 2104Z 29 SEP KERMADEC IS RAOUL IS. 29.2S 177.9W 1938Z 29 SEP FIJI SUVA 18.1S 178.4E 2003Z 29 SEP HOWLAND-BAKER HOWLAND IS. 0.6N 176.6W 2008Z 29 SEP JARVIS IS. JARVIS IS. 0.4S 160.1W 2028Z 29 SEP NEW ZEALAND EAST CAPE 37.7S 178.5E 2044Z 29 SEP GISBORNE 38.7S 178.0E 2100Z 29 SEP NORTH CAPE 34.4S 173.3E 2112Z 29 SEP NAPIER 39.5S 176.9E 2140Z 29 SEP WELLINGTON 41.3S 174.8E 2150Z 29 SEP AUCKLAND(E) 36.7S 175.0E 2212Z 29 SEP AUCKLAND(W) 37.1S 174.2E 2239Z 29 SEP LYTTELTON 43.6S 172.7E 2255Z 29 SEP NEW PLYMOUTH 39.1S 174.1E 2317Z 29 SEP NELSON 41.3S 173.3E 2323Z 29 SEP DUNEDIN 45.9S 170.5E 2331Z 29 SEP MILFORD SOUND 44.6S 167.9E 2358Z 29 SEP WESTPORT 41.8S 171.6E 2359Z 29 SEP FR. POLYNESIA PAPEETE 17.5S 149.6W 2045Z 29 SEP HIVA OA 10.0S 139.0W 2214Z 29 SEP RIKITEA 23.1S 135.0W 2247Z 29 SEP PALMYRA IS. PALMYRA IS. 6.3N 162.4W 2102Z 29 SEP VANUATU ANATOM IS. 20.2S 169.9E 2117Z 29 SEP ESPERITU SANTO 15.1S 167.3E 2123Z 29 SEP NAURU NAURU 0.5S 166.9E 2138Z 29 SEP MARSHALL IS. MAJURO 7.1N 171.4E 2147Z 29 SEP KWAJALEIN 8.7N 167.7E 2220Z 29 SEP ENIWETOK 11.4N 162.3E 2309Z 29 SEP SOLOMON IS. KIRAKIRA 10.4S 161.9E 2155Z 29 SEP GHATERE 7.8S 159.2E 2227Z 29 SEP AUKI 8.8S 160.6E 2244Z 29 SEP HONIARA 9.3S 160.0E 2244Z 29 SEP PANGGOE 6.9S 157.2E 2245Z 29 SEP MUNDA 8.4S 157.2E 2248Z 29 SEP FALAMAE 7.4S 155.6E 2304Z 29 SEP JOHNSTON IS. JOHNSTON IS. 16.7N 169.5W 2212Z 29 SEP NEW CALEDONIA NOUMEA 22.3S 166.5E 2216Z 29 SEP KOSRAE KOSRAE IS. 5.5N 163.0E 2233Z 29 SEP PAPUA NEW GUINE KIETA 6.1S 155.6E 2303Z 29 SEP AMUN 6.0S 154.7E 2323Z 29 SEP RABAUL 4.2S 152.3E 2349Z 29 SEP HAWAII NAWILIWILI 22.0N 159.4W 2311Z 29 SEP HILO 19.7N 155.1W 2314Z 29 SEP HONOLULU 21.3N 157.9W 2315Z 29 SEP POHNPEI POHNPEI IS. 7.0N 158.2E 2318Z 29 SEP WAKE IS. WAKE IS. 19.3N 166.6E 2322Z 29 SEP
PITCAIRN PITCAIRN IS. 25.1S 130.1W 2329Z 29 SEP MIDWAY IS. MIDWAY IS. 28.2N 177.4W 2349Z 29 SEP BULLETINS WILL BE ISSUED HOURLY OR SOONER IF CONDITIONS WARRANT. THE TSUNAMI WARNING AND WATCH WILL REMAIN IN EFFECT UNTIL
FURTHER NOTICE.
THE WEST COAST/ALASKA TSUNAMI WARNING CENTER WILL ISSUE PRODUCTS FOR ALASKA...BRITISH COLUMBIA...WASHINGTON...OREGON...CALIFORNIA.
9.2 TSUNAMI BULLETIN NUMBER 002
TSUNAMI BULLETIN NUMBER 002
PACIFIC TSUNAMI WARNING CENTER/NOAA/NWS ISSUED AT 1856Z 29 SEP 2009
THIS BULLETIN APPLIES TO AREAS WITHIN AND BORDERING THE PACIFIC OCEAN AND ADJACENT SEAS...EXCEPT ALASKA...BRITISH COLUMBIA... WASHINGTON...OREGON AND CALIFORNIA.
... A TSUNAMI WARNING AND WATCH ARE IN EFFECT ... A TSUNAMI WARNING IS IN EFFECT FOR
AMERICAN SAMOA / SAMOA / NIUE / WALLIS-FUTUNA / TOKELAU / COOK ISLANDS / TONGA / TUVALU / KIRIBATI / KERMADEC IS / FIJI / HOWLAND-BAKER / JARVIS IS. / NEW ZEALAND / FR. POLYNESIA / PALMYRA IS. / VANUATU / NAURU / MARSHALL IS. / SOLOMON IS. A TSUNAMI WATCH IS IN EFFECT FOR
JOHNSTON IS. / NEW CALEDONIA / KOSRAE / PAPUA NEW GUINEA / HAWAII / POHNPEI / WAKE IS. / PITCAIRN / MIDWAY IS. / CHUUK / AUSTRALIA
FOR ALL OTHER AREAS COVERED BY THIS BULLETIN... IT IS FOR INFORMATION ONLY AT THIS TIME.
THIS BULLETIN IS ISSUED AS ADVICE TO GOVERNMENT AGENCIES. ONLY NATIONAL AND LOCAL GOVERNMENT AGENCIES HAVE THE AUTHORITY TO MAKE DECISIONS REGARDING THE OFFICIAL STATE OF ALERT IN THEIR AREA AND ANY ACTIONS TO BE TAKEN IN RESPONSE.
AN EARTHQUAKE HAS OCCURRED WITH THESE PRELIMINARY PARAMETERS NOTE THE MAGNITUDE UPGRADE TO 8.3
ORIGIN TIME - 1748Z 29 SEP 2009 COORDINATES - 15.3 SOUTH 171.0 WEST DEPTH - 33 KM
LOCATION - SAMOA ISLANDS REGION MAGNITUDE - 8.3
MEASUREMENTS OR REPORTS OF TSUNAMI WAVE ACTIVITY
GAUGE LOCATION LAT LON TIME AMPL PER --- --- --- --- --- --- APIA UPOLU WS 13.8S 171.8W 1832Z 0.70M / 2.3FT 08MIN PAGO PAGO AS 14.3S 170.7W 1812Z 1.57M / 5.1FT 04MIN LAT - LATITUDE (N-NORTH, S-SOUTH)
LON - LONGITUDE (E-EAST, W-WEST)
TIME - TIME OF THE MEASUREMENT (Z IS UTC IS GREENWICH TIME) AMPL - TSUNAMI AMPLITUDE MEASURED RELATIVE TO NORMAL SEA LEVEL. IT IS ...NOT... CREST-TO-TROUGH WAVE HEIGHT.
VALUES ARE GIVEN IN BOTH METERS(M) AND FEET(FT).
PER - PERIOD OF TIME IN MINUTES(MIN) FROM ONE WAVE TO THE NEXT. EVALUATION
SEA LEVEL READINGS INDICATE A TSUNAMI WAS GENERATED. IT MAY HAVE BEEN DESTRUCTIVE ALONG COASTS NEAR THE EARTHQUAKE EPICENTER AND
COULD ALSO BE A THREAT TO MORE DISTANT COASTS. AUTHORITIES SHOULD TAKE APPROPRIATE ACTION IN RESPONSE TO THIS POSSIBILITY. THIS CENTER WILL CONTINUE TO MONITOR SEA LEVEL DATA TO DETERMINE THE EXTENT AND SEVERITY OF THE THREAT.
FOR ALL AREAS - WHEN NO MAJOR WAVES ARE OBSERVED FOR TWO HOURS AFTER THE ESTIMATED TIME OF ARRIVAL OR DAMAGING WAVES HAVE NOT OCCURRED FOR AT LEAST TWO HOURS THEN LOCAL AUTHORITIES CAN ASSUME THE THREAT IS PASSED. DANGER TO BOATS AND COASTAL STRUCTURES CAN CONTINUE FOR SEVERAL HOURS DUE TO RAPID CURRENTS. AS LOCAL
CONDITIONS CAN CAUSE A WIDE VARIATION IN TSUNAMI WAVE ACTION THE ALL CLEAR DETERMINATION MUST BE MADE BY LOCAL AUTHORITIES.
ESTIMATED INITIAL TSUNAMI WAVE ARRIVAL TIMES AT FORECAST POINTS WITHIN THE WARNING AND WATCH AREAS ARE GIVEN BELOW. ACTUAL ARRIVAL TIMES MAY DIFFER AND THE INITIAL WAVE MAY NOT BE THE LARGEST. A TSUNAMI IS A SERIES OF WAVES AND THE TIME BETWEEN SUCCESSIVE WAVES CAN BE FIVE MINUTES TO ONE HOUR.
LOCATION FORECAST POINT COORDINATES ARRIVAL TIME --- --- --- AMERICAN SAMOA PAGO PAGO 14.3S 170.7W 1759Z 29 SEP SAMOA APIA 13.8S 171.8W 1810Z 29 SEP NIUE NIUE IS. 19.0S 170.0W 1822Z 29 SEP WALLIS-FUTUNA WALLIS IS. 13.2S 176.2W 1835Z 29 SEP TOKELAU NUKUNONU IS. 9.2S 171.8W 1844Z 29 SEP COOK ISLANDS PUKAPUKA IS. 10.8S 165.9W 1846Z 29 SEP RAROTONGA 21.2S 159.8W 1929Z 29 SEP PENRYN IS. 8.9S 157.8W 1954Z 29 SEP TONGA NUKUALOFA 21.0S 175.2W 1851Z 29 SEP TUVALU FUNAFUTI IS. 7.9S 178.5E 1932Z 29 SEP KIRIBATI KANTON IS. 2.8S 171.7W 1935Z 29 SEP FLINT IS. 11.4S 151.8W 2025Z 29 SEP MALDEN IS. 3.9S 154.9W 2037Z 29 SEP CHRISTMAS IS. 2.0N 157.5W 2100Z 29 SEP TARAWA IS. 1.5N 173.0E 2104Z 29 SEP KERMADEC IS RAOUL IS. 29.2S 177.9W 1938Z 29 SEP FIJI SUVA 18.1S 178.4E 2003Z 29 SEP HOWLAND-BAKER HOWLAND IS. 0.6N 176.6W 2008Z 29 SEP JARVIS IS. JARVIS IS. 0.4S 160.1W 2028Z 29 SEP NEW ZEALAND EAST CAPE 37.7S 178.5E 2044Z 29 SEP GISBORNE 38.7S 178.0E 2100Z 29 SEP NORTH CAPE 34.4S 173.3E 2112Z 29 SEP NAPIER 39.5S 176.9E 2140Z 29 SEP WELLINGTON 41.3S 174.8E 2150Z 29 SEP AUCKLAND(E) 36.7S 175.0E 2212Z 29 SEP AUCKLAND(W) 37.1S 174.2E 2239Z 29 SEP LYTTELTON 43.6S 172.7E 2255Z 29 SEP NEW PLYMOUTH 39.1S 174.1E 2317Z 29 SEP NELSON 41.3S 173.3E 2323Z 29 SEP DUNEDIN 45.9S 170.5E 2331Z 29 SEP MILFORD SOUND 44.6S 167.9E 2358Z 29 SEP WESTPORT 41.8S 171.6E 2359Z 29 SEP BLUFF 46.6S 168.3E 0044Z 30 SEP FR. POLYNESIA PAPEETE 17.5S 149.6W 2045Z 29 SEP HIVA OA 10.0S 139.0W 2214Z 29 SEP RIKITEA 23.1S 135.0W 2247Z 29 SEP PALMYRA IS. PALMYRA IS. 6.3N 162.4W 2102Z 29 SEP VANUATU ANATOM IS. 20.2S 169.9E 2117Z 29 SEP ESPERITU SANTO 15.1S 167.3E 2123Z 29 SEP NAURU NAURU 0.5S 166.9E 2138Z 29 SEP MARSHALL IS. MAJURO 7.1N 171.4E 2147Z 29 SEP KWAJALEIN 8.7N 167.7E 2220Z 29 SEP ENIWETOK 11.4N 162.3E 2309Z 29 SEP
SOLOMON IS. KIRAKIRA 10.4S 161.9E 2155Z 29 SEP GHATERE 7.8S 159.2E 2227Z 29 SEP AUKI 8.8S 160.6E 2244Z 29 SEP HONIARA 9.3S 160.0E 2244Z 29 SEP PANGGOE 6.9S 157.2E 2245Z 29 SEP MUNDA 8.4S 157.2E 2248Z 29 SEP FALAMAE 7.4S 155.6E 2304Z 29 SEP JOHNSTON IS. JOHNSTON IS. 16.7N 169.5W 2212Z 29 SEP NEW CALEDONIA NOUMEA 22.3S 166.5E 2216Z 29 SEP KOSRAE KOSRAE IS. 5.5N 163.0E 2233Z 29 SEP PAPUA NEW GUINE KIETA 6.1S 155.6E 2303Z 29 SEP AMUN 6.0S 154.7E 2323Z 29 SEP RABAUL 4.2S 152.3E 2349Z 29 SEP LAE 6.8S 147.0E 0015Z 30 SEP KAVIENG 2.5S 150.7E 0016Z 30 SEP PORT MORESBY 9.3S 146.9E 0039Z 30 SEP MADANG 5.2S 145.8E 0041Z 30 SEP MANUS IS. 2.0S 147.5E 0050Z 30 SEP HAWAII NAWILIWILI 22.0N 159.4W 2311Z 29 SEP HILO 19.7N 155.1W 2314Z 29 SEP HONOLULU 21.3N 157.9W 2315Z 29 SEP POHNPEI POHNPEI IS. 7.0N 158.2E 2318Z 29 SEP WAKE IS. WAKE IS. 19.3N 166.6E 2322Z 29 SEP PITCAIRN PITCAIRN IS. 25.1S 130.1W 2329Z 29 SEP MIDWAY IS. MIDWAY IS. 28.2N 177.4W 2349Z 29 SEP CHUUK CHUUK IS. 7.4N 151.8E 0020Z 30 SEP AUSTRALIA BRISBANE 27.2S 153.3E 0036Z 30 SEP SYDNEY 33.9S 151.4E 0038Z 30 SEP BULLETINS WILL BE ISSUED HOURLY OR SOONER IF CONDITIONS WARRANT. THE TSUNAMI WARNING AND WATCH WILL REMAIN IN EFFECT UNTIL
FURTHER NOTICE.
THE WEST COAST/ALASKA TSUNAMI WARNING CENTER WILL ISSUE PRODUCTS FOR ALASKA...BRITISH COLUMBIA...WASHINGTON...OREGON...CALIFORNIA.
9.3 TSUNAMI BULLETIN NUMBER 003
TSUNAMI BULLETIN NUMBER 003
PACIFIC TSUNAMI WARNING CENTER/NOAA/NWS ISSUED AT 2022Z 29 SEP 2009
THIS BULLETIN APPLIES TO AREAS WITHIN AND BORDERING THE PACIFIC OCEAN AND ADJACENT SEAS...EXCEPT ALASKA...BRITISH COLUMBIA... WASHINGTON...OREGON AND CALIFORNIA.
... A TSUNAMI WARNING AND WATCH ARE IN EFFECT ... A TSUNAMI WARNING IS IN EFFECT FOR
AMERICAN SAMOA / SAMOA / NIUE / WALLIS-FUTUNA / TOKELAU / COOK ISLANDS / TONGA / TUVALU / KIRIBATI / KERMADEC IS / FIJI / HOWLAND-BAKER / JARVIS IS. / NEW ZEALAND / FR. POLYNESIA / PALMYRA IS. / VANUATU / NAURU / MARSHALL IS. / SOLOMON IS. / JOHNSTON IS. / NEW CALEDONIA / KOSRAE / PAPUA NEW GUINEA / POHNPEI / WAKE IS.
A TSUNAMI WATCH IS IN EFFECT FOR
PITCAIRN / MIDWAY IS. / CHUUK / AUSTRALIA / MARCUS IS. / N. MARIANAS / GUAM / INDONESIA / ANTARCTICA / YAP
FOR ALL OTHER AREAS COVERED BY THIS BULLETIN... IT IS FOR INFORMATION ONLY AT THIS TIME.
THIS BULLETIN IS ISSUED AS ADVICE TO GOVERNMENT AGENCIES. ONLY NATIONAL AND LOCAL GOVERNMENT AGENCIES HAVE THE AUTHORITY TO MAKE DECISIONS REGARDING THE OFFICIAL STATE OF ALERT IN THEIR AREA AND ANY ACTIONS TO BE TAKEN IN RESPONSE.
AN EARTHQUAKE HAS OCCURRED WITH THESE PRELIMINARY PARAMETERS ORIGIN TIME - 1748Z 29 SEP 2009
COORDINATES - 15.3 SOUTH 171.0 WEST DEPTH - 33 KM
LOCATION - SAMOA ISLANDS REGION MAGNITUDE - 8.3
MEASUREMENTS OR REPORTS OF TSUNAMI WAVE ACTIVITY
GAUGE LOCATION LAT LON TIME AMPL PER --- --- --- --- --- --- RAROTONGA CK 21.2S 159.8W 1951Z 0.47M / 1.5FT 08MIN APIA UPOLU WS 13.8S 171.8W 1832Z 0.70M / 2.3FT 08MIN PAGO PAGO AS 14.3S 170.7W 1812Z 1.57M / 5.1FT 04MIN LAT - LATITUDE (N-NORTH, S-SOUTH)
LON - LONGITUDE (E-EAST, W-WEST)
TIME - TIME OF THE MEASUREMENT (Z IS UTC IS GREENWICH TIME) AMPL - TSUNAMI AMPLITUDE MEASURED RELATIVE TO NORMAL SEA LEVEL. IT IS ...NOT... CREST-TO-TROUGH WAVE HEIGHT.
VALUES ARE GIVEN IN BOTH METERS(M) AND FEET(FT).
PER - PERIOD OF TIME IN MINUTES(MIN) FROM ONE WAVE TO THE NEXT. EVALUATION
SEA LEVEL READINGS INDICATE A TSUNAMI WAS GENERATED. IT MAY HAVE BEEN DESTRUCTIVE ALONG COASTS NEAR THE EARTHQUAKE EPICENTER AND