___________________________
Corresponding author: Danijela Ristić Maize Research Institute „Zemun Polje“, Slobodana Bajića 1, 11185 Zemun Polje, tel 0113756704, fax 011 3756707,[email protected]
UDC 575:633.15 DOI: 10.2298/GENSR1303811R
Original scientific paper
GENETIC DIVERSITY IN MAIZE DENT LANDRACES ASSESSED BY MORPHOLOGICAL AND MOLECULAR MARKERS
Danijela RISTIĆ, Vojka BABIĆ, Violeta ANĐELKOVIĆ, Jelena VANČETOVIĆ, Snežana MLADENOVIĆ DRINIĆ, Dragana IGNJATOVIĆ-MICIĆ
Maize Research Institute „Zemun Polje“, Belgrade, Serbia
Ristić D., V Babić, V. Anđelković, J. Vančetović, S. Mladenović Drinić and D. Ignjatović Micić (2013): Genetic diversity in maize dent landraces assessed by morphological and molecular markers Genetika, Vol 45, No. 3,
811-824.
Maize Research Institute “Zemun Polje” genebank maintains a collection of landraces grouped into 18 agro-ecological collected from ex-Yugoslavia territories. The application and comparison of different marker systems are important for the characterization and use of maize landraces in breeding program, as potential sources of desirable traits. In this study, 15 morphological traits, 7 RAPD primers and 10 SSR primer pairs were applied to i) to determine genetic distance between 21 maize dent landraces and ii) compare results obtained on morphological and molecular markers. Phenotypic analysis showed high level of heterogeneity between landraces. Higher level of genetic diversity was obtained with SSR than with RAPD. Genetic distance mean value for RAPD data was 0.35 i.e. for SSR 0.48. Based on the morphological traits and molecular markers, unweighted pairgroup method (UPGMA) analysis was applied for cluster analysis, using statistical NTSYSpc program package. Cluster analysis of morphological and molecular markers distances did not show the same population grouping. Better agreement with agro-ecological data was obtained with RAPD markers. Correlations between dissimilarity matrices for different types of markers were low. Data obtained in this work could be useful for further study of a larger number of landraces, and conservation of genetic resources and their genetic diversity.
Key words: maize dent landraces, RAPD, SSR
INTRODUCTION
Maize landraces from former Yugoslavia orginate from races of Central, North and South America and they came to this part of the world trough several introduction. The first maize types, consisting of flint races, were introduced in the XVI century from Caribbean slands.
812 GENETIKA, Vol. 45, No.3,811-824, 2013
he second introduction (XVI century) included flint races orginating from Mexico and the Andes. Hybridization between new and existing flint races increased maize adaptability to the local agro-ecological conditions.
New flint races from Canada and North America were brought to Slavonija and North America in the XVIII century (third introduction). These landraces were better adapted to cooler conditions and thus spread in the mountain regions. The first dent races were introduced to former Yugoslavia at the end of the XIX century and in the early XX century, and they belonged to the USA Corn Belt Dents (fourth introduction). Dent races were spreading rapidly suppressing flint races. Natural hybridization between flint and dent landraces resulted in development of Yugoslavia Corn Belt maize and that was the last natural hybridization important for the evolution of maize in Europe (BABICet al., 2012, and references therein).
Modern and future maize breeding depends upon genetic sources of desirable traits, which are maintained within existing gene banks germplasm. The material from the Maize Research Institute gene bank offers great opportunities for breeding, considering its size and content – it is among the ten largest maize gene banks in the world. The first significant collecting of maize landraces in ex-Yugoslavia started in 1960s. Today, Maize Reserche Institute „Zemun Polje“ maintains the collection of 2217 maize landraces. Using the method of natural cassification (ANDERSON and CUTLER, 1942) all Yugoslavian landraces were devided into 18 agro-ecological groups (PAVLICIC and TRIFUNOVIC, 1966).
Characterization of landraces that are stored in gene banks is essential for their optimal use and maintenance, as well as their conservation. Assessment of genetic variability can be used to identify new sources of germplasm, which by crosses with existing commercial varieties may lead to a further increase in maize yield (BRACCOet al., 2009; CÖMMERTRAY et al., 2012).
Morphological markers were among the earliest markers used in evaluation of maize landraces. However, they have limited application because: morphological variability is often restricted, morphological traits may not be obvious at all stages of the plant development, influence of environment on their expression is strong and they show low polymorphism (LEGESSE et al., 1992, and references therein). On the other hand, molecular markers are
independent from environment and they provide estimation of genetic diversity at the DNA level (REIFet al., 2003). Random amplified polymorphic DNA (RAPD) markers are simple, relatively
easy, speedy to use, with high degree of polymorphism. Simple sequence repeats (SSRs) are frequently used molecular markers, codominant and highly informative. Because of their high polymorphism SSR are useful in large-scale DNA fingerprinting of maize landraces (ANDJELKOVIC and IGNJATOVIC-MICIC, 2012, and references therein).
The aim of this study was to estimate the genetic diversety and relationships between 21 maize dent landraces using morphological, RAPD and SSR markers, in order to i) determine genetic distance between the landraces and ii) compare results based on morphological, RAPD and SSR markers.
MATERIALS AND METHODS Plant material
A set of 21 maize dent landraces was analyzed, with three landraces per the following agro-ecological group: Bosnian early dents (BD), Eight-rowed soft dents (ED), Dent Type of USA Corn Belt dents (DA), Derived dents (DD), Dent Type of Southern areas of USA (DSA), Serbian dents (SD) and Flinty dents (FD). The analyzed accessions are presented in Table 1.
Table 1. List of 21 maize dent landraces used in the study for morphological and molecular analyis No. Agro-ecological group Abbreviation for group Group
no. Accession Abbreviation for landraces Collection site 1 Bosnian early dents 2 Narandzasti viseredi tvrdunac BD1 Serbia
2 BD Zuti polutvrdunac BD2 Bosnia
3 Svetlozuti tvrdunac BD3 Bosnia
4
Eight-row
soft dents 9
Zuti stodanac ED1 Srebia
5 ED Beli plocan ED2 Serbia
6 Stakleni zolti ED3 Serbia
7 Dent Type of USA Corn Belt dents
13
Topciderac DA1 Serbia
8 DA Sidski zuban DA2 Serbia
9 Sumadijski beli DA3 Serbia
10
Derived
Dents 14
Moravac zuban DD1 Serbia
11 DD NS 26 DD2 Serbia 12 NS 29 DD3 Serbia 13 Dent Type of Southern areas of USA 15
Zuti zuban DSA1 Croatia
14 DSA Bjeli kukuruz DSA2 Croatia
15 Dentoze DSA3 Croatia
16
Serbian
dents 16
Zuti zuban SD1 Croatia
17 SD Crveni zuban SD2 Serbia
18 Domaci beli zuban SD3 Serbia
19 Flinty dents 17 Moravac kolomeci kuc FD1 Serbia 20 FD Bjelac zuban FD2 Serbia
814 GENETIKA, Vol. 45, No.3,811-824, 2013 Field Experiment and Morphological Traits
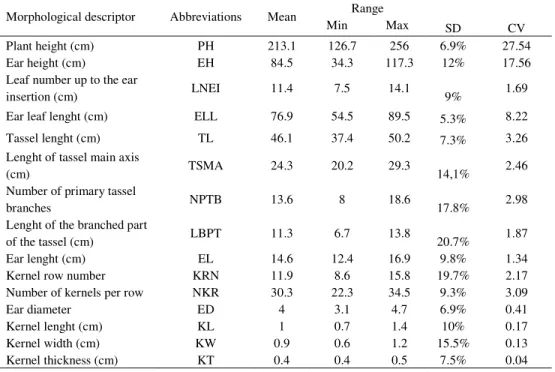
Landraces were tested in four-replicate trials set up according Randomized Complete Block Design (RCBD), four rows per replica and 20 plants per row. Twenty plants per replica were randomly selected and 15 morphological and agronomical traits were recorded. The 15 traits were: plant height (PH), ear height (EH), leaf number up to the ear insertion (LNEI), ear leaf lenght (ELL), tassel lenght (TL), lenght of tassel main axis (TSMA), number of primary tassel branches (NPTB), lenght of the branched part of the tassel (LBPT), ear lenght (EL), kernel row number (KRN), number of kernels per row (NKR), ear diameter (ED), kernel lenght (KL), kernel width (KW), kernel thickness (KT). Information on the phenotipic traits are given in Table 2.
Table 2. Abbreviations, mean, range, standard deviation (SD) and Coefficients of variation
Molecular Analysis DNA isolation
Genomic DNA was isolated from seed bulk using the CTAB procedure according to
SAGHAI-MAROOF et al. (1984). Bulks were prepared by pooling an equal amount of flour
obtained by grounding 30 seeds per population. RAPD analysis
Ten RAPD primers were tested and seven polymorphic primers were selected (Table 3). The PCR reaction was carried out in 25 µl reaction mixture containing 2.5 mM MgCl2, 100 µM
Morphological descriptor Abbreviations Mean Range
Min Max SD CV Plant height (cm) PH 213.1 126.7 256 6.9% 27.54 Ear height (cm) EH 84.5 34.3 117.3 12% 17.56 Leaf number up to the ear
insertion (cm) LNEI 11.4 7.5 14.1 9% 1.69 Ear leaf lenght (cm) ELL 76.9 54.5 89.5 5.3% 8.22 Tassel lenght (cm) TL 46.1 37.4 50.2 7.3% 3.26 Lenght of tassel main axis
(cm) TSMA 24.3 20.2 29.3 14,1% 2.46 Number of primary tassel
branches NPTB 13.6 8 18.6 17.8% 2.98 Lenght of the branched part
of the tassel (cm) LBPT 11.3 6.7 13.8 20.7% 1.87 Ear lenght (cm) EL 14.6 12.4 16.9 9.8% 1.34 Kernel row number KRN 11.9 8.6 15.8 19.7% 2.17 Number of kernels per row NKR 30.3 22.3 34.5 9.3% 3.09 Ear diameter ED 4 3.1 4.7 6.9% 0.41 Kernel lenght (cm) KL 1 0.7 1.4 10% 0.17 Kernel width (cm) KW 0.9 0.6 1.2 15.5% 0.13 Kernel thickness (cm) KT 0.4 0.4 0.5 7.5% 0.04
dNTPs, 0.2 µM of 10-mer primers, 2.5 U of Taq polymerase (Fermentas) and 50 ng of template
DNA using a thermocycler Biometra TProfessional Standard 96. Amplification reaction was performed by initial denaturation step at 94°C for 2 min, followed by 45 cycles at 94°C for 30 s, 40°C for 1 min and 72°C for 1 min, and a final elongation at 72°C for 7 min. The amplified products were separated by electrophoresis on 1.4% agarose gels in 0.5 x TBE buffer. As a marker 1kb ladder DNA was used. Gels were run on horizontal gel system (DNA Sub-Cell Bio Rad) at 40mA for 2h and photographed under UV light after staining with 0.5 µg/µl ethidium bromide.
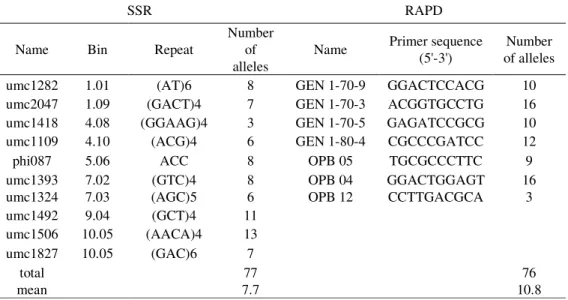
Table 3. List of primers used in SSR (name, bin, repeat and number of alleles) and RAPD (name, primer sequence and number of alleles) analysis of 21 maize dent landraces
SSR Analysis
Simple sequence repeat (SSR) analysis was done with 15 primer pairs on bulked DNA samples for each population. A set of 10 primers which gave scorable bands were chosen for the analysis (Table 3). Polymerase chain reaction was carried out in 25µl reaction volume containing: DreamTaq™ Green PCR Master Mix (2X), 0.5µM primers and 50ng of DNA. Amplifications were performd in thermocycler Biometra TProfessional Standard 96 with the following touch-down program: an initial denaturation at 95ºC/5min, followed by 15 cycles each of denaturation at 95 ºC /30 s, annealing at 63.5 ºC/1min (-0.5 ºC/cycle) and extension at 72 ºC /1min; another 22 cycles of 95 ºC /30 s, 56ºC/1min and 72ºC/1min were performed. Final elongation was at 72°C for 4 min. The amplified fragments were resolved by electrophoresis on 8% polyacrylamide gel, with 100bp ladder as a marker. Gels were run on small format (7,3x10cm) vertical gel system (Mini Protean Tetra-Cell BioRad) at 40mA for 1,5h. After staining with 0.5 µg/µl ethidium bromide they were photographed under UV light.
SSR RAPD
Name Bin Repeat
Number of alleles Name Primer sequence (5'-3') Number of alleles
umc1282 1.01 (AT)6 8 GEN 1-70-9 GGACTCCACG 10
umc2047 1.09 (GACT)4 7 GEN 1-70-3 ACGGTGCCTG 16
umc1418 4.08 (GGAAG)4 3 GEN 1-70-5 GAGATCCGCG 10
umc1109 4.10 (ACG)4 6 GEN 1-80-4 CGCCCGATCC 12
phi087 5.06 ACC 8 OPB 05 TGCGCCCTTC 9
umc1393 7.02 (GTC)4 8 OPB 04 GGACTGGAGT 16
umc1324 7.03 (AGC)5 6 OPB 12 CCTTGACGCA 3
umc1492 9.04 (GCT)4 11
umc1506 10.05 (AACA)4 13
umc1827 10.05 (GAC)6 7
total 77 76
816 GENETIKA, Vol. 45, No.3,811-824, 2013
Statistical analysis
Analyses of variance were performed on each morphological trait to test the significance of variation between landraces. Coefficients of variation (CVs) were calculated to determine variations in different traits. Morphological data matrix was constructed on average values of 15 morphological traits and their standard deviations. Cluster analysis was conducted using square Euclidean distance and complete linkage method. Principal Component Analysis (PCA) was carried out based on the phenotypic correlation matrix of the adjusted means of the populations for the 15 descriptors using SPSS 16.0 (http://spss-for-windows-evaluation-version.software.informer.com/). The matrix of distances between populations was calculated upon the standardized principal components with eigenvalue higher than one. Common components coefficients, eigenvector values and cumulative proportions of the total variance expressed by single traits were calculated. Traits with a correlation >0.7 were considered as relevant for that component.
RAPD and SSR profiles were scored as presence/absence of fragments in each sample and the data were assembled into a binary matrix. Genetic distances between populations were evaluated by NEI and LI (1979). Unweighted Pair Group Method with Arithmetic mean (UPGMA) method was applied for cluster analysis. All marker data analyses were performed using statistical NTSYSpc2 program package(ROHLF FJ, 2000).
Pearson’s correlation coefficient was used to determine relationship between the Euclidian distance matrix based on morphology traits and Nei and Li distance matrices obtained with RAPD and SSR markers by MANTEL (1967) method using NTSYSpc2 software.
RESULTS Morphological analysis
Phenotypic analysis showed high level of heterogeneity between landraces. Number of primary tassel branches, lenght of the branched part of the tassel, kernel row number and kernel width revealed wide variation. CV for these traits ranged from 15.5% to 20.7%. The narrowest variation was found for ear leef length traits, with CV value 5.3% (Table 2).
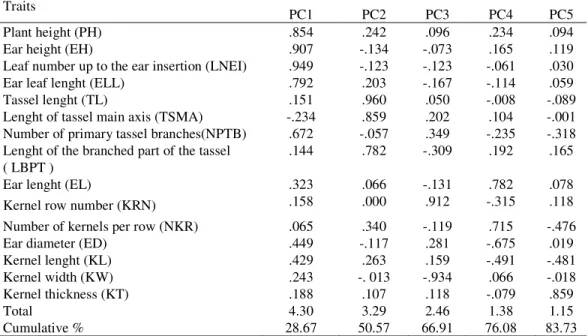
The values of the PCA for all morphological traits are shown in Table 4. The first five principal components accounted for 83.73% of the total variation. In the first PC (28,66%) PH, EH, LNEI and ELL were the most important traits. In the second PC (21.91%) predominant traits were TL, TSMA and LBPT. The third PC (16.34%) described variation in KRN, the fourth (9.17%) PC described variation in EL and NKR and the fifth (7.65%) PC was dominated by KT. The analyzed landraces were plotted in the area defined by the first two PC (Figure 1). All DD landraces had positive and all BD landraces had negative PC1 value. Two SD (SD1 and SD2) and two DSA (DSA2 and DSA3) landraces had positive, while SD3 and DSA1 had negative PC1 values. Conversely, two landraces from ED (ED1 and ED3), DA (DA1 and DA3) and FD (FD1 and FD2) had negative, while ED2, DA2 and FD3 had positive PC1 values.
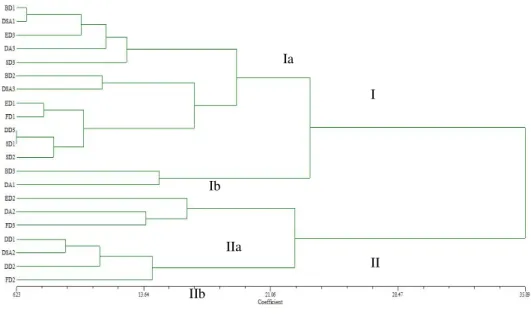
Dendrogram based on morphological traits, presented in Figure 2, can be divided into two main clusters (I and II), with both clasters containing two sub-clusters (Ia and Ib, i.e. IIa and IIb). Furthermore, subcluster Ia contains two groups - Ia1 and Ia2. BD and SD landraces fell into one cluster (cluster I) and they were the most similar within themselves. Other populations were distributed in both clusters. DA landraces, distributed in Ia2 (DA3), Ib (DA1) and IIa (DA2), was the most diverse agro-ecological group, with the largest dissimilarity coefficients.
Table 4. Eigenvectors, eigenvalues and accumulated variation of the first five principal components (PC) from the correlation matrix based on maize population means
Figure 1. Distribution of the 21 maize landraces on the first two principal components PC1 and PC2 of the PCA performed for phenotypic data
Traits PC1 PC2 PC3 PC4 PC5
Plant height (PH) .854 .242 .096 .234 .094
Ear height (EH) .907 -.134 -.073 .165 .119
Leaf number up to the ear insertion (LNEI) .949 -.123 -.123 -.061 .030
Ear leaf lenght (ELL) .792 .203 -.167 -.114 .059
Tassel lenght (TL) .151 .960 .050 -.008 -.089
Lenght of tassel main axis (TSMA) -.234 .859 .202 .104 -.001
Number of primary tassel branches(NPTB) .672 -.057 .349 -.235 -.318
Lenght of the branched part of the tassel
( LBPT ) .144 .782 -.309 .192 .165
Ear lenght (EL) .323 .066 -.131 .782 .078
Kernel row number (KRN) .158 .000 .912 -.315 .118
Number of kernels per row (NKR) .065 .340 -.119 .715 -.476
Ear diameter (ED) .449 -.117 .281 -.675 .019
Kernel lenght (KL) .429 .263 .159 -.491 -.481
Kernel width (KW) .243 -. 013 -.934 .066 -.018
Kernel thickness (KT) .188 .107 .118 -.079 .859
Total 4.30 3.29 2.46 1.38 1.15
818 GENETIKA, Vol. 45, No.3,811-824, 2013
Figure 2. Dendrogram of 21 maize dent landraces constructed using UPGMA cluster analysis of Euclidean distance values obtained by morphological data.
RAPD analysis
Seventy-six bands were scored with seven RAPD markers among the 21 genotypes. The primer OPB-12 gave the minimum number of fragments (three), while the highest number of fragments (16) was amplified with primers OPB-04 and GEN 1-70-3. The average number of alleles was 10.8.
Genetic distance between landraces calculated by NEI and LI for RAPD data ranged from 0.09 (DSA2 and DSA3) to 0.63 (DA2 and ED1), with average value 0.35 (Table 5).
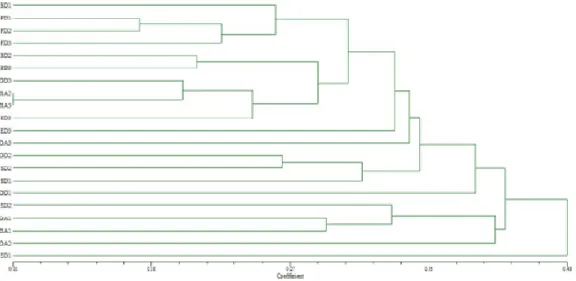
The genetic distance coefficients among landraces based on the RAPD fragments were used to construct a dendrogram by UPGMA analysis (Figure 3). Landraces were separeted in three clusters. Cluster I could be further divided into two sub-clusters, Ia and Ib. All three FD landraces fell in sub-cluster Ia and all three BD landraces in cluster I. DD landraces were distributed among cluster I (DD3) and cluster II (DD2 and DD1, the later weakly bouned to the cluster). All the other landraces from different agro-ecological groups were distributed among two clusters. The exception are ED landraces, with the ED1 being genetically the most dissimilar and separeted from other landraces, but weakly connected with cluster III. ED3 was loosely bounded to cluster I and ED2 fell in cluster III.
I IIa Ia Ib II IIb
Table 5. Mean and range of Euclidean distances (calculated from morphological traits) and Nei and Li dissimilarity coefficient s (calculated from RAPD and SSR markers)
Figure 3. Dendrogram of 21 maize dent landraces constructed using UPGMA cluster analysis of genetic distance values (Nei and Li, 1979) obtainedfrom RAPD data
Agro-ecological group Mean RAPD Range Mean SSR Range
Bosnian early dents 0.26 0.2-0.3 0.53 0.4-0.79
Eight-row soft dents 0.50 0.4-0.55 0.36 0.21-0.47
Dent Type of USA Corn Belt dents 0.4 0.4-0.4 0.55 0.43-0.64
Derived Dents 0.31 0.26-0.35 0.28 0.24-0.32
Dent Type of Southern areas of USA 0.21 0.09-0.27 0.39 0.37-0.45
Serbian dents 0.28 0.25-0.38 0.5 0.42-0.66
Denty Flints 0.20 0.17-0.24 0.35 0.31-0.38
820 GENETIKA, Vol. 45, No.3,811-824, 2013 SSR analysis
Total number of alleles detected with ten SSR markers in 21 maize landraces was 77. All ten SSR loci were polymorphic. Average number of alleles was 7.7 per pair primer. The range of alleles richness varied from three (umc1418) to 13 (umc1506).
Genetic distance between landraces determined by SSR analysis ranged from 0.17 (DSA1 and BD2) to 0.92 (DA1 and SD3) the average value was 0.48 (Table 5).
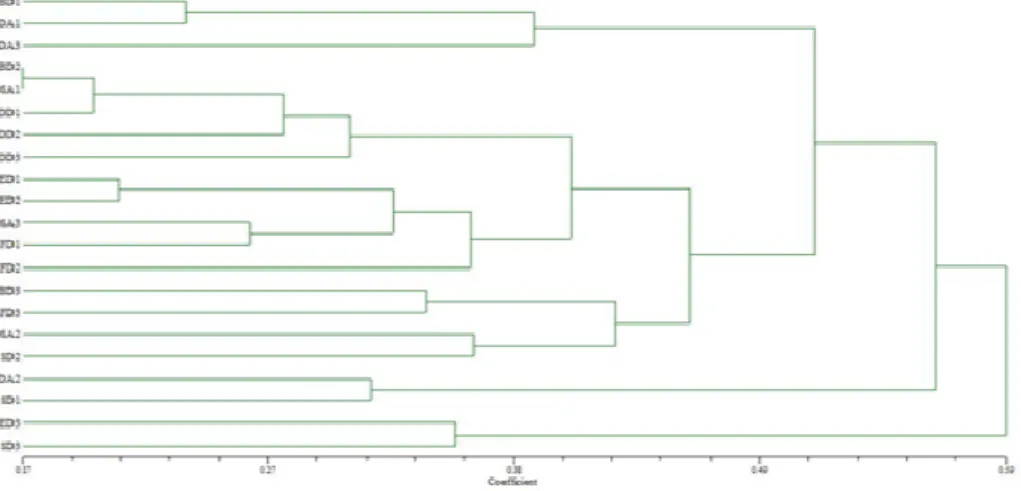
Dendrogram generated on genetic distance values based on SSR data, grouped the populations in four clusters, with two sub-clasters in the second cluster (IIa and IIb). Futuremore, IIa1 continis two groups IIa1 and IIa2 (Figure 4). DD were grouped in the subclaster IIa and they were most similar to each other. FD are grouped in subclaster IIb and IIc. DSA were located in cluser II. BD, ED and DA landraces were divided into two clusters. SD are most heterogeneous because they were divided into three clusters.
Figure 4. Dendrogram of 21 maize dent landraces constructed using UPGMA cluster analysis of genetic distance values (Nei and Li, 1979) obtained from SSR data
Correlations between different marker systems
Distance matrices based on morphological traits, RAPD and SSR markers were used to estimate concurrence between genetic distances derived from the two data sets. No significant correlations were found between any two types of markers.
DISCUSSION
Characterization of maize landraces led to the estimation of genetic diversity and population structure (PRASANNA, 2010, SHARMAet al., 2010). Studies using molecular markers
identifying potential desirable agronomic traits in maize landraces and discovering the best methods for conserving maize diversity.
The way to overcome the problem of numerous individuals per populations is to analyze one or a few bulk samples (15-30 pooled DNA of individual plants) per population (DUBREUIL et al. 2006; WARBURTONet al. 2010). This approach has given positive results in the study of maize
populations using AFLP markers (BEYENE Y. et al., 2006), SSR markers (REIF et al., 2005) and RAPD markers (CARVALHO et al., 2004). RAPD and SSR analysis of pools of individuals from a population was proven to be much more efficient than genotyping individuals per population (WARBURTON et al., 2002; DUBREUIL et al., 2006).
Application of morphological markers in genetic diversity analysis has a lot of gaps, such as low number of morphological markers, environmental influence on the phenotypic expression and low polymorphism. The advantages of RAPD technique are its simplicity and velocity, but it is very sensitive to small modification of experimental conditions which need to be strictly controlled in order to receive reproducible results. On the other side, SSR are highly accurate and repeatable, and have high level of polymorphism.
The results of analysis with both types of markers (morphological and molecular) are necessary for effective conservation and development of genetic resources. Each of the marker system has its advantages and disadvantages and it is the best to combine both methods. Morphological markers are technically simple, they do not require sophisticated equipments and as such they are helpful in preliminary evaluation of diversity (BEYENEet al., 2005). On the other
side, molecular markers can be used to detect variation on the DNA level and have high level of polymorphism (DUBREUIL et al., 2006).
Genetic structure of landraces from the former Yugoslavia is the consequence of long time adaptation of genotypes to different climatic conditions, abiotic and biotic stresses and soil types. In this study we used morphological traits and two types of molecular markers, RAPD and SSR, to characterize 21 maize landraces. The genetic diversity assessed is probably the result of adaptation to environmental conditions. The cluster analysis and PCA could not clearly separated landraces based on morphological characteristics, demonstrating the limitations of these results in the assessment of genetic variability. However, phenotypic traits are significant part of the assessment of genetic diversity and its first characterization. For example, landraces from second main cluster of the dendrogram obtained by morphological data were tall plants and high ear heights. On the other hand, populations BD3 and DA1 (the only two landraces in Ib) had the lowest ear heights. Landraces with the highest number of leaves (ED2, DA2 and FD3) were grouped into subclusters IIa.
Higher level of genetic diversity was obtained with SSR than with RAPD. The mean number of alleles assessed by RAPD markers were 10.8 and was higher in this study than previous studies in which were analyzed 13 landraces with 17 primers i.e. 79 landraces with 32 primers (IGNJATOVIC-MICIC et al., 2003; CARVALHO et al., 2004). Also, average value of GD
(0.35) was similar to GD (0.32) found in the works IGNJATOVIC-MICICet al. (2003), and higher
then 0.16 found in the work CARVALHOet al. (2004), most probably because it tested a small
part of the core collection. The cluster analysis grouped landraces from only two agro-ecological groups in the same cluster. Landraces within FD agro-ecological group had the lowest GD and they were grouped in same cluster, the same as BD landraces.
High level of diversity between landraces was also obtained with SSR analysis. SSR markers have the highest level of polymorphism compered with other markers. Average number
822 GENETIKA, Vol. 45, No.3,811-824, 2013
of alleles was 7.7, which is similar to previous study (DUBREUIL et al., 2006) and higher than
results obtaines on maize landraces from southwest China (YAOet al., 2007). The mean value of
GD, was similar to GD obtained in work of flint landraces (IGNJATOVIC-MICICet al., 2008).
Landraces are grouped into agro-ecological groups based on pedigre data and morphological traits, and it was expected that GD based on molecular markers should describe genetic relations between landraces. Significant matching with origin of populations with any of marker systems was not obtained. We did not achieve the same ranking of the agro-ecological group (based on GD) for the marker systems. The lowest GD detected by RAPD markers was within DF and by SSR markers was within DD. As far as the highest GD is considered using is considered RAPD markers it was found within ED i.e. using SSR markers within DA.
Better agreement with agro-ecological data was obtained with RAPD markers, which also provided lower genetic distances than SSR markers. Due to the use of bulked samples it was difficult to interpret the SSR results, because some of the loci were presented with several closely-positioned bands. On the other side, stutter bands could contribute to variation in GD estimates among the landraces (DUBREUILet al., 2006). It would be desirable to use a software
program to identify stutter bands based on their position on the gel and the intensity.
Application of molecular markers is proven as useful tool in assessing genetic diversity between maize landraces. The higher diversity observed between landraces can be explained by a long adaptation to local environmental conditions. Effectiveness of molecular markers in determining genetic structure of landraces should be combined with morphological traits to obtain comprehensive results in the assessment of genetic diversity.
ACKNOWLEDGEMENT
This research was supported by the Ministry of Education, Science and Technological Development of Republic of Serbia through the project TR31028 Exploitation of maize diversity to improve grain quality and drought tolerance
Received February 05th, 2013 Accepted October 05th, 2013 REFERENCES
ANDJELKOVIC, V. and D. IGNJATOVIC-MICIC (2012): Maize genetic resources –science and benefits. Publisher Serbian Genetic Society and Maize Research Institute „Zemun Polje“, ISBN 978-86-87109-07-0 (SGS)
ANDRESON, E. and H.C. CUTLER (1942): Races of Zea mays: Their recognition and calassification. Ann. Missouri Bot.Gard. 29: 69-89.
BABIC, V., M. IVANOVIC, M. BABIC (2012): The Origin and evolution of maize and its introduction into South-Eastern Europe. Field and Vegetable Crops Research 49: 92-104.
BEYENE, Y., A. BOTHA, A.A. MYBURG (2005): A comparative study of molecular and morphological methods of describing genetic relationships in traditional Ethiopian highland maize. African Journal of Biotechnology Vol. 4 (7), pp.
586-595
BEYENE, Y., A. BOTHA, A. MYBURG (2006): Genetic diversity in traditional Ethiopian highland maize accessions assessed by AFLP markers and morphological traits. Biodiversity and Conservation 15: 2655-2671.
BRACCO, M., V.V. LIA, A.M.J. GOTTLIEB, J. CÁMARA HERNÁNDEZ, L. POGGIO (2009): Genetic diversity in maize landraces from indigenous settlements of Northeastern Argentina. Genetica 135: 39-49
CARVALHO, V.P., C.F. RUAS, J.M. FERREIRA, R.M.P. MOREIRA and P.M. RUAS (2004): Genetic diversity among maize (Zea mays L.) landraces assessed by RAPD markers. Genet. Mol. Biol. vol.27 no.2.
CÖMMERTRAY, G., F.S. BALOCH, B. KILIAN, A.C. ÜLGER, H. ÖZKAN (2012): Diversity assessment of Turkish maize landraces based on fluorescent labelled SSR markers. Plant Molecular Biology Reporter, 30: 261–274. DUBREUIL, P., M. WARBURTON, M. CHASTANET, D. HOISINGTON, A. CHARCOSSET (2006): More on the introduction of
temperate maize into Europe: Large-scale bulk SSR genotyping and new historical elements. Maydica 51: 281-291
IGNJATOVIC-MICIC, D., T. CORIC, D. KOVACEVIC, K. MARKOVIC (2003): RFLP and RAPD analysis of maize (Zea mays L.) local populations for identification of variability and duplicate accessions. Maydica 48: 153-159.
IGNJATOVIC-MICIC, D., S.M. DRINIC, A. NIKOLIC, V.L. JANCIC (2008): SSR-analysis for genetic structure and diversity determination of maize local populations from former Yugoslavia territories. Russian Journal of Genetics. Vol. 44, No. 11, pp. 1317–1324, ISSN 1022-7954.
LEGESSE, B. W., A. A. MYBURG, K. V. PIXLEY, A. M. BOTHA (2007): Genetic diversity of African maize inbred lines revealed by SSR markers. Hereditas Vol. 144, Issue 1: 10–17.
MANTEL, N. (1967): The detection of disease clustering and a generalized regression approach. Cancer Res. 27: 209–220.
NEI, M. and W.H LI (1979): Mathematical model for studying genetic variation in terms of restriction endonucleases. Proc. Natl. Acad. Sci. USA 76: 5269–5273.
PAVLICIC, J. and V. TRIFUNOVIC (1966): A study of some important ecologic corn types grown in Yugoslavia and their classification. Journal for Scientific Agricultural Research 19: 44-62.
PRASANNA, B.M. (2010): Phenotypic and molecular diversity of maize landraces: characterization and utilization. Indian J. Genet. 70: 315–327.
REIF, F.C., A.E. MELCHINGER, X.C. XIA, M.L. WARBURTON, D.A. HOISINGTON, S.K. VASAL, G. SRINIVASAN, M. BOHN, M. FRISCH (2003): Genetic distance based on simple sequence repeats and heterosis in tropical maize populations. Crop Sci, 43: 1275−1282.
REIF, J.C., S. HAMRIT, M. HECKENBERGER, W. SHIPPRACK (2005): Genetic structure and diversity of European flint maize populations determined with SSR analysis of individuals and bulks. Theor. Appl. Genet. 111: 906-913.
ROHLF, F.J. (2000): NTSYS-pc Numerical Taxonomy and Multivariate Analysis System version 2.1. Owner’s manual. SAGHAI-MAROOF, M., K. SOLIMAN, R. JORGENSEN, R. ALLARD (1984): Ribosomal DNA spacer length polymorphism in
barley; mendelian inheritance, chromosomal location and population dynamics. Proc. Natl. Acad. Sci. USA
91: 8014-8018.
SHARMA, L., B.M. PRASANNA, B. RAMESH (2010): Phenotypic and microsatellite-based diversity and population genetic structure of maize landraces in India, especially from the North East Himalayan region. Genetica 138 619–631 WARBURTON, M.L., X. ZIANCHUN, J. CROSSA, J. FRANCO, A.E. MELCHINGER, M. FRISCH, M. BOHN, D. HOISINGTON (2002): Genetic characterization of CIMMYT inbred maize lines and open pollinated populations using large scale fingerprinting methods. Crop Sci. 42: 1832-1840.
WARBURTON, M., P. SETIMELA, J. FRANCO, H. CORDOVA, K. PIXLEY, M. BANZIGER, S. DREISIGACKER, C. BEDOYA, J. MACROBERT (2010): Toward a cost-effective fingerprinting methodology to distinguish maize open-pollinated varieties. Crop Sci. 50 467–477
YAO, Q.L., K.C.YANG, G.T. PAN, T.Z. RONG (2007): Genetic diversity of maize (Zea mays L.) landraces from Southwest
824 GENETIKA, Vol. 45, No.3,811-824, 2013 PROCENA GENETIČKE VARIJABILNOSTI LOKALNIH POPULACIJA ZUBANA
PRIMENOM MORFOLOŠKIH I MOLEKULARNIH MARKERA
Danijela RISTIĆ, Vojka BABIĆ, Violeta ANĐELKOVIĆ, Jelena VANČETOVIĆ, Snežana MLADENOVIĆ DRINIĆ, Dragana IGNJATOVIĆ-MICIĆ
Institut za kukuruz „Zemun Polje“, Beograd, Srbija Izvod
Banka gena Institut za kukuruz "Zemun Polje" održava kolekciju lokalnih populacija grupisanih u 18 agro-ekološka prikupljenih na prostoru bivše Jugoslavije. Primena i upoređivanje različitih marker-analiza su važni za karakterizaciju i korišćenje lokalnih populacija kukuruza u selekcionim programima, kao potencijalnih izvora poželjnih osobina. U ovom radu 15 morfoloških osobina, 7 RAPD prajmera i 10 SSR prajmera su primenjeni sa ciljem i) utvrđivanja genetičke udaljenosti između 21 lokalnih populacija kukuruza zubana i ii) upoređivanjarezultata dobijenih na osnovu morfoloških i molekularnih markera. Fenotipska analiza je pokazala visok stepen heterogenosti između lokalnih populacija. Viši nivo genetičkog diverziteta je dobijen sa SSR nego sa RAPD markerima. Srednja vrednost genetičke distance za RAPD je bila 0.35, odnosno 0.48 za SSR. Na osnovu morfoloških osobina i molekularnih markera, pomoću UPMGA analize dobijeni su klasteri, koristeći NTSYSpc statistički program. Klaster analiza na osnovu morfoloških i molekularnih markera nije pokazala isto grupisanje lokalnih populacija. Bolje slaganje sa agroekološkim podacima je dobijeno na osnovu RAPD markera. Korelacije su bile niske između genetičkih distanci za različite tipove markera. Rezultati dobijeni u ovom radu mogu biti od koristi za dalje proučavanje većeg broja lokalnih populacija, kao i očuvanje genetičkih resursa i njihovog genetičkog diverziteta.
Primljeno 05. II 2013.