...
Grzegorzewska, Stasiak-Betlejewska: The In
fl
uence of Global Crisis on Financial...
Emilia Grzegorzewska1, Renata Stasiak-Betlejewska2The Influence of Global
Crisis on Financial Liquidity
and Changes in Corporate
Debt of the Furniture
Sector in Poland
Utjecaj svjetske krize na financijsku likvidnost
i promjene u dugovanjima korporacija u
sektoru proizvodnje namještaja u Poljskoj
Review paper • Pregledni radReceived – prispjelo: 17. 7. 2013. Accepted – prihvaćeno: 13. 10. 2014. UDK: 630*74
doi:10.5552/drind.2014.1342
ABSTRACT •This paper presents the analysis of one of the main objectives of fl ow and debt levels of furniture manufacturing companies in Poland. The analysis includes the average values of the selected fi nancial ratios calculated for small, medium and large furniture manufacturing companies in 2007-2012, comparing them with the results for the entire manufacturing sector. The study results show that furniture manufacturing companies showed a higher ability to pay current liabilities with selected current assets and lower debt levels than industrial companies in general. In addition, the analytical results indicate that there are differences in the liquidity ratios of small, medium and large companies of the furniture industry. These companies also maintain different levels of debt. It should be emphasized that in 2009-2011 there was a negative trend - the liquidity decrease and the debt level increase. It mostly applied to companies of small and average level of employment.
Key words:fi nancial liquidity, debt level, employment level, furniture industry, manufacturing
SAŽETAK • Jedan od glavnih ciljeva poduzeća u krizi jest da održe solventnost i osiguraju nastavak tržišnih aktivnosti. Stoga su u ovom radu analizirani trendovi u tijeku novca i dugovanjima u proizvodnji namještaja u Poljskoj. Analiza obuhvaća i prosječne vrijednosti odabranih fi nancijskih indeksa izračunanih za male, srednje i velike kompanije za proizvodnju namještaja u razdoblju 2007. – 2012., pri čemu su oni uspoređeni s rezul-tatima cjelokupnoga proizvođačkog sektora. Rezultati istraživanja govore da industrija namještaja pokazuje veće mogućnosti podmirivanja trenutačnih fi nancijskih obveza raspoloživim sredstvima i uz nižu razinu dugovanja nego što to mogu druga industrijska poduzeća u cjelini. Usto, rezultati analize pokazuju da postoji razlika između razine likvidnosti malih, srednjih i velikih poduzeća za proizvodnju namještaja. Ta poduzeća također održavaju različitu razinu dugovanja. Potrebno je naglasiti da se u razdoblju od 2009. do 2011. pojavio negativni trend – likvidnost se smanjila, a razina dugovanja porasla. To se ponajprije odnosi na mala i srednja poduzeća, gledano sa stajališta broja zaposlenih.
Ključne riječi:fi nancijska likvidnost, razina dugovanja, razina zaposlenosti, proizvodnja namještaja, proizvodnja 1 Author is assistant at Faculty of Wood Technology, Warsaw University of Life Sciences, Warsaw, Poland. 2Author is assistant at Faculty of
Management, Czestochowa University of Technology, Czestochowa, Poland.
1 Autorica je asistentica Fakulteta drvne tehnologije, Varšavsko sveučilište bioloških znanosti, Varšava, Poljska. 2Autorica je asistentica
Grzegorzewska, Stasiak-Betlejewska: The In
fl
uence of Global Crisis on Financial...
...
1 INTRODUCTION1. UVOD
The fi nancial crisis that had its origins in the sub-prime credit market in the United States turned into a global economic crisis. The negative effects of the cri-sis affected the entire world economy and contributed to the deterioration of the fi nancial condition of most companies (Jelačić et al., 2010). A series of socio-eco-nomic diffi culties have arisen as a result of these events, and the crisis has increased the interest in issues concerning the main causes of this situation on the world market (Goodhart, 2008; Mojon 2010; Eisen-beis, 2010; Prihod’ko, 2011; Lane, 2012).
The furniture industry is an important part of the Polish economy. Furniture is one of the major export products of the Polish economy. According to a study conducted by Eurostat, the Member States of the Eu-ropean Union, Poland recorded a signifi cant increase in the production of furniture in 1997-2006 - an average of 11.5 % growth per year (Grzegorzewska et al., 2012). In 2001-2006, Lithuania and Spain also record-ed double-digit annual growth in the mentionrecord-ed indus-try (Furniture and other manufacturing activities in 2007). The important role of the furniture industry in the Polish economy is confi rmed by the results of fur-niture exporter rankings. Poland ranks fourth in the world and third in Europe in terms of the furniture mar-ket export value. In 2012, the classifi cation of Europe-an countries shows a higher position of only two coun-tries - Italy and Germany, and according to the world ranking – China (Bičanić et al., 2010). In recent years, the value of Polish furniture market has decreased. Data from the Ministry of Economy shows that in 2007-2008 the production value of the furniture indus-try amounted to 26.5 (2007) and 27.5 billion PLN (2008). The peak was recorded in 2009, when the value of the furniture production amounted to 30.2 billion PLN. In the next two years, however, a decreasing trend was recorded. In 2010 the furniture market was worth 28 billion PLN, a year later - 27 billion PLN. This means that economic trends in global markets also affected the furniture industry condition and conse-quently also the fi nancial situation of companies oper-ating in this market. This is due to the fact that over 90 % of the domestic furniture production is devoted to exports. The importance of the non-fi nancial factors that may contribute to minimizing its negative effects was highlighted in the crisis conditions (Sierpińska and
Jachna, 2004; Śliwa and Wymysłowski, 2003). An im-portant element in the company management, includ-ing furniture industry companies, among others, is to turn attention the factors motivating employees (Kropivšek et al., 2011; Drábek and Jelačić, 2007), and to give importance to image and brand recognition for building a competitive advantage (Motik et al., 2010).
However, the fi nancial aspect of the furniture business (Biernacka and Sedliačikova, 2012), which has a signifi cant impact on its solvency forms as the basis of market survival, cannot be missed in the analy-sis. Creating an appropriate level of fi nancial liquidity and corporate debt is one of the main factors determin-ing the fi nancial condition of the furniture companies. Therefore, in view of the economic situation on the international market in Poland, the issue of the fi nan-cial liquidity of small, medium and large companies in the furniture industry was taken into consideration.
2 MATERIALS AND METHODS 2. MATERIJALI I METODE
The aim of this study was to determine trends in terms of fi nancial liquidity and corporate debt of the furniture industry. The average values of the resource liquidity and debt ratios were analyzed for businesses operating in the furniture market. The study covered the period 2007-2012. It was assumed that the period of research would be adequate to determine whether and to what extent industry liquidity and debt ratios have changed due to critical events that have taken place both in Poland and internationally. In the studied population, there were three groups of companies de-termined based on the criteria of employment level:
Group 1 - companies employing 10 to 49 workers (small companies),
Group 2 - companies employing between 50 and 249 workers (medium-sized companies),
Group 3 - companies employing more than 249 workers (large companies).
The analysis presents a comparative study of av-erage fi nancial liquidity and debt ratios acquired by the furniture industry (Section 31.0 of the Polish Activities Classifi cation – Furniture Manufacturing) in the case of companies with Section C - “Manufacturing”, where the furniture industry is included. Companies in the manufacturing sector, including furniture, which were included in the study, are presented in Table 1.
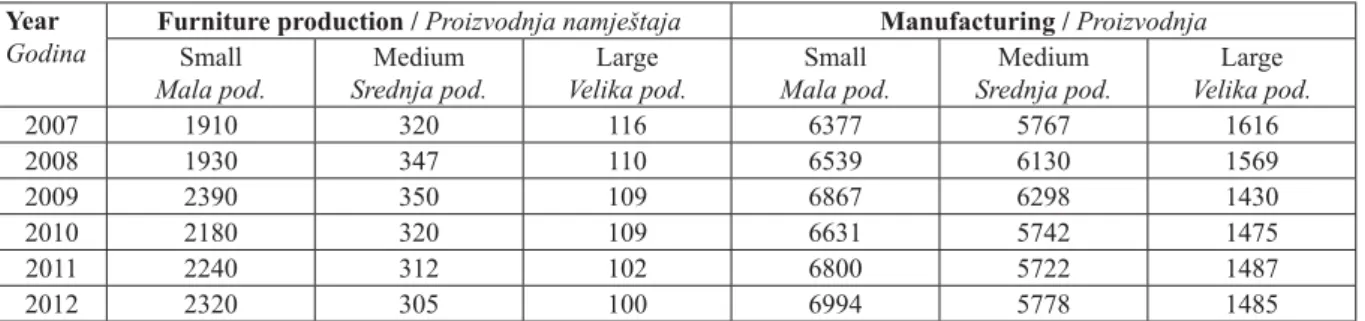
Table 1 A number of manufacturing companies, including furniture industry surveyed in Polandin 2007-2012
Tablica 1. Broj proizvodnih tvrtki u Poljskoj anketiranih u razdobljuod 2007. do 2012., uključujući i poduzeća za proizvod-nju namještaja
Year Godina
Furniture production / Proizvodnja namještaja Manufacturing / Proizvodnja
Small Mala pod. Medium Srednja pod. Large Velika pod. Small Mala pod. Medium Srednja pod. Large Velika pod. 2007 1910 320 116 6377 5767 1616 2008 1930 347 110 6539 6130 1569 2009 2390 350 109 6867 6298 1430 2010 2180 320 109 6631 5742 1475 2011 2240 312 102 6800 5722 1487 2012 2320 305 100 6994 5778 1485
...
Grzegorzewska, Stasiak-Betlejewska: The In
fl
uence of Global Crisis on Financial...
A primary source of research material was ob-tained from reports PONT INFO database (2007-2012), which contains data on the average annual value of fi nancial ratios calculated for groups of companies awarded according to NACE.
Table 2 shows the resource fi nancial liquidity and debt ratios, its defi nitions and values found as limiting or optimal in the fi nance literature.
In order to determine the relationship between the distinguished groups of furniture companies and the relation between the furniture industry entities and the entire industrial processing, the correlation analysis of selected fi nancial ratios was done. The Pearson cor-relation coeffi cient was applied in the study. It is a rela-tionship measurement of linear characteristics, which assumes values in the range [-1, 1]. The statistical anal-ysis usually assumed that if the correlation coeffi cient is (Siedlecka,2001):
below 0.2 - there is no relationship between the studied characteristics,
0.2 - 0.4 – the dependency is clear, but low, 0.4 - 0.7 – the dependency is moderate, 0.7 - 0.9 – the dependency is signifi cant, above 0.9 - the dependency is strong. 3 RESULTS AND DISCUSSION 3. REZULTATI I RASPRAVA
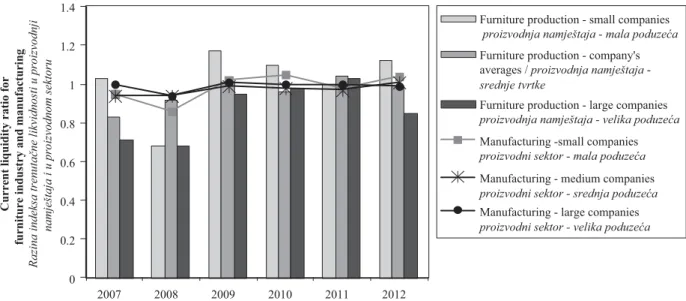
Data presented in Figure 1 shows the average values of the current fi nancial liquidity ratio for com-panies and entities in the furniture manufacturing in-dustry.
The analysis of research results shows that the current liquidity ratio, indicating capabilities of current liabilities with current assets, increased in 2007-2009 in the case of furniture manufacturing companies re-gardless of the number of employees.
The highest value of this ratio was observed in companies employing 10 to 49 employees. Initially, the current ratio increased in this group from 1.48 to 1.58. In 2009-2011 there was a decrease of this ratio
(1.45 in 2011), and in the last year of the analysis of the current liquidity, the situation improved again. How-ever, it is worth noting that during the period of report, the ability to repay short-term liabilities with current assets remained above the limit value (1.2) in the case of small furniture companies. In the case of companies employing 50 to 249 employees, a similar trend was observed as in the group of small companies. The low-est level of current ratio (i.e. 1.29) was recorded in 2007. Another decrease of the analyzed value was ob-served in 2010, since then the ability of medium-sized companies to settle their current liabilities with current assets increased year on year.
In the group of companies with employment over 249 workers, in 2007-2008, lower current ratio values were recorded than the limit values set in the literature of fi nance (1.2). In 2009, the companies of the ana-lyzed group reached the mentioned value.
Interesting information about fi nancial liquidity of a furniture company can be obtained when compar-ing the results obtained for these companies to compa-nies operating in NACE section “Manufacturing”. It should be highlighted that in the period observed, cur-rent liquidity ratios calculated for furniture companies were higher than the same values calculated for the whole manufacturing. This relationship was observed in all three company groups regardless of their employ-ment level. The exception was noted in 2007, when the ability of medium and large companies to pay current liabilities with current assets was generally higher for manufactur ing.
Figure 2 shows the increasing changes in the li-quidity ratio in the furniture industry companies in the context of industry processing. Results of data analysis indicate that the furniture companies that employ 10 to 49 workers have the highest ability to pay their current liabilities with the current assets excluding inventories. Exception was noted in 2008 and 2011, when small companies were characterized by a lower level of in-creased fi nancial liquidity than the other groups of companies. It is worth noting that in this group of com-Table 2 Financial liquidity and debt ratios applied in the analysis
Tablica 2. Financijska likvidnost i indeksi dugovanja korišteni u analizi Kind of ratio Vrsta indeksa Defi nition of ratio Opis indeksa Limited value Granična vrijednost
Liquidity ratios / Indeksi likvidnosti
Ratio of current liquidity
Indeks trenutačne likvidnosti
Current assets / current liabilities
Trenutačnasredstva / trenutačneobveze
1.2-2 Quick ratio
Indeks brze procjene
(Current assets - inventories) / current liabilities
(Trenutačna sredstva – zalihe) / trenutačne obveze
1 High liquidity ratio
Indeks visoke likvidnosti
Cash and cash equivalents / current liabilities
Gotovina i ostala sredstva / trenutačne obveze
0.2 Debt ratios / Indeksi dugovanja
Debt ratio
Indeks dugovanja
Total liabilities / total assets
Ukupne obveze / ukupna sredstva
1:2-1:4 Equity debt ratio
Indeks uravnoteženih dugova
Total debt / equity capital
Ukupna dugovanja / ukupni kapital
2:1 Term debt ratio
Vremenski indeks dugovanja
Long-term liabilities / equity capital
Dugoročne obveze / ravnotežni kapital
1:2-1:1
Grzegorzewska, Stasiak-Betlejewska: The In
fl
uence of Global Crisis on Financial...
...
panies, the highest value of the presented relation (1.17) was noted in 2009. In the next two years, the level of this indicator decreased compared to the previ-ous year. Only in the last year of the analyzed period, research results showed a signifi cant increase. The smallest fl uctuations of the increased liquidity ratio were observed in the case of furniture companies with a medium level of employment. In 2007-2008, 2010 and 2012, the present value of the analyzed relation was below the optimum level, which confi rmed the in-suffi cient ability of these companies to regulate short-term liabilities with the current assets excluding inven-tories. The highest increased current liquidity ratio (1.04) was noted in 2011, but it only slightly exceeded the level considered optimal (1 .0).
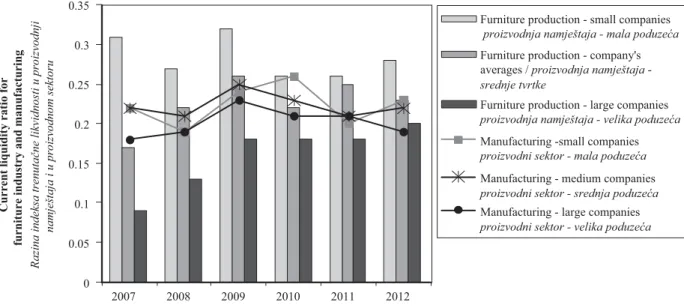
Figure 3 shows the average values of high liquid-ity ratio for furniture companies and entities acting in industry processing. The lowest values of the current ratio, total increased liquidity, were again recorded for
furniture companies with the highest number of em-ployees. In 2007, the ratio of current assets, excluding inventories, was created in this group of companies at the level of 0.71 (an increase of 30 % below the opti-mum value).
A year later, the rate dropped to 0.68. In 2009-2011 there was an increase of liquidity results close to the optimum value. However, the last year covered by the analysis indicated again a signifi cantly lower ability to pay current liabilities with current assets excluding inventories. Then, the quick liquidity ratio was 0.85.
Comparative analysis of the furniture industry and manufacturing shows that the level of high liquid-ity ratio in small and medium-sized furniture compa-nies was on average higher than in manufacturing com-panies. A different situation was observed in the case of companies employing more than 249 employees. In general, the level of the analyzed relationship was low-er in the furniture factorie s.
1.48 1.56 1.58 1.55 1.45 1.58 0 0.2 0.4 0.6 0.8 1 1.2 1.4 1.6 1.8 2007 2008 2009 2010 2011 2012
Current liquidity ratio for
furniture industry and manufacturing
5D]LQDLQGHNVDWUHQXWDþQHOLNYLGQRVWLXSURL]YRGQML
QDPMHãWDMDLXSURL]YRGQRPVHNWRUX
Furniture production - small companies SURL]YRGQMDQDPMHãWDMDPDODSRGX]HüD Furniture production - company's averages / SURL]YRGQMDQDPMHãWDMD -VUHGQMHWYUWNH
Furniture production - large companies SURL]YRGQMDQDPMHãWDMDYHOLNDSRGX]HüD Manufacturing -small companies SURL]YRGQLVHNWRUPDODSRGX]HüD Manufacturing - medium companies SURL]YRGQLVHNWRUVUHGQMDSRGX]HüD Manufacturing - large companies SURL]YRGQLVHNWRUYHOLNDSRGX]HüD 0 0.2 0.4 0.6 0.8 1 1.2 1.4 2007 2008 2009 2010 2011 2012
Current liquidity ratio for
furniture industry and manufacturing
5D]LQDLQGHNVDWUHQXWDþQHOLNYLGQRVWLXSURL]YRGQML
QDPMHãWDMDLXSURL]YRGQRPVHNWRUX
Furniture production - small companies SURL]YRGQMDQDPMHãWDMDPDODSRGX]HüD Furniture production - company's averages / SURL]YRGQMDQDPMHãWDMD -VUHGQMHWYUWNH
Furniture production - large companies SURL]YRGQMDQDPMHãWDMDYHOLNDSRGX]HüD Manufacturing -small companies SURL]YRGQLVHNWRUPDODSRGX]HüD Manufacturing - medium companies SURL]YRGQLVHNWRUVUHGQMDSRGX]HüD Manufacturing - large companies SURL]YRGQLVHNWRUYHOLNDSRGX]HüD Figure 1 The level of the current liquidity ratio in furniture production and manufacturing in Poland in 2007-2012
Slika 1. Razina indeksa trenutačne likvidnosti u proizvodnji namještaja i u proizvodnom sektoru Poljske u razdoblju 2007. – 2012.
Figure 2 The level of increased liquidity ratio in furniture production and manufacturing in Poland in 2007-2012
Slika 2. Razina indeksa povećane likvidnosti u proizvodnji namještaja i u proizvodnom sektoru Poljske u razdoblju 2007. – 2012.
...
Grzegorzewska, Stasiak-Betlejewska: The In
fl
uence of Global Crisis on Financial...
A high liquidity ratio (the so-called quick ratio) is considered the most reliable indicator of resource li-quidity ratio as it indicates the possibility of controlling short-term liabilities with cash, which is the most liq-uid fi nancial asset. Figure 3 shows average values of the ratio obtained by furniture industry and industry processing in general. The highest values of high li-quidity ratio were recorded again in the furniture com-panies with the number of employees ranging between 10 and 49. The analyzed relation exceeded the level considered as a safe level (i.e. 0.2) in the entire re-search period. It should be noted that in 2010-2011, the speed indicator was signifi cantly lower than in 2009.
In the analyzed period, the lowest ability to pay short-term liabilities with cash was signifi cant for the furniture companies employing more than 249 workers, although it should be noted that the level of this index for the analyzed period 2007-2012 increased more than doubled (from 0.09 to 2.0). In 2010-2011, this group of companies reported the index at the level of 0.18 and it has not changed compared to 2009, as it did in the case of small and medium-sized furniture companies.
Similar trends in the changes were rapidly ob-served in companies of industry processing. The low-est capacity for timely payment of short-term liabilities with cash was characteristic for companies employing more than 249 employees. In addition, in 2007-2009 the value of this ratio increased from 0.18 to 0.23 and since this time it has gradually decreased, and at the end of the period reached the level of 0.19.
The ability of small and medium-sized compa-nies included in the section „Manufacturing“ was gen-erally higher. In the case of companies employing be-tween 10 and 49 employees, the best period was the year 2010, when the high ratio was at the level of 0.26. However, for industrial companies with an average employment, the level of the highest value of this ratio (0.25) was reached in 2009.
In addition to maintaining a safe level of fi nancial liquidity, an important aspect of fi nancial management
is to determine the debt level and structure, considering the distinction between the short obligations and long repayment period (Drábek and Jelačić, 2007). This subject has particular importance because of the nega-tive effects of the global economic crisis. In fact, ex-cessive debt can result in the loss of solvency and therefore lead to the company bankruptcy.
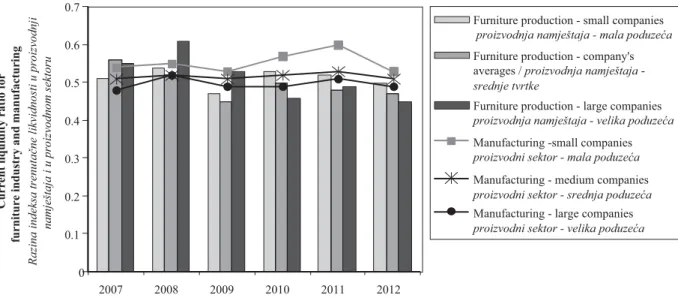
One of the key indicators to assess the level of debt is the total debt ratio, calculated as the ratio of to-tal liabilities to toto-tal assets. Figure 4 presents the aver-age values of this ratio in furniture companies com-pared with manufacturing .
In 2007, in medium and large furniture compa-nies, this relation was recorded at the level of 0.56 and 0.55, which means that it exceeded the level consid-ered as safe. The following year, in companies employ-ing more than 249 workers, an increase of the analyzed ratio (0.61) was recorded. It can be stated that on aver-age 60 % of assets of the surveyed companies was fi -nanced from external sources. In this group of furniture companies, every year since 2008, a slight decrease was recorded in the present value of the analyzed rela-tionship. The year 2011 was an exception, and however since 2010, the furniture manufacturing companies with the highest level of employment maintained a relatively safe level of debt.
In the analyzed period, changes in the value of the total debt ratio were observed in the furniture com-panies employing 10 to 49 workers. Its highest level in this group of companies was observed in 2008 and amounted to 0.54. However, it is worth noting that in 2009 only in small companies the ratio of total liabili-ties to total assets stood at less than 0.5. Conversely, in the furniture industry employing 50 to 249 employees, a safe level of total debt has been recorded since 2008.
Analysis of the total debt ratio in Section C „Manufacturing“ (Polish Activity Classifi cation) shows that the highest values of total debt ratio were observed in companies employing 10 to 49 workers. In 2009-2011 the level of analyzed relation increased 0 0.05 0.1 0.15 0.2 0.25 0.3 0.35 2007 2008 2009 2010 2011 2012
Current liquidity ratio for
furniture industry and manufacturing
5D]LQDLQGHNVDWUHQXWDþQHOLNYLGQRVWLXSURL]YRGQML
QDPMHãWDMDLXSURL]YRGQRPVHNWRUX
Furniture production - small companies SURL]YRGQMDQDPMHãWDMDPDODSRGX]HüD Furniture production - company's averages / SURL]YRGQMDQDPMHãWDMD -VUHGQMHWYUWNH
Furniture production - large companies SURL]YRGQMDQDPMHãWDMDYHOLNDSRGX]HüD Manufacturing -small companies SURL]YRGQLVHNWRUPDODSRGX]HüD Manufacturing - medium companies SURL]YRGQLVHNWRUVUHGQMDSRGX]HüD Manufacturing - large companies SURL]YRGQLVHNWRUYHOLNDSRGX]HüD
Figure 3 The level of high liquidity ratio in furniture production and manufacturing in Poland in 2007-2012.
Grzegorzewska, Stasiak-Betlejewska: The In
fl
uence of Global Crisis on Financial...
...
from 0.53 to 0.60. Only in 2012 there was a decrease to the level of 0.53. However, it is worth noting that throughout the period under consideration, the values of companies exceeded the level considered as safe. A lower level of total liabilities in relation to total assets was observed in manufacturing companies employing more than 249 workers. Only in the years 2008 and 2011, the total debt ratio slightly exceeded the limit value of 0.5 and was 0.52 and 0.51, respectively.
In assessing the level of corporate debt, the debt to equity ratio is also calculated as the ratio of total li-abilities to shareholders‘ equity. The values of debt to equity in furniture companies and manufacturing are presented in Figure 5.
Research fi ndings concerning the furniture mar-ket show that, at the beginning of the analyzed period, the lowest level of the debt to equity ratio (1.05) was observed in small companies. However, in the medium and large companies, in terms of employment, a slight-ly higher level of the anaslight-lyzed relation was recorded, amounting to 1.25 and 1.23, respectively. In small
fur-niture companies, the lowest debt to equity ratio (0.89) was noted in 2009. In the next two years, the result of the analyzed relation of total liabilities to equity ratio was higher, while at the end of the period it showed a decrease in the value of 0.99. Similar trends were ob-served in the medium-size furniture companies. It should be noted that, in the research period, the aver-age of all the furniture companies did not exceed the limit value, which has been set to 2.0 in the literature of
fi nance.
A comparative study of the furniture industry in the processing industry shows that, in the period ob-served, small companies in manufacturing sector re-ported a higher average level of debt to equity. Since 2010, these trends were also observed in the case of medium and large companies. In the section „Manu-facturing“, as well as in the “Furniture manu„Manu-facturing“, during the analyzed period the level of debt to equity did not exceed the limit value, which means that the manufacturing companies maintain a safe level of eq-uity in relation to total assets.
0 0.1 0.2 0.3 0.4 0.5 0.6 0.7 2007 2008 2009 2010 2011 2012
Current liquidity ratio for
furniture industry and manufacturing
5D]LQDLQGHNVDWUHQXWDþQHOLNYLGQRVWLXSURL]YRGQML
QDPMHãWDMDLXSURL]YRGQRPVHNWRUX
Furniture production - small companies SURL]YRGQMDQDPMHãWDMDPDODSRGX]HüD Furniture production - company's averages / SURL]YRGQMDQDPMHãWDMD -VUHGQMHWYUWNH
Furniture production - large companies SURL]YRGQMDQDPMHãWDMDYHOLNDSRGX]HüD Manufacturing -small companies SURL]YRGQLVHNWRUPDODSRGX]HüD Manufacturing - medium companies SURL]YRGQLVHNWRUVUHGQMDSRGX]HüD Manufacturing - large companies SURL]YRGQLVHNWRUYHOLNDSRGX]HüD 0 0.2 0.4 0.6 0.8 1 1.2 1.4 1.6 2007 2008 2009 2010 2011 2012
Current liquidity ratio for
furniture industry and manufacturing
5D]LQDLQGHNVDWUHQXWDþQHOLNYLGQRVWLXSURL]YRGQML
QDPMHãWDMDLXSURL]YRGQRPVHNWRUX
Furniture production - small companies
SURL]YRGQMDQDPMHãWDMDPDODSRGX]HüD Furniture production - company's
averages / SURL]YRGQMDQDPMHãWDMD
-VUHGQMHWYUWNH
Furniture production - large companies
SURL]YRGQMDQDPMHãWDMDYHOLNDSRGX]HüD
Manufacturing -small companies
SURL]YRGQLVHNWRUPDODSRGX]HüD
Manufacturing - medium companies
SURL]YRGQLVHNWRUVUHGQMDSRGX]HüD
Manufacturing - large companies
SURL]YRGQLVHNWRUYHOLNDSRGX]HüD Figure 4 Total debt ratio in furniture production and manufacturing in Poland in 2007-2012
Slika 4. Ukupni indeks dugovanja u proizvodnji namještaja i u proizvodnom sektoru Poljske u razdoblju 2007. – 2012.
Figure 5 The level of debt to equity ratio in furniture production and manufacturing in Poland in 2007-2012
...
Grzegorzewska, Stasiak-Betlejewska: The In
fl
uence of Global Crisis on Financial...
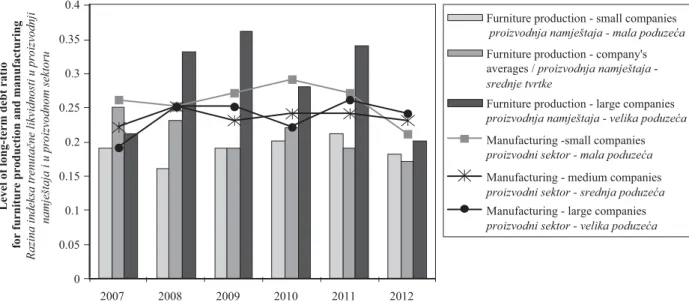
The evaluation of the debt level for surveyed companies was also made on the basis of long-term debt ratio. The level of this index for furniture produc-tion and manufacturing in Poland in the years 2007-2012 is presented in Figure 6.
At the beginning of the period observed, the highest level of long-term debt ratio was recorded in the furniture industry in companies with an average level of employment amounting to 0.24, and the lowest in small companies.
Analysis of long-term debt ratio calculated for Section C „Manufacturing“ shows that the highest val-ues were observed in small companies. An exception is the year 2012, in which the companies in this group have the lowest level of the analyzed relation. It should also be noted that during the period observed large fur-niture companies were characterized by higher levels of long-term debt than companies of the manufacturing sector as a whole. Different trends were observed in the case of small and medium-sized furniture companies. They reached values that were on average lower than the analyzed relations in „Manufacturing“.
It should be emphasized that the average values of long-term debt exceeded the level considered as safe in the analyzed period. This case concerns both compa-nies belonging to the sector of manufacturing and fur-niture production. In the literature of fi nance, the view is presented that the optimum value of this ratio is at the level of 0.5. Companies, whose relation exceeds the level of 1, are considered substantially in debt.
The study analysis of various liquidity and debt ratios was also supplemented by an analysis of the cor-relation between the furniture industry companies and the entire manufacturing sector.
In the case of small industrial and furniture com-panies, a strong positive correlation (0.93) was ob-served in the case of the increased liquidity ratio. In turn, the debt ratios of equity and long-term debt show a moderate positive correlation formed at the level of 0.58 and 0.55. This means that highlighted fi nancial
ratios obtained for small companies of the furniture in-dustry increased with the increase quoted for the entire industrial sector. In the group of medium-sized and large companies, a moderate correlation was reported within liquidity ratios. In addition, in the companies employing more than 249 people, a strong positive cor-relation (0.96) was observed in the case of long-term debt ratio.
The interdependence between fi nancial indica-tors in the furniture business groups is also specifi ed on the basis of the number of employees. In the group of small furniture companies, signifi cant negative corre-lations were noted between increased and high liquid-ity indicators and indicators of total debt and equliquid-ity. This means that the growth of specifi c liquidity ratios was accompanied by the ratio of liabilities to total lia-bilities and the debt is highly correlated to total equity. In the case of furniture companies employing from 50 to 249 people, it was observed that all the ana-lyzed indicators of liquidity are strongly positively cor-related with each other (Pearson‘s correlation coeffi -cient above 0.9), and they are strongly negatively correlated with the analyzed debt indicators. This means that with an increase in the ability of this group of companies to settle their current liabilities by select-ed categories of liabilities decreases their level of debt in relation to the liability and equity.
In companies employing more than 249 people, similar trends were reported as in the case of entities with an average level of employment. However, it should be noted that the relationships between the dis-cussed fi nancial ratios were lower than in the previous group.
4 CONCLUSION 4. ZAKLJUČAK
The economic crisis that began in the U.S. fi nan-cial market, as a result of advancing globalization, transformed into a global crisis. The economic and so-0 0.05 0.1 0.15 0.2 0.25 0.3 0.35 0.4 2007 2008 2009 2010 2011 2012
Level of long-term debt ratio
for furniture production and manufacturing
5D]LQDLQGHNVDWUHQXWDþQHOLNYLGQRVWLXSURL]YRGQML
QDPMHãWDMDLXSURL]YRGQRPVHNWRUX
Furniture production - small companies SURL]YRGQMDQDPMHãWDMDPDODSRGX]HüD Furniture production - company's averages / SURL]YRGQMDQDPMHãWDMD -VUHGQMHWYUWNH
Furniture production - large companies SURL]YRGQMDQDPMHãWDMDYHOLNDSRGX]HüD Manufacturing -small companies SURL]YRGQLVHNWRUPDODSRGX]HüD Manufacturing - medium companies SURL]YRGQLVHNWRUVUHGQMDSRGX]HüD Manufacturing - large companies SURL]YRGQLVHNWRUYHOLNDSRGX]HüD
Figure 6 The level of long-term debt ratio in furniture production and manufacturing in Poland in 2007-2012
Grzegorzewska, Stasiak-Betlejewska: The In
fl
uence of Global Crisis on Financial...
...
cial consequences of the crisis, more or less, affectedall countries. These events have not only affected the economic situation of the world economy, but also the situation on the Polish market and the position of in-dustries that are highly dependent on trade exchange. Due to the fact that 90 % of furniture production sale is exported, the analysis concerns the furniture market results.
Research fi ndings presented in this paper show that the highest level of fi nancial liquidity was gener-ally observed in small furniture companies. In the case of small and medium-sized companies in the analyzed industry, liquidity ratios were reduced in 2009-2011. However, companies with the highest level of employ-ment had the lowest ability to regulate their current li-abilities with current assets selected. In the research period, high liquidity ratio was recorded above the limit value. In addition, it should be emphasized that small and medium-sized furniture companies generally characterized by a higher level of liquidity than compa-nies in the “Manufacturing”. A different situation was observed in large-size furniture companies.
The highest level of the total debt was observed in 2007-2009 in the furniture companies employing more than 249 workers, and the lowest in small compa-nies. An opposite trend was observed in 2010-2012. Large companies were characterized by the lowest level of debt to total assets, which could be considered as safe, because it does not clearly exceed the value of 0.5. Similar results can be observed in the case of the level of the debt to equity ratio. It should also be em-phasized that, in the furniture industry companies, debt ratios were lower than in the case of companies includ-ed in the section “Manufacturing”. This means that fur-niture companies were less indebted than manufactur-ing companies.
The studies highlighted that there are differences in the ability of small, medium and large companies of the furniture industry to regulate their current liabilities with different current assets. These companies also maintain different levels of debt. The analysis of re-search fi ndings also shows that in 2009-2011 there was a deterioration of liquidity and debt ratios in the furni-ture companies. As a rule, it was related to the small and medium-sized companies. This may mean that the effects of the global crisis affected less adversely the
fi nancial liquidity position and debt of companies with the highest level of employment. However, it should be pointed out that the present research fi ndings have some limitations as the average values are given for each group of companies.
5 REFERENCES 5. LITERATURA
1. Bičanić, K.; Jelačić, D.; Gašparić, V.; Carev-Laškarin,V.; Kocbek-Nižetić, M., 2010: Identitet poduzeća u preradi drva i proizvodnji namještaja Republike Hrvatske, Drvna industrija, 60 (3): 145-153.
2. Biernacka, J.;Sedliačikova, M., 2012: Selected Ratio and Bankruptcy Early-Warning Method Analysis of
Com-petitiveness of Wood Sector Companies Listed on War-saw Stock Exchange. Drvna industrija, 63 (3): 187-193. (http://dx.doi.org/10.5552/drind.2012.1212)
3. Drábek, J.; Jelačić, D., 2007: Investment projects. Zvo-len, Vydavatel’stvoNikara, 2007, pp.65.
4. Eisenbeis, R. A., 2010: The fi nancial Crisis: Miss-Diag-nosis and Reactionary Responses. Atlantic Economic So-ciety, 38: 283-294 http://dx.doi.org/10.1007/s11293-010-9235-1.
5. Goodhart, C. A. E, 2008: The background to the fi nancial crisis. IEER, 4: 331-346.
6. Grzegorzewska, E.; Niziałek, I.; Jenczyk-Tołłoczko, I., 2012: Assessment of the furniture industry condition in Poland, Annals of Warsaw University of Life Sciences - SGGW. Forestry and Wood Technology, 78: 55-59. 7. Jelačić, D.; Bičanić, K.; Motik, D., 2010: Croatian Wood
processing and furniture manufacturing in a time of cri-sis. In: Ekonomika a manažment podnikov 2010. CD ROM. Zvolen.
8. Jerzemowska, M., 2006: Analiza ekonomiczna w przed-siębiorstwie. PWE, Warszawa 2006, pp. 137-138. 9. Kropivšek, J.; Jelačić, D.; Grošelj, P., 2011: Motivating
Employees of Slovenian and Croatian Wood-industry Companies in Times of Economic Downturn. Drvna in-dustrija, 62 (2): 97-103.
http://dx.doi.org/10.5552/drind.2011.1040
10. Lane, P.R., 2012: Financial Globalisation and the Crisis. Open Economies Review.
11. Motik, D.; Šegotić, K.; Jazbec, A., 2010: Application of AHP model and survey results in deciding on a product line in furniture industry. Drvna industrija, 61(2), 83-87. 12. Mojon, B., 2010: The 2007-2009 Financial Crisis and the
European Central Bank. Open Economies Review, 21: 175-182 http://dx.doi.org/10.1007/s11079-009-9151-7. 13. Prikhod’ko, T.I., 2011: Structural Changes in Ukraine’s
Economy: The Effect of Internal and External Factors and the Consequences of the Global Crisis. Studies on Russian Economic Development, 22: 544-556
http://dx.doi.org/10.1134/S1075700711050078.
14. Siedlecka, U., 2001: Metody analizy korelacji i regresji Statystyka. Elementy teorii i zadania, S. Ostasiewicz, Z. Rusnak, U. Siedlecka. Wydawnictwo Akademii Ekono-micznej O. Langego we Wrocławiu, Wrocław, pp. 310-311.
15. Sierpińska, M.; Jachna, T., 2004: Ocena przedsiębiorstw według standardów światowych, PWN, Warszawa, pp. 166-171.
16. Śliwa, J.; Wymysłowski, S., 2003: Jak oceniać kondycję fi nansową przedsiębiorstwa. In: Finanse fi rmy. Jak zarzą -dzać kapitałem, W . Szczęsny (red.). Wydawnictwo C. H. Beck, Warszawa, pp. 230-231, 226.
17. *** Furniture and other manufacturing activities, 2007. http://epp.eurostat.ec.europa.eu/cache/ITY_OFFPUB/ KS-BW-07-001-11/EN/KS-BW-07-001-11-EN.PDF (ac-cessed Jan. 30, 2013).
Corresponding address:
EMILIA GRZEGORZEWSKA, Ph. D.
Department of Technology and Entrepreneurship in Wood Industry
Faculty of Wood Technology
Warsaw University of Life Sciences-SGGW
Nowoursynowska str. 159; 02-776 Warsaw, POLAND e-mail: emilia_grzegorzewska@sggw.pl