THE INCREASING TREND OF MEDICAL TOURIST FROM NORTH SUMATERA TO MALAYSIA: ANALYSIS ON SOCIO-ECONOMIC FACTORS
DestanulAulia, Ph.D student of IKMAS and Lecturer of University of North Sumatera Sri FajarAyu, DBA, Lecturer of University of North Sumatera, Indonesia
Abstract
It is MacReady (2007) who believed that there will be an up in the trend of medical tourism, this industry will grow about 20% worldwide. This could happen because of the socioe-conomic factors that support this condition. As reported by SERI (2004), Leng (2006) and Tourism Malaysia (2010), Indonesian patients have been the largest foreign patients visited Malaysia. This trend is interesting to learn further and this study aims at finding out the macroeconomic factors which have influenced the numbers of people from North Sumatera seeking for medical treatment in Malaysia. Using secondary data, this survey study has regressed the number of North Sumatran medical tourist (as the
dependent variable) for the period of 2000-2011 to the independent variables such as exchange rate, inflation and income per capita in order to find out the economic determinant of number of medical tourists from North Sumatera. The
demographic determinant choosen to study as the only independent variable is population for the same period of study. Finally, in order to incorporate the health seeking behavior point of view, this study used independent variables such as life expectancy, health facilities, number of doctors and level of education as the determinant for the number of medical tourists from North Sumatera. The result of regression for economic determinant showed that income and exchange rate were positively and statistically significant determinant for the number of medical tourists while the independent variable of inflation is not responsive to the
changes in the dependent variable of number of medical tourist. The result of single regression of the independent variable of population was found
Keyword: medical tourism, demand determinant, health seeking behavior
I. Introduction
1.1.Background
Medical tourism is where people often travel long distances to overseas countries to obtain medical, dental and surgical care while simultaneously being
holidaymakers (Connell, 2006). Medical tourism is becoming an increasingly popular option for patients looking to access procedures (typically via out-of-pocket payment) that are seemingly unavailable to them in their home countries. MacReady (2007) believed that there will be an up in the trend of medical tourism; this industry will grow about 20% worldwide. This could happen due to the socioeconomic factors that support this condition.
As reported by SERI (2004), Leng (2006) and Tourism Malaysia (2010) Indonesian patients have been the largest foreign patient visited Malaysia. According to SERI (2004) in 2001, 63.48% of foreign patients were Indonesian, in 2003, around 72.47% of total foreign patients were Indonesian and then in 2009 according to Tourism Malaysia (2010), 69% of medical tourists were from
Indonesia. This trend is interesting to learn further and the question raised here are why Indonesians keep visiting Malaysia. After all, it is a reality that according to the immigration departement of Polonia Airport in Medan, almost 78.000 peoples from North Sumatera go to Malaysia every year to seek for medical treatment.
In order to understand the trends in tourist arrivals, it is necessary to understand the factors that influence those trends. Although tourism demand determinants research can be undertaken based on bothquantitative and qualitative perspective, it is impossible to conduct such a comprehensive study in a single dissertation. According to Turner and Witt (2001), in international tourism demand modeling, most of the previous studies have used the demand function approach to identify the quantitative. This study will focus on a specific number of quantitative factors in order to know the factors influencing those trends of medical tourists.
based on the Marshallian demand function (Varian, 1992; Zaratiegui, 2002). The study of effects of income and price has dominated past modeling of foreign travel demand, because economic theory suggests the vital roles of both in demand functions. Income was usually included in the form of tourism demand function per capita to correspond to the specified demand per capita.
Price is another important factor which was frequently incorporated into the function of travel demand. Historical studies indicate that currency exchange rates were used as a proxy for destination price. The reason is that the rapid changes in exchange rates are perceived more readily by potential foreign travelers than changes in the country’s price levels. Hence, the exchange rate is used as proxy variable for the cost of living in the destination (Tan, 2000), while the inflation rate can be used as the proxy for the country of origin.
The population size of a country is a reflection of the total demand for
international tourism (Creel, 2007). The level of population in a country of origin is expected to affect the total demand for the destination. So, it is important to incorporate population in this study as an independent variable in determining the number of medical tourist.
Beside economic and demographic consideration, the theoretical consideration from the health theory about the health seeking behavior is important to incorporate in this study. The use of health service or health seeking behavior according to Andersen (1995) was affected by the environmental factors,
population characteristics and personal health behavior. Based on this model, the macro variables used were the number of health care facilities, level of education, number of doctors and life expectancy.
II.Methodology
variables life expectancy, health facilities, number of doctors and level of education.
The Model
The most important demographic variable to determine the demand is the population. The problem caused by the variable of population is that the population tends to be highly correlated with the income from the economic determinant. At the same time, the correlated will lead towards multi-collinearity and autocorrelation problems. In order to avoid this problem, this study divides the models into three models. The first model is the economic determinant to the number of medical tourist:
where MT is the dependent variable of number of medical tourist, Inf is the independent variable of inflation, ER is the independent variable of exchange rate and Inc is the independent variable of income. The second model is related to the most important demographic variable of population:
where Pop is the only independent variable of population. The last model or the third model is related to health seeking behavior of medical tourist but in the form of macroeconomics factors:
where LE is the independent variable of life expectancy, Doc is the independent variable of number of doctors, HF is the independent variable of health facilities and Edu is the independent variable of level of education.
Hypotheses
1. H1: medical tourists from North Sumatera were responsive to the changes in inflation, exchange rate and income (all economic variables)
3. H1: the number of medical tourists from North Sumatera were responsive to the changes in life expectancy, number of doctors, level of education and healthcare facilities.
III. Findings and Discussion
1. Relationship between Income, Price, Currency and Number of Medical Tourists
The natural logarithm of number of medical tourists was regressed on the natural logarithm of income, price and currency variables. The results of the regression shown in Table 1.
The value of F on the result of analysis of variance shows that it is significant meaning that, statistically, there is a significant difference among the population means. In addition, the result of regression,β-coefficient, t value and its
significance are shown in Table 2.
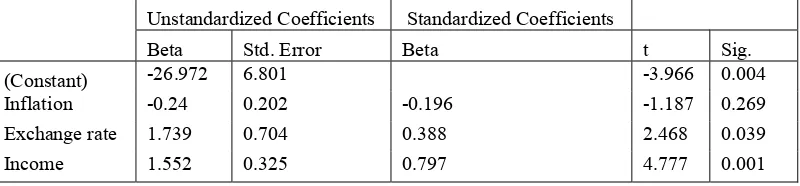
Table 2. The Regression Coefficient
Unstandardized Coefficients Standardized Coefficients
Beta Std. Error Beta t Sig.
(Constant) -26.972 6.801 -3.966 0.004
Inflation -0.24 0.202 -0.196 -1.187 0.269
Exchange rate 1.739 0.704 0.388 2.468 0.039
Income 1.552 0.325 0.797 4.777 0.001
Table 2 shows that income positively and significantly affected the number of tourist, with beta value 1.552. This result is quite the same as that of many previous researches such as the result of empirical studies by Carey (1991) who found that income is the most significant variable in explaining tourism demand. According to Creel (2007), income has a significant role in the function of demand and for the demand of product or service to exist, income must be
Sum of Squares Df Mean Square F Sig.
Regression 1.226 3 .409 11.572 .003
Residual .283 8 .035
present. The result of this study also shows that the value of beta of income is positive; this is a confirmation of the suggestion that for a demand of product or service to exist, income must be present. The result of the study conducted in Malaysia by Hanafiah, Harun and Jamaluddin (2010) also showed that GDP as the proxy for income significantly affected the number of tourist arrivals in Malaysia.
According to Di Matteo (1999) the currency exchange rate has a significant impact upon the relative price of international tourist destinations. The same results found in this study. The value of beta coefficient is positive meaning that the stronger the Indonesia Rupiah compared to the currency of destination country (Malaysia) the more medical tourists will visit Malaysia. This means that the tourist directly perceive that the cost of tourism in the destination country is cheaper when the Indonesian Rupiah is stronger. This finding is quite the same as that of the previous researches done by Gray (1966), Martin and Witt (1987), Rosensweig (1986), Crouch (1995) andEilat and Einav (2004).
The variable of inflation used in this study was to reflect the purchasing power of the country of origin. The β coefficient as shown in Table 2 was negative. This means that the higher the inflation, the lower the number of medical tourists. However, it can also be concluded that the rate of inflation is not responsive to the number of medical tourists, because, based on the regression, the result of the variable of inflation did not significantly affect the number of medical tourists. A similar finding was found for the study of the determinant of the number of tourist arrivals in Guam from the Phillipine, Taiwan and Hongkong by Creel (2007).
As the result of the multiple regression, the model of the economic determinant:
where MT is the dependent variable of number of medical tourist, Inf is the independent variable of inflation, ER is the independent variable of exchange rate and Inc is the independent variable of income.
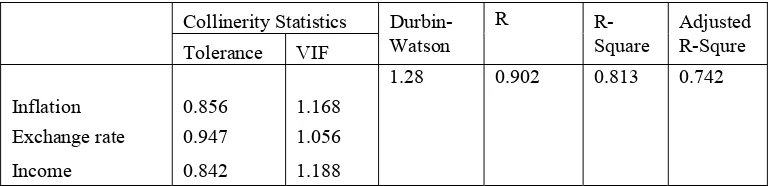
It is found that there is no multi-collinearity between the independent variables (Table 3.). The Durbin-Watson value also shows that there are no autocorrelation. Finally, the value of R-square or coefficient of determination shows that all of the three variables show high explanatory power.
Collinerity Statistics Durbin- R R- Adjusted
Tolerance VIF Watson Square R-Squre
1.28 0.902 0.813 0.742
Inflation 0.856 1.168
Exchange rate 0.947 1.056
Income 0.842 1.188
2. The Relationship between Population and Number of Medical Tourists
The result of single regression between population and the number of medical tourists is shown in Table 4.
Table 4.The Result of Regression Analysis between Population and Number of Medical Tourist
Unstandardized Coefficients t Sig. ANOVA R-Squre Adjusted
Beta Std. Error F Sig. R-Squre
92.914 0.000 0.903 0.893
(Constant) -104.91 12.007 -8.74 0.000
Population 7.085 0.735 9.64 0.000
Theoretically, the level of population in a country of origin is expected to affect the total demand for the destination. The result of the single regression, as expected, positively and significantly has affected the number of medical tourist shown by the t value for individual coefficient and F-value from analysis of variance. The R-square also shows high explanatory power, with R-square 90%. Finally based on the result of regression that model is:
, where Pop is the only independent variable population.
3. The Relationship between Number of Health Facility, Level of Education, Number of Doctors and Number of Medical Tourists
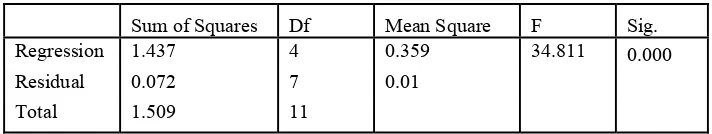
The result of analysis of variance showing the value of F along with its significance is shown in Table 5.
Sum of Squares Df Mean Square F Sig.
Regression 1.437 4 0.359 34.811 0.000
Residual 0.072 7 0.01
Total 1.509 11
Table 5 shows that the result of analysisof variance for the dependent variable of number of medical tourist and the predictor level of education, number of health facilities, life expectancy and number of doctors is significant based on its F- value. Further result of this multiple regression is shown in Table 6 that will describe the beta and t-value for each coefficient.
Table 6. Regression Coefficient
Unstandardized Coefficients Standardized Coefficients
Beta Std. Error Beta t Sig.
(Constant) -30.309 19.48 -1.556 0.164
Life expectancy 26.008 10.584 0.446 2.457 0.044
Number of doctors 0.476 0.233 0.438 2.047 0.08
Health facilities -2.477 0.754 -0.366 -3.285 0.013
Level of Education 0.22 0.223 0.2 0.989 0.356
Life expectancy, according to Greene (1999), is an epidemiological concept. It refers to the average duration of time that individuals of a given age can expect to live. However, he also suggested that no variable relates more consistently to mortality and morbidity than age does. This means that the higher the life
expectancy, the higher the need for medical care, the more people seeking health care inside or outside of their country. So, the higher the life expectancy can result in the increase in the number of medical tourists. This is shown by the result of multiple regression tests between the independent variable of life expectancy and the number of medical tourists. Therefore, it can be concluded that the number of medical tourist is responsive to the changes in life expectancy.
the number of doctors. It is understandable because the ratio between doctors and the number of population in Indonesia is so small, only around 2 per 10.000 population and the growth in number of doctors is slower (9%) compared to the trend of medical tourism (20%).
Health facilities contributed negatively and significantly to the number of medical tourist. This means that the higher the facilities, the lower the number of medical tourist. Good facilities or at least the same level facilities will persuade medical tourists especially from North Sumatera not to travel to seek for medical treatment out of their country. With this entrance, big healthcare company that used to cater medical tourist around the world may come to North Sumatera and it is reasonable that the facilities it brings can lower the number medical tourists.
Based on beta value, the level of education positively contributed to the number of medical tourists. The level of education used in this study is the number of the population with university education. This positive relationship can be true because the previous research done by the same author found that most of the medical tourist level of education is quite high. On the other side, the number of population with university education is small, on an average of only 2.7% out of the whole population. So, it is understandable if, statistically, the result found is insignificant. Finally, the model is:
where LE is the independent variable of life expectancy, Doc is the independent variable of number of doctors, HF is the independent variable of health facilities and Edu is the independent variable of level of education.
The issue of multi-collinearity and auto-correlation is sensitive in this regression model. The inclusion of other independent variable such as population will make a serious problem of multi-collinearity and autocorrelation. However, this study used separate model for independent variable population. The coefficient of tolerance, VIF, Durbin-Watson, R Square value for health seeking behavior determinant for the number of medical tourist model is shown by Table 7. :
Table 7.The Tolerance, VIF, Durbin-Watson, R and R Square Value
Collinerity Statistics Durbin- R- Adjusted
1.29 0.952 0.925
Life expectancy 0.207 4.821
Number of doctors 0.149 6.692
Health facilities 0.551 1.814
Level of Education 0.167 5.985
The table basically shows that the tolerance value and the VIF value for all of each variables reveals no multi-collinearity in the model. The Durbin Watson value also proves that there is no significant auto-correlation in the model. Finally, the model shows that the explanatory power which is around 95% is a quite
powerful model.
Conclusion
Based on the economic determinant chosen to be studied in this paper, the alternative hypotheses that the medical tourists from North Sumatera were responsive to the changes in exchange rate and income and not responsive to the changes in inflation is accepted in this study. While for the demographic
determinant, the single regression shows that changes in population positively and significantly affected the number of North Sumatran medical tourists. The result of multiple regression technique, from four factors of hypothesized patient health seeking behavior affected the number of medical tourists, the number of medical tourists from North Sumatera were found responsive to the changes in life
expectancy and the number of healthcare facilities only, while the variables of the number of doctors and level of education were found insignificant.
References
Andersen R.M. 1995. Revisiting the behavioral model and access to medical care: Does it matter? Journal of Health and Social Behavior 36(1):1-10
Connell, J. 2006. Medical tourism: Sea, sun, sand and surgery. Tourism
Management27(6):1093–1100.
Crouch, G. I. (1995). A meta-analysis of tourism demand.Annals of Tourism
Research, 22(1), 103-118.
Di Matteo, J. 1999. Using alternative methods to estimate the determinants of cross-border trips.Applied Economics 31:77-88.
Eilat, Y. & Einav, L. (2004). Determinants of international tourism: A three-dimensional panel data analysis. Applied Economics, 36(12), 1315-1327.
Garin-Munoz, T. &Amaral, T. P. (2000). An econometric model for international tourism flows to Spain. Applied Economics Letters, 7(8), 525-529.
Greene, W. H. (2003). Econometric analysis (5th ed.). Upper Saddle River, NJ: Prentice Hall, Inc.
Gu, H. &Kavanaugh, R. R. (2006). A critique of market analysis for suburban tourism in Beijing, China.Journal of Vacation Marketing, 12(1), 27-39.
Kauffman, P. (2007). Global tourism winners: How countries and companies succeed in tourism. The Business Review, Cambridge, 8(1), 107-113.
MacReady, N. (2007). Developing countries court medical tourists. The Lancet, 369(9576):18-49.
Martin C. A. and Witt, S. F. (1987). Tourism demand forecsting models: Choice of appropriate variable to represent tourists’ cost of living. Tourism Management 8(3)233-245
Hanafiah, M.H.,Harun, M. F. and Jamaluddin, M. R. 2010. Bilateral trade and tourism demand. World Applied Sciences Journal 10:110-114
Turner, L.W. and S.F. Witt, 2001. Factors influencing demand for international tourism: Tourism demand analysis using structural equation modeling. Tourism
Economics 7(1): 21-38.
Varian, H. (1992).Microeconomic analysis (3rd ed.). New York: W.W. Norton & Company
Zaratiegui, J. M. (2002). Marshallian demand function and the adjustment of competitive markets.International Journal of Applied Economics &